Fig. 23
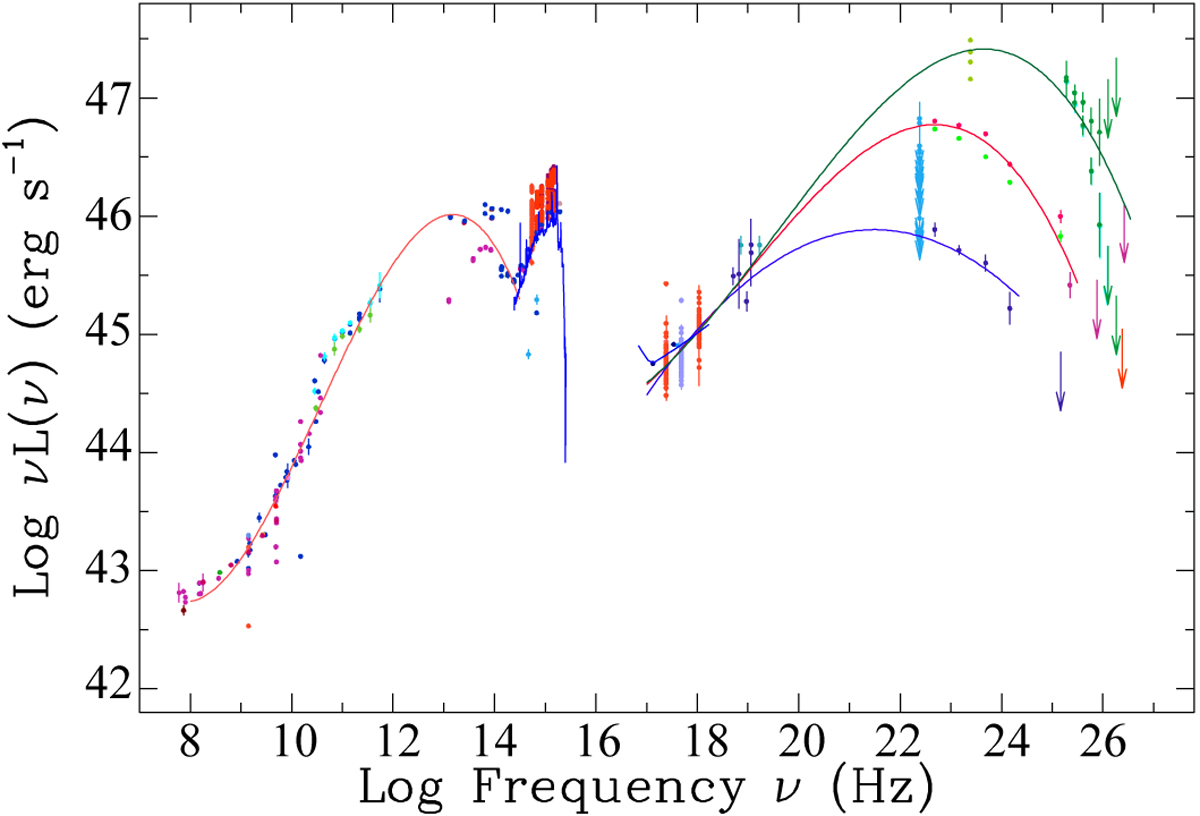
SED for BZQJ 1224+2122, with blue bump template assuming z = 0.434. This source has the largest γ-ray variability index, and we fit the IC component during various flaring states. In the high-energy band, the blue line refers to the 1FGL detection (integrating 2008–2009 data), the red line refers to the 3FGL detection (2008–2012 data), and the dark-green line represents a short and relatively bright flare reported by the MAGIC team Aleksić et al. (2011) with reported variability within few hours.
Current usage metrics show cumulative count of Article Views (full-text article views including HTML views, PDF and ePub downloads, according to the available data) and Abstracts Views on Vision4Press platform.
Data correspond to usage on the plateform after 2015. The current usage metrics is available 48-96 hours after online publication and is updated daily on week days.
Initial download of the metrics may take a while.