Fig. 4
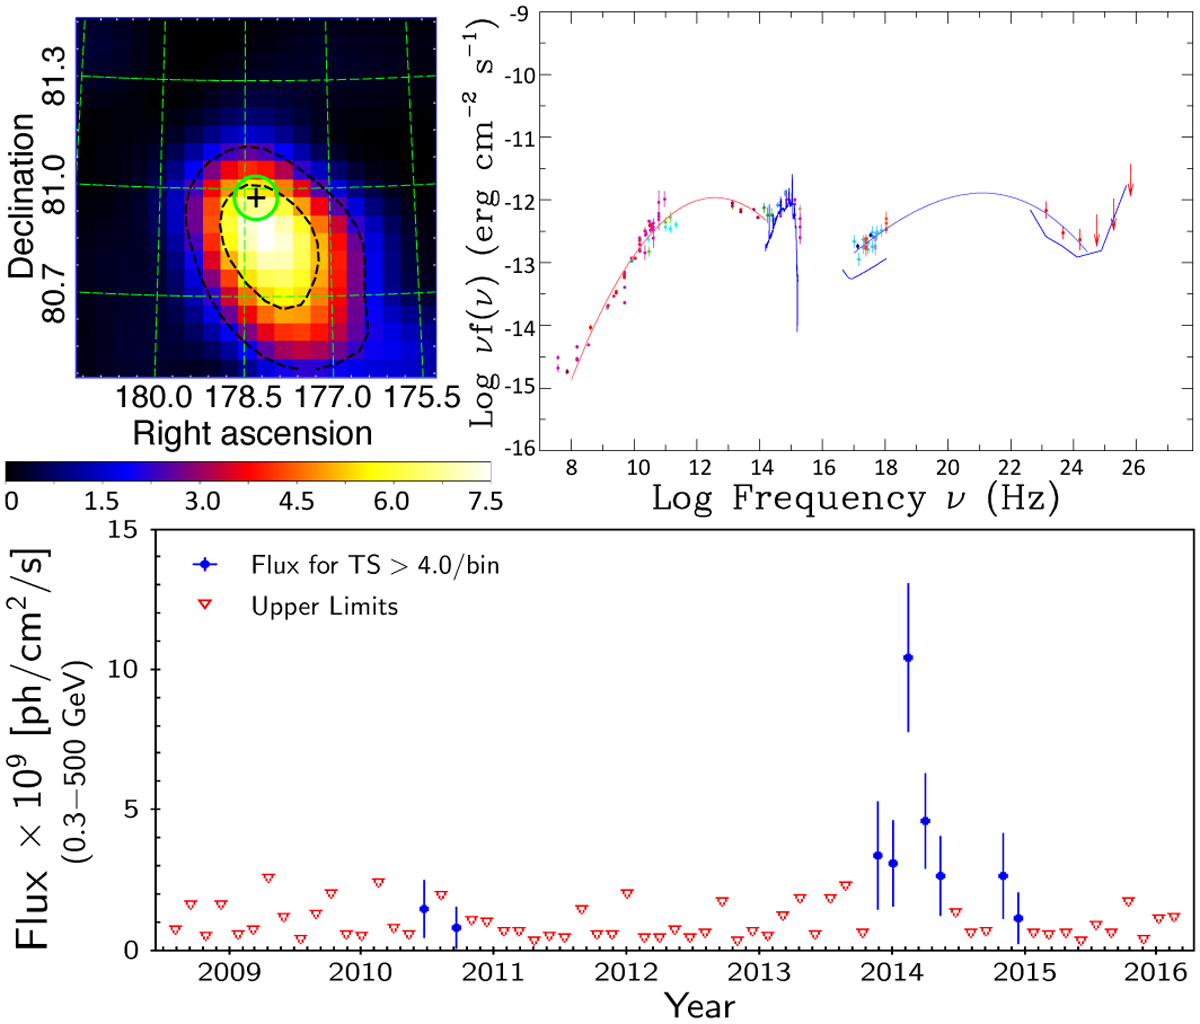
5BZQJ 1153+8058. Top left panel: TS map using E > 3.0 GeV photons collected during the 2014 flaring period. Top right panel: SED for 5BZQJ 1153+8058 also showing the template for thermal emission from accretion in the range 1014 –1018 Hz assuming z = 1.250. Bottom panel: the γ-ray light curve for 5BZQJ 1153+8058 along 7.5 yr.
Current usage metrics show cumulative count of Article Views (full-text article views including HTML views, PDF and ePub downloads, according to the available data) and Abstracts Views on Vision4Press platform.
Data correspond to usage on the plateform after 2015. The current usage metrics is available 48-96 hours after online publication and is updated daily on week days.
Initial download of the metrics may take a while.