Fig. 12
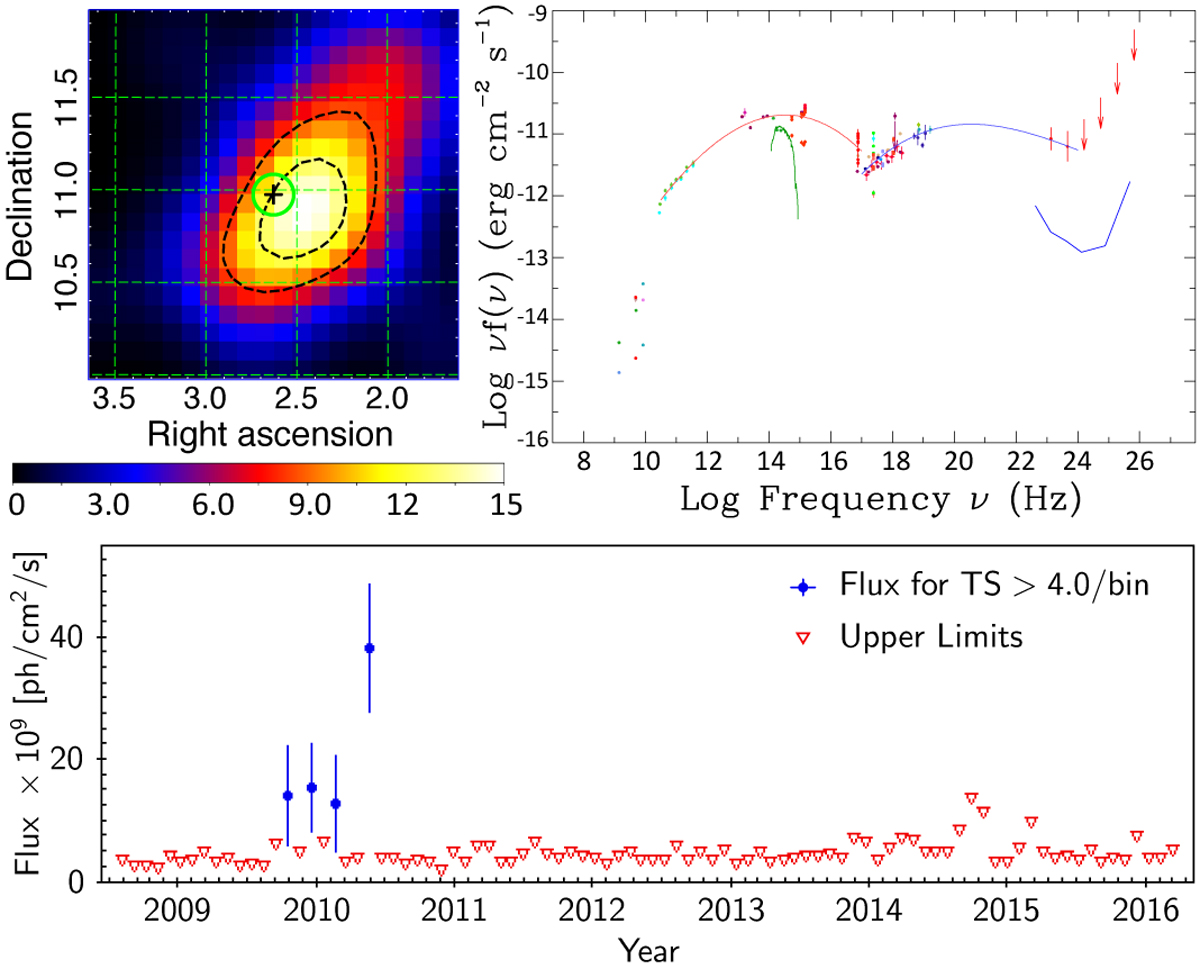
5BZQJ0010+1058. Top left panel: TS map considering E > 500 MeV photons during a short-flare episode at MET: 296164808–298860398. Black dashed lines representing 68% and 95% containmentregion for the γ-ray signature. Top right panel: the corresponding SED of this object. Bottom panel: light curve for 5BZQJ 0010+1058 background extracted with likelihood analysis; flux points are calculated only for bins having TS > 4 with a 30 day time bin along 7.5 yr of observations, integrating 0.3–500 GeV photons.
Current usage metrics show cumulative count of Article Views (full-text article views including HTML views, PDF and ePub downloads, according to the available data) and Abstracts Views on Vision4Press platform.
Data correspond to usage on the plateform after 2015. The current usage metrics is available 48-96 hours after online publication and is updated daily on week days.
Initial download of the metrics may take a while.