Free Access
Fig. 21
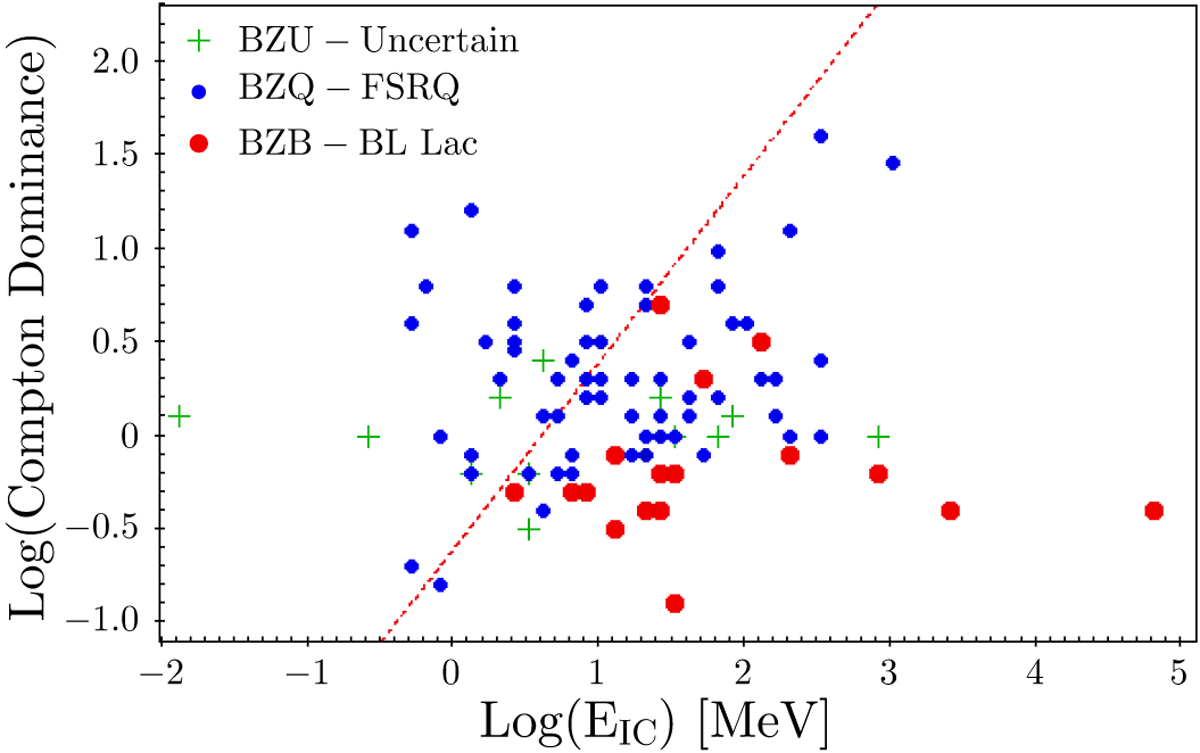
Compton dominance vs. energy associated with the IC peak (EIC) for the Radio-Planck sample. We plot FSRQs as blue dots, BL Lacs as red dots, and uncertain blazars as green crosses. The red dotted line sets a qualitative cut to highlight the region populated by BL Lacs.
Current usage metrics show cumulative count of Article Views (full-text article views including HTML views, PDF and ePub downloads, according to the available data) and Abstracts Views on Vision4Press platform.
Data correspond to usage on the plateform after 2015. The current usage metrics is available 48-96 hours after online publication and is updated daily on week days.
Initial download of the metrics may take a while.