Fig. 20
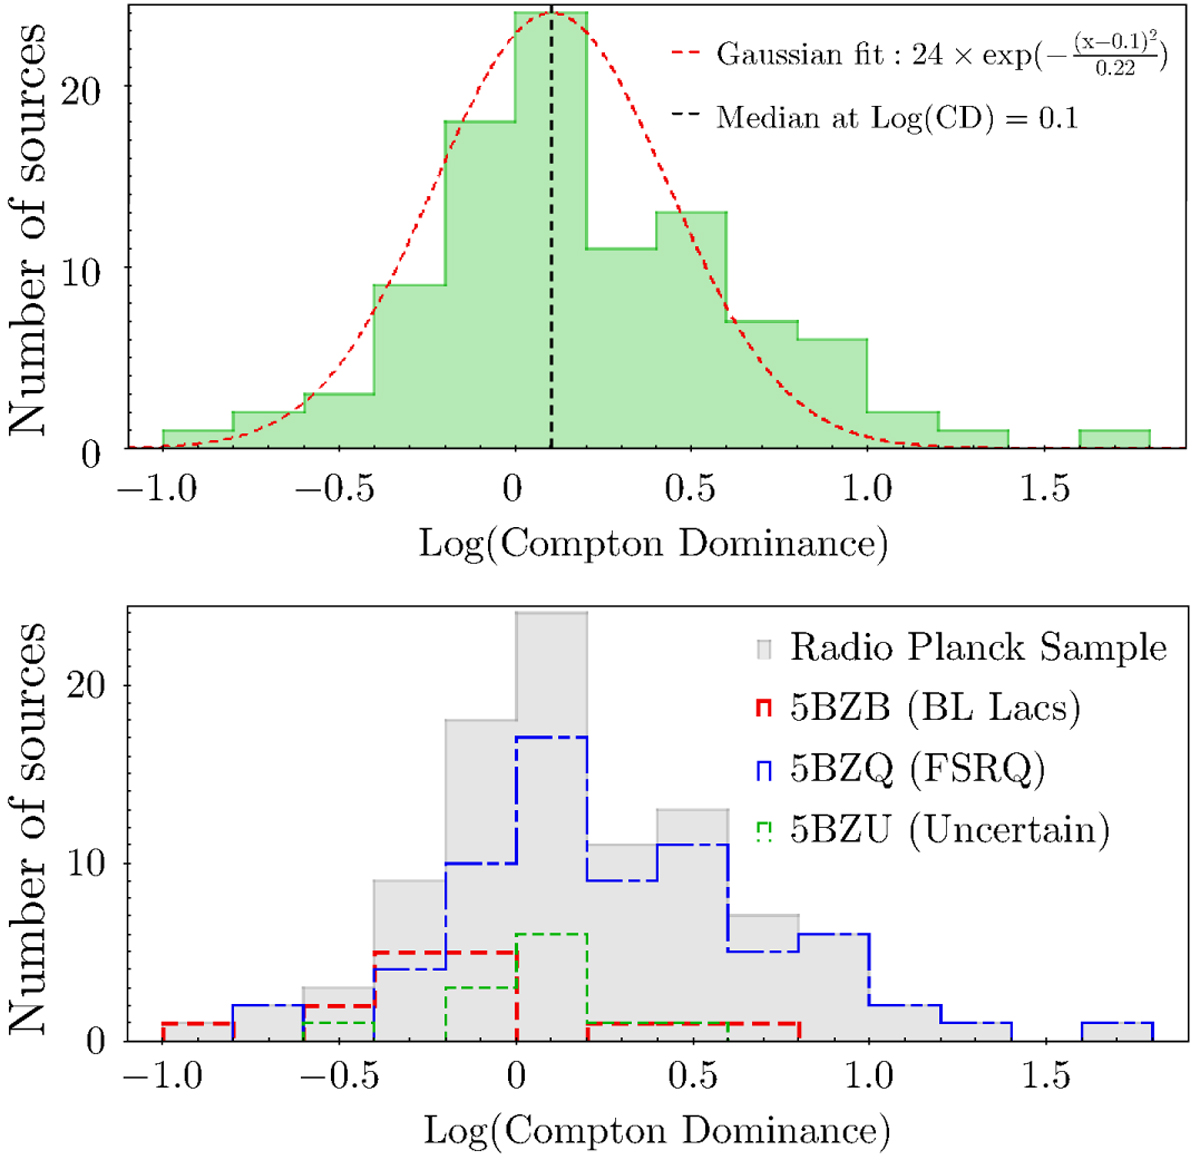
Log(CD) distribution for the Radio-Planck sample. Top panel: the green bars represent all 99 cases that have Syn + IC data available for calculating the CD parameter. The red dashed line represents a Gaussian function with σ2 = 0.22 around the median value of log(CD) = 0.1. Bottom panel: the log(CD) distribution for BL Lacs (red dashed lines), FSRQ (blue dot-dashed lines), and blazars classified as uncertain are shown in green dashed lines.
Current usage metrics show cumulative count of Article Views (full-text article views including HTML views, PDF and ePub downloads, according to the available data) and Abstracts Views on Vision4Press platform.
Data correspond to usage on the plateform after 2015. The current usage metrics is available 48-96 hours after online publication and is updated daily on week days.
Initial download of the metrics may take a while.