Fig. 2
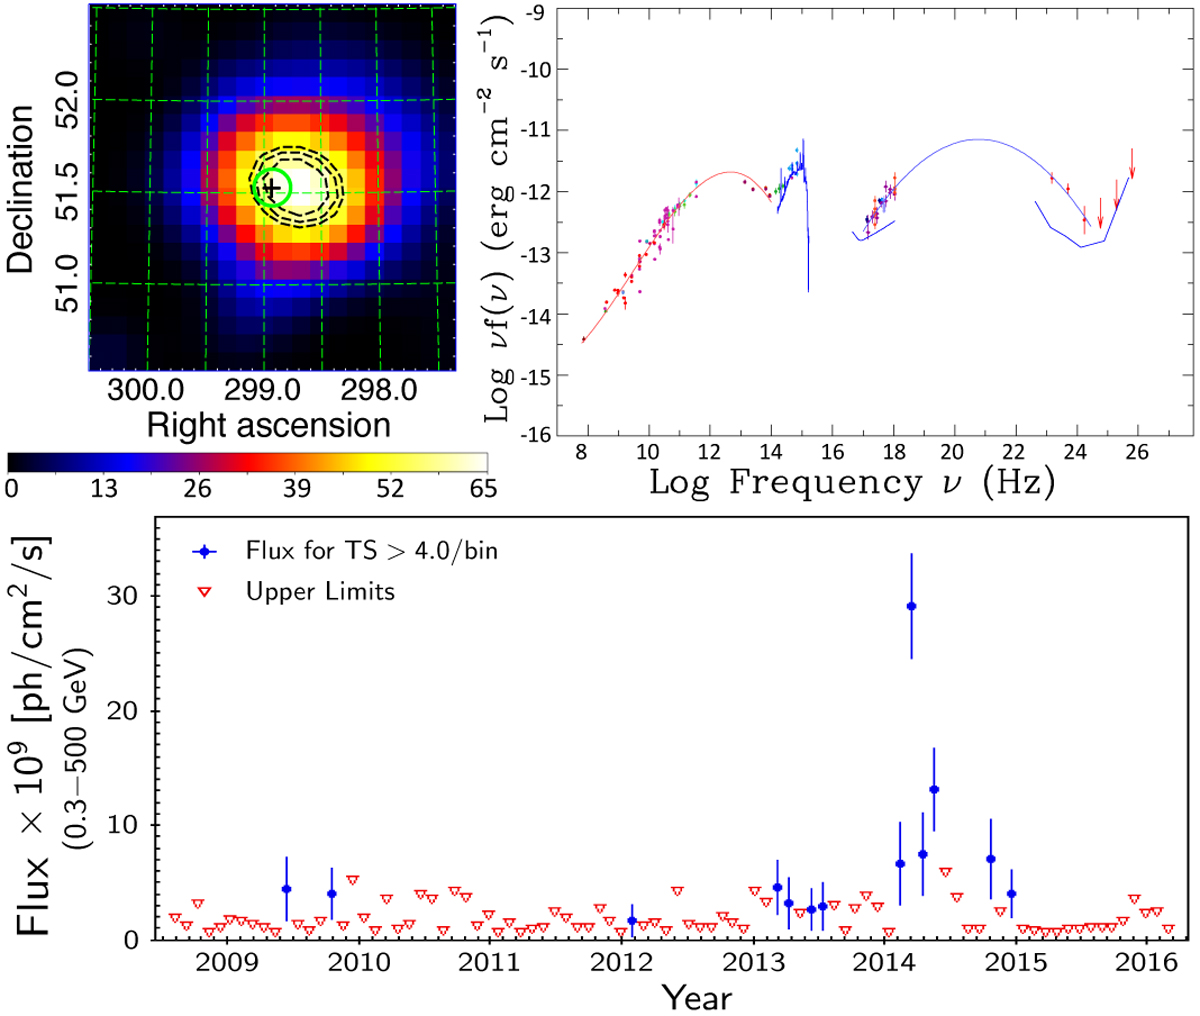
BZQJ 1955+5131. Top left panel: TS map considering only E > 0.5 GeV photons, during the high-state period between 2014 and 2015. Top right panel: SED for 5BZQJ 1955+5131 at z = 1.21, with the newγ-ray spectrum in the 0.3–500 GeV band. As example, in the 1022 –1026 Hz band (0.1–500 GeV), we show the Fermi-LAT sensitivity limit when integrating over four year of observations. Bottom panel: the γ-ray light curve for 5BZQJ 1955+5131 along 7.5 yr of observations and with time bin of 30 days.
Current usage metrics show cumulative count of Article Views (full-text article views including HTML views, PDF and ePub downloads, according to the available data) and Abstracts Views on Vision4Press platform.
Data correspond to usage on the plateform after 2015. The current usage metrics is available 48-96 hours after online publication and is updated daily on week days.
Initial download of the metrics may take a while.