Free Access
Fig. 11
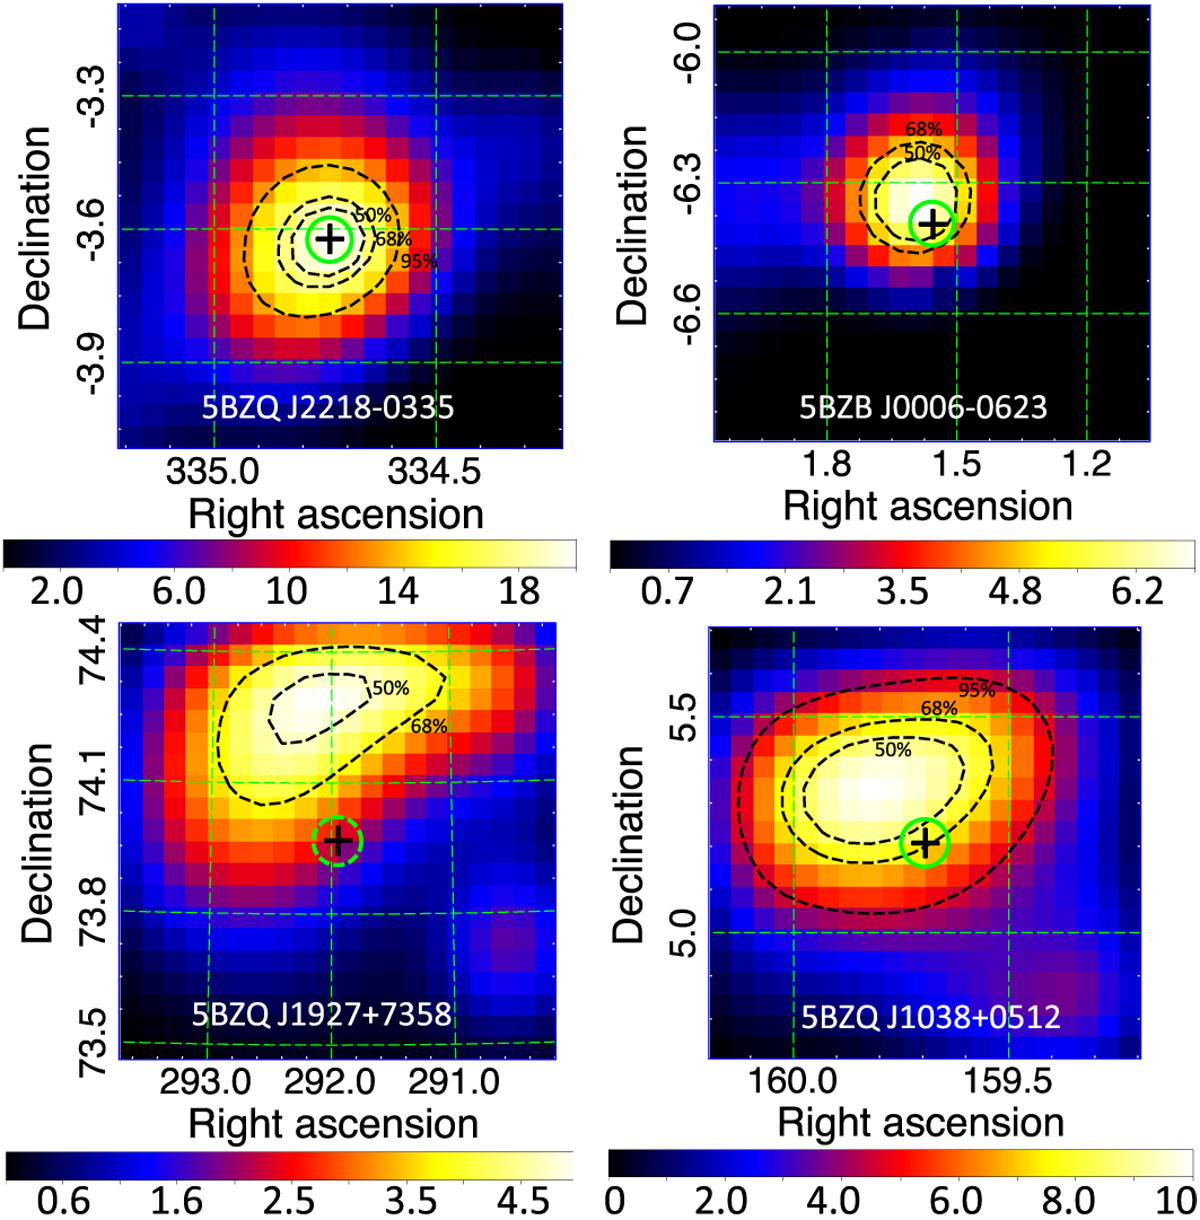
TS maps for the low-significance γ-ray detections using only E > 500 MeV photons. For each case the blazar position is highlighted with thick green circle center at “+”. Black dashed lines show the 50%, 68%, and 95% containment radius for the γ-ray signature.
Current usage metrics show cumulative count of Article Views (full-text article views including HTML views, PDF and ePub downloads, according to the available data) and Abstracts Views on Vision4Press platform.
Data correspond to usage on the plateform after 2015. The current usage metrics is available 48-96 hours after online publication and is updated daily on week days.
Initial download of the metrics may take a while.