Fig. 15
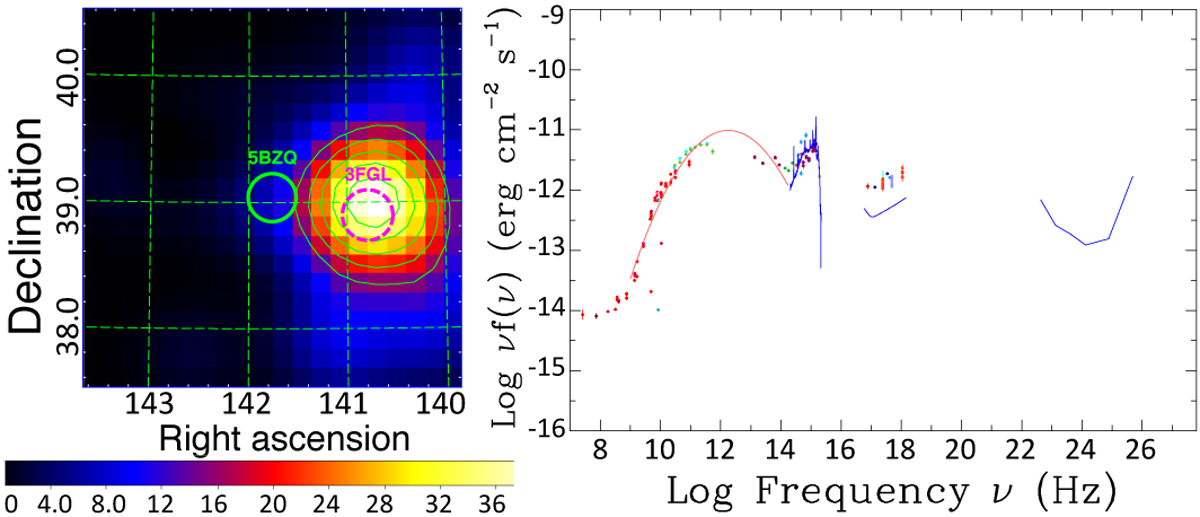
5BZQJ 0927+3902. Left panel: TS map for 750–950 MeV photons. The blazar 5BZQJ 0927+3902 is highlighted as a green circle and 3FGL is shown in magenta. Right panel: the SED with a polynomial fit to the mean Syn and the blue-bump template are represented for z = 0.695. In the γ-ray band, the blue curve in the 1022–1026Hz band (0.1–500 GeV) represents the Fermi-LAT four year sensitivity threshold, therefore an upper limit for the γ-ray emission.
Current usage metrics show cumulative count of Article Views (full-text article views including HTML views, PDF and ePub downloads, according to the available data) and Abstracts Views on Vision4Press platform.
Data correspond to usage on the plateform after 2015. The current usage metrics is available 48-96 hours after online publication and is updated daily on week days.
Initial download of the metrics may take a while.