Fig. 13
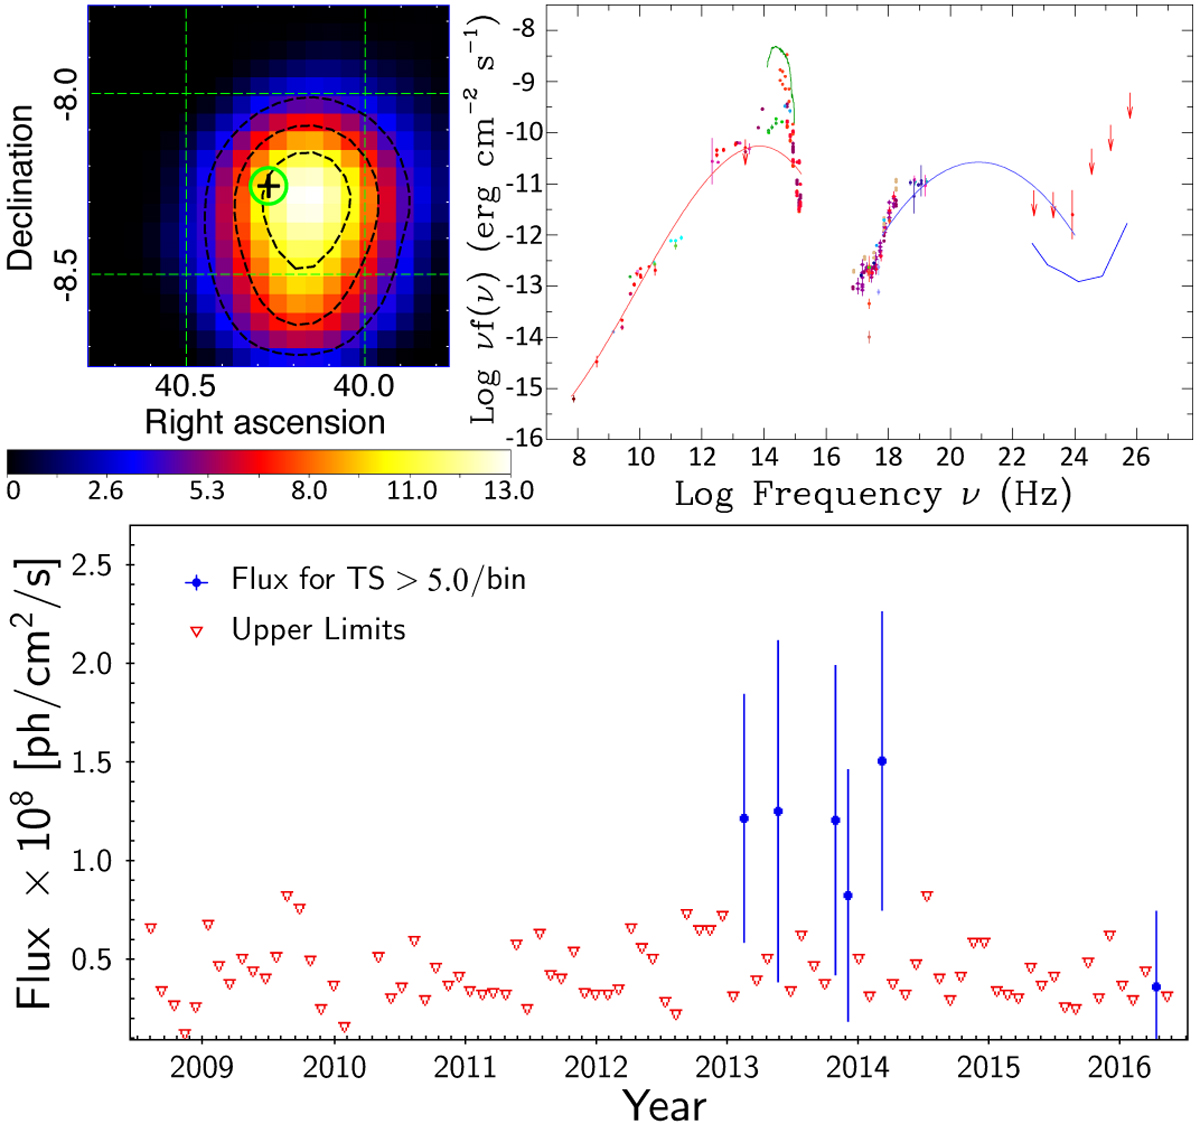
5BZUJ 0241–0815. Top left panel: TS map for E > 500 MeV during a short-flare episode at MET: 415846402-418598890. The blazar position is highlighted by the green circle center at “+”; the black dashed-lines are TS surfaces corresponding 68%, 95%, and 99% confinement region for the γ-ray signature. Top right panel: the corresponding SED of this object; the green template corresponds to the elliptical galaxy emission at z = 0.005. Bottom panel: light curve for 5BZU J0241–0815. Flux points are only calculated for bins with TS > 5 with a 30 day time bin along 7.5 yr of observations, integrating 0.3–500 GeV photons.
Current usage metrics show cumulative count of Article Views (full-text article views including HTML views, PDF and ePub downloads, according to the available data) and Abstracts Views on Vision4Press platform.
Data correspond to usage on the plateform after 2015. The current usage metrics is available 48-96 hours after online publication and is updated daily on week days.
Initial download of the metrics may take a while.