Fig. 8
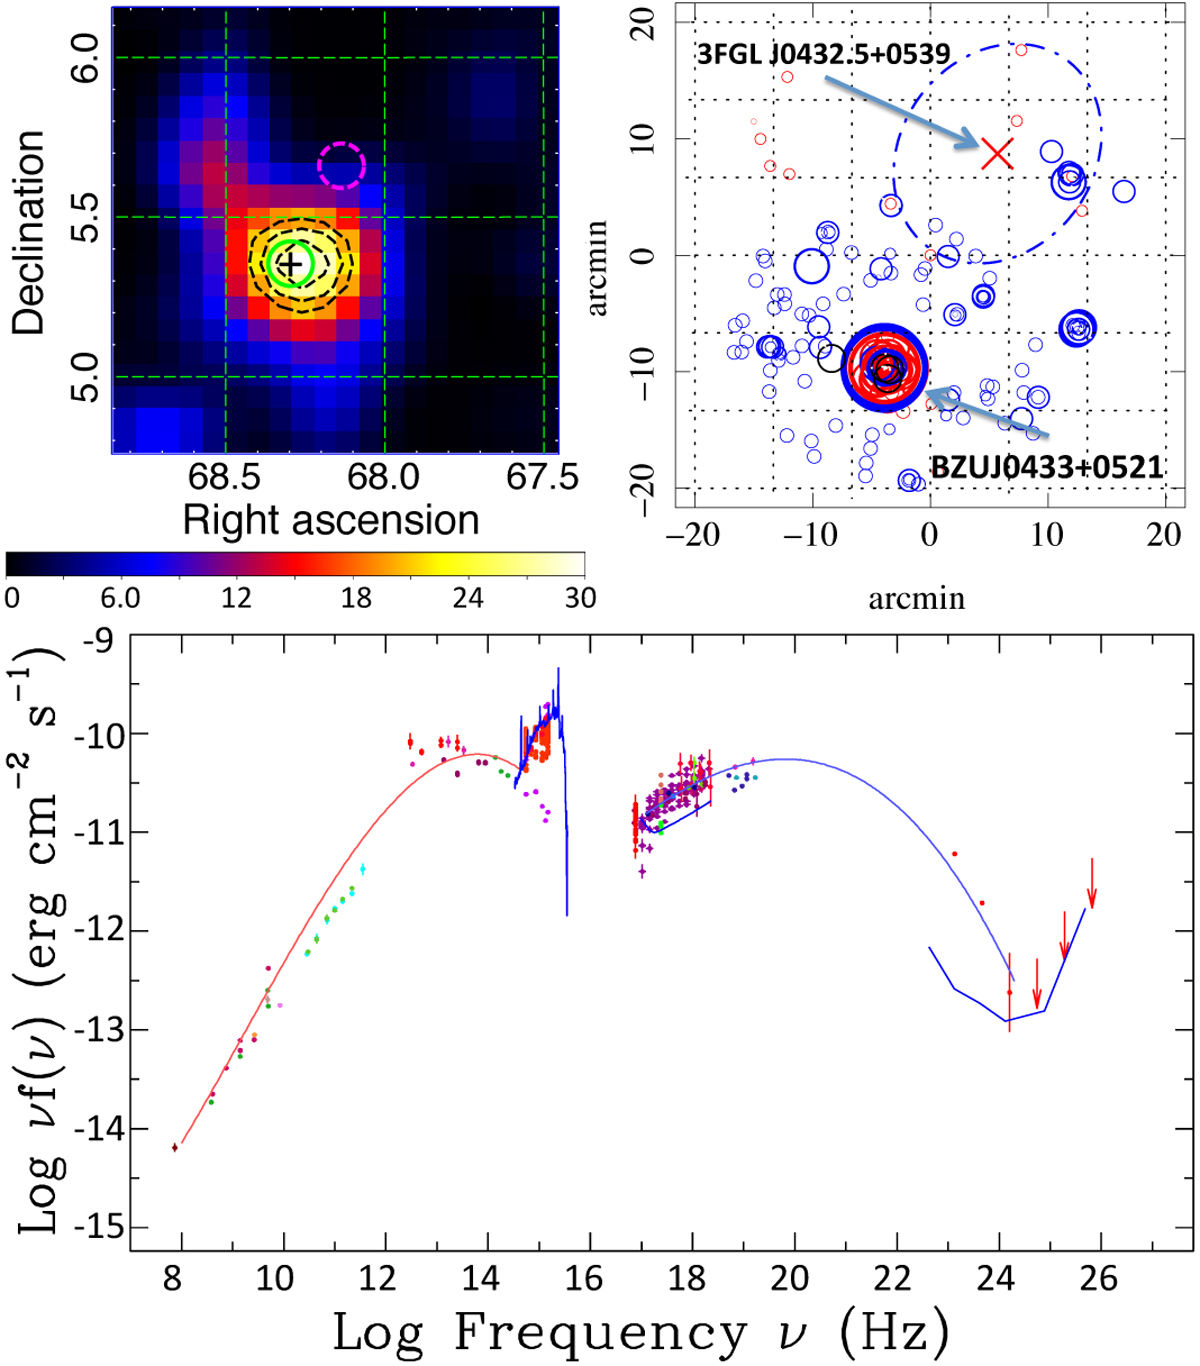
5BZUJ 0433+0521. Top left panel: TS map built using only photons with E > 2.0 GeV; Black dashed lines show 68%, 95%, and 99% confinement regions. The position of a nearby BZU source is highlighted by the green circle around the “+” marker, while 3FGL detection is center on the magenta dashed circle. Top right panel: an image obtained from the SSDC Sky-Explorer showing that 5BZUJ 0433+0521 position is inconsistent with 3FGLJ 0432.5+0539 detection also taking into account its 95% positional uncertainty (dot-dahsed ellipse). Blue and red circles represent respectively X-ray and radio frequency detections in the same region as taken from publicly available data. Bottom panel: SED for 5BZUJ 0433+0521 with blue bump template for z = 0.033.
Current usage metrics show cumulative count of Article Views (full-text article views including HTML views, PDF and ePub downloads, according to the available data) and Abstracts Views on Vision4Press platform.
Data correspond to usage on the plateform after 2015. The current usage metrics is available 48-96 hours after online publication and is updated daily on week days.
Initial download of the metrics may take a while.