| Issue |
A&A
Volume 694, February 2025
|
|
|---|---|---|
| Article Number | A24 | |
| Number of page(s) | 36 | |
| Section | Interstellar and circumstellar matter | |
| DOI | https://doi.org/10.1051/0004-6361/202451931 | |
| Published online | 30 January 2025 | |
ALMA-IMF
XVI. Mass-averaged temperature of cores and protostellar luminosities in the ALMA-IMF protoclusters
1
Univ. Grenoble Alpes, CNRS, IPAG,
38000
Grenoble,
France
2
Instituto de Radioastronomía y Astrofísica, Universidad Nacional Autónoma de México, Morelia,
Michoacán
58089,
México
3
INAF, Osservatorio Astrofisico di Arcetri,
Largo Enrico Fermi 5,
50125
Firenze,
Italy
4
Laboratoire de Physique de l’École Normale Supérieure, ENS, Université PSL, CNRS, Sorbonne Université, Université de Paris,
Paris,
France
5
Observatoire de Paris, PSL University, Sorbonne Université, LERMA,
75014
Paris,
France
6
Université Paris-Saclay, CNRS, Institut d’Astrophysique Spatiale,
91405
Orsay,
France
7
Laboratoire d’astrophysique de Bordeaux, Univ. Bordeaux, CNRS,
B18N, allée Geoffroy Saint-Hilaire,
33615
Pessac,
France
8
Departamento de Astronomía, Universidad de Concepción,
Casilla 160-C,
Concepción,
Chile
9
Franco-Chilean Laboratory for Astronomy, IRL 3386, CNRS and Universidad de Chile,
Santiago,
Chile
10
Department of Astronomy, University of Florida,
PO Box 112055,
USA
11
Université Paris-Saclay, Université Paris Cité, CEA, CNRS, AIM,
91191
Gif-sur-Yvette,
France
12
Departments of Astronomy and Chemistry, University of Virginia,
Charlottesville,
VA
22904,
USA
13
Departamento de Astronomía, Universidad de Chile,
Casilla 36-D,
Santiago,
Chile
14
Institute of Astronomy, National Tsing Hua University,
Hsinchu
30013,
Taiwan
15
SKA Observatory, Jodrell Bank, Lower Withington,
Macclesfield,
SK11 9FT,
United Kingdom
16
Instituto Argentino de Radioastronomía (CCT-La Plata, CONICET; CICPBA),
C.C. No. 5,
1894,
Villa Elisa, Buenos Aires,
Argentina
17
Department of Astronomy, Yunnan University,
Kunming
650091,
People’s Republic of China
18
CSMES, The American University of Paris,
PL111, 2 bis, passage Landrieu,
75007
Paris,
France
19
TNU Observatory, Tay Nguyen University,
567 Le Duan, Ea Tam, Buon Ma Thuot City,
Dak Lak
630000,
Vietnam
20
National Astronomical Observatory of Japan, National Institutes of Natural Sciences,
2-21-1 Osawa, Mitaka,
Tokyo
181-8588,
Japan
21
Department of Astronomical Science, SOKENDAI (The Graduate University for Advanced Studies),
2-21-1 Osawa,
Mitaka, Tokyo
181-8588,
Japan
★ Corresponding author; frederique.motte@univ-grenoblealpes.fr
Received:
20
August
2024
Accepted:
11
November
2024
Context. The ALMA-IMF Large Program imaged 15 massive protoclusters down to a resolution of ~2 kau scales, identifying about 103 star-forming cores. The mass and luminosity of these cores, which are fundamental physical characteristics, are difficult to determine, a problem greatly exacerbated at the distances ≥2 kpc of ALMA-IMF protoclusters.
Aims. We combined new datasets and radiative transfer modeling to characterize these cores. We estimated their mass-averaged temperature and the masses these estimates imply. For one-sixth of the sample, we measured the bolometric luminosities, implementing deblending corrections when necessary.
Methods. We used spectral energy distribution (SED) analysis obtained with the point process mapping (PPMAP) Bayesian procedure, which aims to preserve the best angular resolution of the input data. We extrapolated the luminosity and dust temperature images provided by PPMAP at 2.5″ resolution to estimate those of individual cores, which were identified at higher angular resolution. To do this, we applied approximate radiative transfer relationships between the luminosity of a protostar and the temperature of its surrounding envelope and between the external heating of prestellar cores and their temperatures.
Results. For the first time, we provide data-informed estimates of dust temperatures for 882 cores identified with ALMA-IMF: 17–31 K and 28–79 K (5th and 95th percentiles, up to 127 K) for the 616 prestellar and 266 protostellar cores, respectively. We also measured protostellar luminosities spanning 20–80 000 L⊙.
Conclusions. Dust temperatures previously estimated from SED-based analyses at a comparatively lower resolution validate our method. For hot cores, on the other hand, we estimated systematically lower temperatures than studies based on complex organic molecules. We established a mass-luminosity evolutionary diagram, for the first time at the core spatial resolution and for a large sample of intermediate- to high-mass protostellar cores. The ALMA-IMF data favor a scenario in which protostars accrete their mass from a larger mass reservoir than their host cores.
Key words: circumstellar matter / stars: formation / stars: fundamental parameters / stars: protostars / dust, extinction / ISM: structure
© The Authors 2025
 Open Access article, published by EDP Sciences, under the terms of the Creative Commons Attribution License (https://creativecommons.org/licenses/by/4.0), which permits unrestricted use, distribution, and reproduction in any medium, provided the original work is properly cited.
This article is published in open access under the Subscribe to Open model. Subscribe to A&A to support open access publication.
1 Introduction
Cores are considered to be the gas mass reservoir used for the formation of individual stars or small stellar systems (e.g., McKee & Ostriker 2007; André et al. 2014). Their exact definition is subject to debate (e.g., Louvet et al. 2021), but we assume in this work that cores are dense cloud structures on scales of ~2000 au that form or will soon form stars via gravitational collapse. To distinguish the two cases mentioned above, we refer to prestellar cores as those that are about to collapse under their own gravity. In contrast, protostellar cores are those that, in the midst of their gravitational collapse, contain a central stellar embryo, that is, a protostar. Irrespective of the stage of collapse, the core mass is the most fundamental parameter, while the protostellar luminosity is used to evaluate the evolutionary stage of protostellar cores (e.g., André et al. 2000; Molinari et al. 2008; Duarte-Cabral et al. 2013).
Core mass and protostellar luminosity are two essential physical characteristics to constrain models of star and star cluster formation (e.g., Motte et al. 2018a; Vázquez-Semadeni et al. 2019; Molinari et al. 2019; Peretto et al. 2020). However, the masses of cores depend crucially on the dust temperature and emissivity used to convert their continuum flux, often measured at (sub)millimeter wavelengths, into the total mass of gas and dust. The mass-averaged dust temperature of cores is estimated (when possible) by fitting modified blackbody models to the cold component of their spectral energy distributions (SEDs), whose fluxes are measured at far-infrared, submillimeter, and millimeter wavelengths (e.g., Bontemps et al. 2010a; Könyves et al. 2015; Furlan et al. 2016). As for the luminosity of nearby protostars, they have been estimated by integrating their SEDs, that is by adding a warm component traced in the near-infrared to mid-infrared regimes to the cold component mentioned above (e.g., Bontemps et al. 1996; Dunham et al. 2013).
If measuring these parameters of protostars located in nearby star-forming regions, including the Gould Belt clouds, is a challenge, it is an even more Herculean task regarding protostars located beyond 1 kpc and worse still in galaxies other than the Milky Way. Regardless, when cores are identified with (sub)millimeter interferometers at ~0.1″−1″ resolution, the lack of resolution-matched measurements in the far-infrared regime makes it difficult to build complete, meaningful SEDs and therefore to measure luminosities (e.g., Nguyen Luong et al. 2011; Duarte-Cabral et al. 2013). This is the case for many (sub)millimeter interferometric studies and is particularly true for the ALMA-IMF1 Large Program (see Paper I, Motte et al. 2022), which aims to obtain statistically meaningful results on the origin of the initial mass function (IMF) of stars (see Motte et al. 2018b and Papers III, V, VI, X, XV, Pouteau et al. 2022, 2023; Nony et al. 2023; Armante et al. 2024; Louvet et al. 2024). As ALMA-IMF has captured a large core sample, there is a pressing need for observationally driven constraints on their masses and luminosities. This is the central focus of this paper.
The ALMA-IMF program surveyed 15 massive (2.5–33 × 103 M⊙) relatively nearby (2–5.5 kpc) protoclusters that cover a wide variety of Galactic environments and three evolutionary stages: Young, Intermediate, and Evolved (see Motte et al. 2022). A total noncontiguous area of ~53 pc2 was imaged at 1.3 mm with a matched spatial resolution of ~2000 au across the sample, corresponding to 0.3″−0.9″, depending on the distance of the protoclusters. ALMA-IMF discovered about a thousand cores with masses spanning four decades (Motte et al. 2018b; Pouteau et al. 2022; Louvet et al. 2024). Of the entire ALMA-IMF core sample, around one-fourth are protostellar in nature (Nony et al. 2023; Armante et al. 2024).
The Bayesian point process mapping (PPMAP) procedure proposes a partial solution to the issue of measuring the luminosity and temperature of individual cores since it preserves at best the angular resolution of the best resolved datasets (Marsh et al. 2015, 2017). This procedure was pushed to its extreme by combining mosaics with ~0.5″−0.9″ resolution, which were obtained with the ALMA interferometer at 1.3 mm (Motte et al. 2018b; Pouteau et al. 2022; Armante et al. 2024), with 5.6″−35″ resolution images of Herschel at 70–500 μm (e.g., Nguyen Luong et al. 2013).2 Four dust temperature images were created at 2.5″ angular resolution by the SED fits performed by PPMAP on the ALMA-IMF protoclusters W43-MM1, W43-MM2, W43-MM3, and G012.80 (Motte et al. 2018b; Pouteau et al. 2022; Armante et al. 2024). More recently, Dell’Ova et al. (2024) applied the PPMAP procedure to the entire ALMA-IMF. They produced column density, luminosity, and dust temperature maps at the unprecedented angular resolution of 2.5″, corresponding to 5000–14 000 au at the ALMA-IMF cloud distances. Extrapolation to a higher angular resolution in order to estimate the dust temperature averaged over the mass of the cores, which are ~2000 au in size, is therefore necessary.
Alternatively, molecular lines are powerful tools to determine kinetic temperatures that can then be used to estimate the mass-averaged dust temperature of cores. These generally require follow-up observations at, for instance, the Very Large Array of the NH3 thermometer (e.g., Battersby et al. 2014, Svoboda et al. in prep.) or ALMA observations of multiple transitions of, for example, H2CO, CH3OH, CH3CN, or other complex organic molecules (COMs; e.g., Giannetti et al. 2017; Pols et al. 2018; Molet et al. 2019; Jeff et al. 2024; Izumi et al. 2024). These measurements are hampered by the difficulty of selecting lines tracing exclusively and entirely the core volume. For instance, as part of the ALMA-IMF survey, Brouillet et al. (2022) studied the W43-MM1 protocluster and found that the H2CO lines trace filaments rather than cores and that the filling factors of CH3CHO, CH3OCHO, and CH3OCH3 lines detected toward cores are poorly constrained. A recent study, however, showed that the methyl formate (CH3OCHO, MF) emission is sometimes extended beyond the core size, suggesting that the excitation temperature could be a good proxy, or even a lower limit, for the mass-averaged dust temperature of cores (Bonfand et al. 2024).
The present study proposes a methodology for estimating the mass-averaged temperature of cores detected with ALMA as well as the luminosity of individual high-mass protostars. We combine information from recently published catalogs of ALMA-IMF cores with dust temperature and luminosity images of their cloud environment derived from a new SED analysis (see Sects. 2–3). In Sects. 4–5, we describe in detail the proposed methodology, which based on approximate radiative-transfer relationships allows us to estimate mass-averaged temperatures of protostellar and prestellar cores and protostellar luminosities. We then discuss in Sect. 6 the consistency and differences of our results with previously published estimates, including those based on COM lines, and the limitations of our methodology. Finally, we summarize the paper and present our conclusions in Sect. 7.
2 Catalogs of cores and luminosity peaks
The present study makes extensive use of the ALMA-IMF databases: the core catalogs (see Sect. 2.1), which are taken from companion papers (Papers III, V, X, and XV, Pouteau et al. 2022; Nony et al. 2023; Armante et al. 2024; Louvet et al. 2024), and their association with outflows (including Papers V and X, Nony et al. 2020, 2023; Armante et al. 2024; Valeille-Manet et al. 2024; Nony et al., in prep.) and hot cores (Papers IV and XI, Brouillet et al. 2022; Bonfand et al. 2024). This study also uses luminosity peak catalogs, provided by Paper XII (Dell’Ova et al. 2024), and properties derived for some hot cores by Paper XI (see Sects. 2.2–2.3). In what follows, each of the above sources of information are integrated to classify the population of ALMA-IMF cores, as:
luminous protostellar cores: cores associated with a luminosity peak, outflows, and sometimes a hot core. Several protostellar cores can be associated with a single luminosity peak (see Figs. 1 and D.1).
low-luminosity protostellar cores: cores associated with outflows but no luminosity peak, and rarely associated with a hot core.
prestellar cores: cores neither associated with a detected outflow nor with a hot core.
We outline below all the catalogs and databases used for this key core classification.
2.1 ALMA-IMF prestellar and protostellar cores
Our aim here is to determine the characteristics of as many ALMA-IMF cores as possible. We therefore used the best existing catalogs of cores for each ALMA-IMF protocluster, the most complete studies on the nature of these cores, and also excluded continuum sources whose nature is still too poorly determined.
We used the homogeneous sample of sources obtained by Louvet et al. (2024) for each of the 15 ALMA-IMF protoclusters, but replaced it for the W43-MM1, W43-MM2, W43-MM3, and G012.80 protoclusters by the more complete catalogs of Pouteau et al. (2022), Nony et al. (2023), and Armante et al. (2024). All catalogs are produced by the getsf method (Men’shchikov 2021) that identified and characterized cores in the 1.3 and 3 mm images, that are kept at their original angular resolutions (0.3–0.9″). While Louvet et al. (2024) used the cleanest images, which are computed to be free of contamination by line emission, the other three studies (Pouteau et al. 2022; Nony et al. 2023; Armante et al. 2024) complemented the cleanest continuum images with the most sensitive, bsens, continuum images of ALMA-IMF (see definition in Ginsburg et al. 2022). Moreover, the surveys of the W43 protoclusters used images whose noise has been reduced using the Multi-resolution non-Gaussian Segmentation software (MnGSeg, Robitaille et al. 2019). In total, the published ALMA-IMF catalogs, at the original resolution, contain ~900 sources with typical deconvolved full width at half maximum (FWHM) sizes of 2300 au and fluxes spanning 3 decades.
The flux of these ~900 sources at 1.3 mm generally corresponds to thermal dust emission, with the notable exception of ~10% of these sources that present a 1.3–3 mm flux ratio suggesting their 1.3 mm flux is contaminated by free-free emission Louvet et al. (2024) labeled these sources as potentially contaminated by free-free emission, while Pouteau et al. (2023), Armante et al. (2024), and Bonfand et al. (2024) performed a first-order correction of the 1.3 mm flux of some of these sources. They found that most of them have a 1.3 mm emission, mainly of thermal origin, requiring no correction or a minor correction of 10–50%. These sources are cores that either simply lay on the line-of-sight of free-free emission from a nearby, compact or developed, H II region or could be protostars hosting a hyper-compact (HC) H II region (Hoare et al. 2007). In addition, three cores driving outflows (see below) have their 1.3 mm flux corrected by larger factors and could thus represent high-mass protostars hosting an ultra-compact (UC) H II region while still accreting. Defining the exact nature of these sources is out of the scope of the present paper but will be discussed in Nony et al. in (prep.). Cores whose 1.3 mm flux is corrected for free-free emission are preserved in our core catalog, but subsequent estimates for these objects are more uncertain.
We used studies searching for molecular outflows and hot cores to characterize the ALMA-IMF cores as either prestellar or protostellar in nature. With the exception of the SiO survey of companion paper, Paper IX (Towner et al. 2024), all ALMA-IMF outflow studies used both the CO(2–1) and SiO(5–4) lines, investigated the shape of spectral lines toward and around the cores, and the spatial distribution of their blue-shifted and red-shifted wings (Nony et al. 2020, 2023, and in prep.; Armante et al. 2024; Valeille-Manet et al. 2024). Conducted over the entire ALMA-IMF protocluster sample, the outflow survey of Nony et al. (in prep.) found several hundreds of protostellar cores driving outflows, among which ~35% are quoted tentative. Tentative protostellar cores, with potential indications of outflowing gas, are found either close to other protostellar cores (see, e.g., Nony et al. 2020) or within H II regions where the ionized gas, entrained by the protostellar jet, escapes our detection with molecular tracers (see, e.g., Towner et al. 2024; Armante et al. 2024). Two thirds of the hot core candidates identified by the MF (CH3OCHO) line survey of Bonfand et al. (2024) are associated with a protostellar core driving an outflow. The MF sources associated with neither CO nor SiO outflow could correspond to protostars located in an H II region, or to HCH II sources, whose gas ejection is not detected by molecular lines (Bonfand et al. 2024). They could also pinpoint shock locations (e.g., Lefloch et al. 2017; Csengeri et al. 2017) or correspond to protostars in their early warm-up phase that drive a weak outflow (Bouscasse et al. 2024). The survey of high-velocity outflows driven by high-mass protostellar cores, performed by Valeille-Manet et al. (2024), refer to some of the protostars from Nony et al. (in prep.) as high-mass prestellar core candidates (HMPreSCs). They could be high-mass cores that only host low- to intermediate-mass protostars driving low-velocity outflows.
In total, the ALMA-IMF survey has identified 266 protostellar cores, 616 prestellar core candidates, and 81 sources associated with neither outflows nor hot cores and indicated as potentially contaminated by, but not yet corrected for, free-free emission. As long as the prestellar nature of the last group is not assured, we exclude these ALMA-IMF sources from the present study. The masses of ALMA-IMF cores, computed from their thermal dust emission at 1.3 mm and initial temperature estimates, range from ~0.1 M⊙ to ~200 M⊙ (Motte et al. 2022).
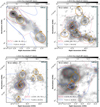 |
Fig. 1 Zoom into the luminosity and temperature peaks, characterized at 2.5″, to identify their associated protostellar and prestellar cores, detected at 0.3″−0.9″ resolution. Example zoom-in regions in our test-case ALMA-IMF protoclusters (the location of zoomed images is shown in Fig. D.1): a) the Evolved G012.80/W33-Main, b) the Young W43-MM1, c) the Young W43-MM2, and d) the Intermediate W43-MM3. Red and blue contours display the PPMAP luminosity and dust temperature map values, respectively, overlaid on the 1.3 mm continuum map shown in the grayscale background. Orange ellipses outline the FWHM size of the luminosity peaks associated with at least one protostellar core (see Dell’Ova et al. 2024, and Table C.2. White ellipses and crosses locate the protostellar and prestellar cores, respectively, identified by Nony et al. (2020), Nony et al. (2023), Nony et al (in prep.), Pouteau et al. (2022), and Armante et al. (2024). A scale bar is shown in the right-hand side of each panel. Some luminosity (and temperature) peaks host two and up to four protostellar cores of 1900 au typical size (see, e.g., P1–5 in panel b and P1 and P5 in panel c). |
2.2 Luminosity peaks in ALMA-IMF protoclusters
The luminosity maps of the ALMA-IMF protoclusters were created by Dell’Ova et al. (2024), with each 2.5″ resolution element of the maps corresponding to the luminosity integrated along the line of sight and over a wide wavelength range. Each SED covers the 3.6–24 μm and the 70 μm−1.3 mm ranges that correspond to what are generally referred to as the warm and cold components of protostellar SEDs (see Dell’Ova et al. 2024, and in particular their Fig. 2 for details). The resulting luminosity images are made up of pixels whose value is the sum of the integration of a spline function to describe the warm SED component and a modified blackbody fit to the cold SED component, fitted by the Bayesian PPMAP technique (Marsh et al. 2015, 2017). The luminosities measured by this procedure are therefore the closest to a bolometric luminosity measurement. Unlike for their dust temperature and column density estimates, Dell’Ova et al. (2024) used ALMA-IMF 1.3 mm images that have not been corrected for free-free emission to create their luminosity images. As a result, the luminosity measured on certain pixels of their images does not correspond to a purely thermal luminosity.
Dell’Ova et al. (2024) used the getsf method (Men’shchikov 2021) to identify and characterize peaks in their luminosity images. The getsf method spatially decomposes the observed image to isolate and separate relatively round sources from elongated structures and a larger-scale background. As a first step, the source detection provides a first-order estimate of the source sizes and luminosities. Improved measurements are then performed on background-subtracted images and provided in a catalog. getsf identified 313 peaks, of which a one-third are associated with one or more protostellar cores that we will discuss below (see, e.g., Fig. 1). Their median size is ~2.8″, leading to a deconvolved physical size range from 2500 au to 7000 au, depending to first order on the distance of the ALMA-IMF protocluster. Their luminosity varies from 2 L⊙ to 75 000 L⊙ with a median of ~360 L⊙. Given the noise level and cloud structure measured in the luminosity images, Dell’Ova et al. (2024) estimate that their census of protostellar groups is complete down to ~30 L⊙ in Young protoclusters but only ~100 L⊙ in Evolved ones. The present study will therefore have difficulty characterizing low-mass protostars, nor will it be complete for intermediate-mass protostars of the ALMA-IMF protoclusters, which are expected to have luminosities of 1–100 L⊙ (e.g., Bontemps et al. 2010a; Duarte-Cabral et al. 2013).
For the ALMA-IMF protoclusters that were classified as Young or Intermediate by Motte et al. (2022), we directly extracted luminosity peaks from the catalog of Dell’Ova et al. (2024). In the case of the four ALMA-IMF protoclusters classified as Evolved (Motte et al. 2022), we performed a novel extraction to improve the measurement of luminosity peaks associated with protostars located at the edge or within H II regions. Following Dell’Ova et al. (2024), we used the getsf algorithm version 230712 (Men’shchikov 2021) to extract luminosity peaks with sizes ranging from one to two times the 2.5″ beam of luminosity images. In contrast to Dell’Ova et al. (2024), here we applied getsf on luminosity images built using the 1.3 mm images corrected from free-free emission (Díaz-González et al. 2023; Galván-Madrid et al. 2024). At the periphery of H II regions, our extraction favors dense structures over photo-dissociation region (PDR) structures, which are associated with free-free emission from these H II regions. This process identifies fewer luminosity peaks, in total 255, and the same 111 luminosity peaks associated with protostellar cores (90% overlap) as the extraction performed on luminosity images constructed with 1.3 mm maps uncorrected for free-free emission (Dell’Ova et al. 2024). Our extraction does, however, better define the size and luminosity of peaks associated with protostellar groups that are located in PDRs because they are too spatially extended and therefore too bright in the catalog of Dell’Ova et al. (2024).
We characterize here the luminosity peaks, that are associated with one or several protostellar cores. This association is positive when the center of at least a protostellar core, taken from the core catalogs described in Sect. 2.1, lies within the ellipse describing the FWHM of the luminosity peaks. Figure 1 presents coincidences of protostellar and prestellar cores identified in the G012.80, W43-MM1, W43-MM2, and W43-MM3 protoclusters (see Nony et al. 2020, 2023, and in prep.; Armante et al. 2024) with luminosity peaks. Luminosity peaks generally, but not univocally, correspond to temperature peaks (see Sect. 3.2), because it is easier for the PPMAP technique to produce luminosity peaks than temperature peaks. All the other coincidences, observed for the 14 studied ALMA-IMF protoclusters3, are presented in Fig. D.1. Each luminosity peak of the ALMA-IMF protoclusters corresponds to one protostar or a protostellar group, composed of up to four protostars and three prestellar cores. Prestellar cores that lie within these luminosity peaks (see, e.g., P1 and P2 in W43-MM1 in Fig. 1b) should only account for a negligible part of the measured luminosity. Protostellar cores associated with a luminosity peak are called “luminous protostellar cores”, while others are called “low-luminosity protostellar cores”.
Tables C.1–C.2 and C.6–C.7 published at the CDS list, for each luminosity peak associated with protostars, their integrated luminosity, Lbol(r < θLbol), their FWHM angular size, θLbol, and their FWHM spatial size, FWHMLbol. Tables C.2 and C.7 published at the CDS also provides the coordinates, RA and Dec, of the luminosity peaks extracted in the present paper. The luminosity peaks associated with protostars have FWHM sizes ranging from one to two times the 2.5″ beam of PPMAP images. For these protostellar groups, which have a size of 6000–29000 au, the measured luminosity range from ~20 L⊙ to ~7.5 × 10⁴ L⊙ (see Tables C.1–C.2 and C.6–C.7 published at the CDS). They correspond to the brightest sources in the luminosity peak catalog of Dell’Ova et al. (2024) (see their Table B.1). These values are in agreement with the luminosity of high-mass protostars, with the lowest luminosities for their youngest phase, qualified as infrared (IR)-quiet (see definition in Motte et al. 2007; Csengeri et al. 2017), and the brightest for their evolved, HCH II phase (see definition by Hoare et al. 2007). For each luminosity peak, Tables C.1–C.2 and C.6–C.7 published at the CDS also indicate if a temperature peak is detected and list all the protostellar cores associated. It gives the protostellar core numbers in the published catalogs of Sect. 2.1, their FWHM angular size, θcore, and their distance to the luminosity peak center, dLbol, notably used to characterize the robustness of their association.
2.3 Highest-luminosity protostars in ALMA-IMF protoclusters
The brightest ALMA-IMF protostars heat cloud areas with diameters of 0.4–1 pc (see Appendix A and, e.g., Fig. A.1-lower row). Hence, their protostellar luminosity, which must be measured over a wide area around the protostar while excluding the luminosity of its surrounding cloud, is poorly defined by a simple metric such as luminosity peak, Lbol(r < θLbol) (see Sect. 2.2). The highest-luminosity protostars are also expected to be associated with bright, chemically rich hot cores if we consider that COMs are released into the gas by thermal desorption, after having formed onto grains (e.g., Garrod & Herbst 2006). In fact, Bonfand et al. (2024) have discovered six very extended, 4000–13 400 au, MF sources, and argue that they correspond to extreme hot cores heated, to over ~100 K, by 105−106 L⊙ protostars. In qualitative agreement with this interpretation, five of these six extreme hot cores are associated with the three brightest luminosity peaks of ALMA-IMF: W51-E-MF1 in W51-E#P2, W51-E-MF2 and MF3 in W51-E#P1, and W51-IRS2-MF1 and MF3 in W51-IRS2#P1. However, these peak luminosities, Lbol(r < θLbol) = LMF(peak) = 3–7.5 × 10⁴ L⊙, only allow us to estimate lower limits to the luminosities of their host protostars (see Tables C.3 and C.6–C.7 published at the CDS).
Therefore, integration over larger areas and decomposition of different emission components are required for the protostellar cores associated with the six extreme MF sources of Bonfand et al. (2024). We investigated the luminosity images around four positions, encompassing, due to the lower resolution of the luminosity maps, these extreme MF sources: two toward G327.29-MF1 and W51-E-MF1, one toward the middle location of W51-E-MF2 and -MF3, encompassing both, and the last toward the middle location encompassing W51-IRS2-MF1 and -MF3. Figure D.2 presents their pixel luminosity profile as a function of angular radius, L(θ), which is made up of the median luminosity of pixels contained within annular rings, taking their medians in order to attenuate the effect of nearby luminosity peaks on the profile. As expected, the spheres of influence of these highest-luminosity protostars display no clear outer radii.
Here, we model the pixel luminosity profiles by the sum of a power-law and a Gaussian, both centered at angular radius θ = 0. As shown below, we associate the power-law model, which dominates at radii smaller than 0.05–0.1 pc, with the cold emission component of protostellar envelopes, and the Gaussian with a typical FWHM of ~0.5 pc with the sum of the hot emission component of protostars and the cold emission of the cloud structures surrounding protostellar cores. This approach requires us to define two additional measures of luminosity, LMF(pow) and LMF(tot) (see definition below). Table C.3 lists the eight highest-luminosity ALMA-IMF protostars that require this special treatment, along with the three estimates of the luminosity discussed here.
The spherical power-law luminosity profile model is expected to correspond to the cold emission component of protostellar cores observed from far-infrared to submillimeter wavelengths. As a matter of fact, a protostellar envelope with infinite spherical symmetry, which has a density profile ρ(r) ∝ r−p, has a column density profile NH2 (r) ∝ r × ρ(r) ∝ r−p+1. In the Rayleigh-Jeans regime and with a radial temperature profile of T(r) ∝ r−q, the intensity profile of this protostellar envelope is Icold(r) ∝ NH2(r) × T(r) ∝ r−m with m = p + q − 1 (e.g., Motte & André 2001). It follows that the cold component of a protostellar core, with ρ(r) ∝ r−2 and Tdust(r) ∝ r−0.36 profiles (see Sect. 4.1), has a radial luminosity profile reasonably described by a power-law L(θ) ∝ θ−m with an index of m ≃ 2 + 0.36 − 1 = 1.36. With the exception of W51-E-MF1, the best-fit power-laws have indices ranging from 1.2 to 1.9 (see Fig. D.2), close to the theoretical value of m ≃ 1.36. We thus argue that the pixel luminosity, integrated below this power-law component, LMF(pow), represents a good estimate of the cold SED component of the underlying protostars.
In addition, the Gaussian component completing the fit of the profiles of pixel luminosity could correspond to the sum of the warm SED component of protostars and the cold SED component of their parental clumps, heated by nearby H II regions, internal shocks, and the interstellar radiation field (ISRF). The latter has no reason to be spherically symmetric. Similarly, the warm component of protostar SED is far more affected by geometric effects such as disk inclination and outflow cavities than its cold component (e.g., Furlan et al. 2016). Hence, this Gaussian component is complex in nature and its three-dimensional modeling remains less well constrained than the power-law component. Therefore, we provided in Table C.3 a third estimate of the luminosity of protostars or protostellar groups driving the brightest hot cores of Bonfand et al. (2024): that integrated under the total luminosity profile, LMF(tot). The two LMF(pow) and LMF(tot) estimates of the protostellar luminosities should contain most of the radiation escaping along the outflow cavities, since they are integrated up to the map edges, at ~0.6–1.2 pc from the protostars studied, whereas protostellar outflows are generally smaller in size (e.g., Nony et al. 2023).
For each of the four locations encompassing the six brightest hot cores of Bonfand et al. (2024), Table C.3 lists their name and coordinates along with the three estimates of the underlying luminosity discussed above. We measured hot core luminosities ranging from LMF(pow) = 9 × 10³ L⊙ to 2 × 10⁵ L⊙, increased by 3% to more than a factor of 6 with respect to their peak luminosities. The total luminosities of these extreme hot cores, LMF(tot), are 2.5–9 times higher, but should be considered as upper limit values because they include the luminosity of the hot core background. In the following, we use LMF(pow) to compute the contribution of each protostar and use it as the best estimate of protostellar luminosities.
3 Database of temperature images
The mean temperature of clouds is not identical either across our Galaxy or throughout the cloud’s evolution, but depends directly on the intensity of the cloud’s interactions with sources of irradiation, cosmic rays, and shocks. While it is obvious that the densest parts of clouds self-shield more easily from the external ISRF, filaments and cores nevertheless form in a medium whose temperature could be cold or warm depending on their parental cloud.
From the dust temperature images provided by Paper XII (Dell’Ova et al. 2024), we measure in Sect. 3.1 the background-diluted temperature of the ALMA-IMF cores, that is the dust temperature measured toward the core but diluted in the PPMAP beam, which is larger than the size of the core. We then investigate in Sect. 3.2 variations of the cloud temperature and identify temperature peaks.
3.1 Background-diluted dust temperature of cores
The ALMA-IMF database includes dust temperature images for all 15 protoclusters, at an angular resolution of 2.5″ (Dell’Ova et al. 2024). The PPMAP procedure (Marsh et al. 2015, 2017) was used to fit modified blackbody models to the fluxes measured in the 70 μm to 1.3 mm wavelength range, using a dust opacity law of κν ∝ νβ with β = 1.8 (Planck Collaboration XXIV 2011; Köhler et al. 2015). The resulting temperature images correspond to column density-weighted temperatures. Neglecting line-of-sight effects (e.g, Malinen et al. 2011), these maps provide a good approximation of the mass-averaged dust temperature for the densest cloud structures observed at 2.5″ in the ALMA-IMF fields.
Since ALMA-IMF protoclusters have been selected to be clusters in their embedded phase (Motte et al. 2022), the high column density of the protocluster cloud and dense structures (Díaz-González et al. 2023; Dell’Ova et al. 2024) partially extinguishes their 70 μm emission. As a result, the PPMAP fits, which use the 70 μm fluxes, underestimate the dust temperature globally, over the whole protocluster, and even more, locally, toward protostars. Dell’Ova et al. (2024) corrected the dust temperature images for the 70 μm opacity, using the column density image computed by PPMAP and a grid of temperature corrections. This grid, originally built for the pilot ALMA-IMF study (Motte et al. 2018b), estimates temperature corrections resulting from the radiative transfer model of a luminous source, a protostar or an UCH II region, located behind a cloud (using COREFIT, Marsh et al. 2014). This correction increases the global dust temperature of ALMA-IMF protoclusters by 1–3 K (see Table A.1). This correction also locally raises the dust temperature, from 20–30 K to 40–80 K, toward column density peaks hosting cores, revealing hot spots within cold filaments (Dell’Ova et al. 2024).
As stated in Dell’Ova et al. (2024) and shown in Appendix A, the best-suited image to estimate the background-diluted dust temperature of cores, that is the dust temperature measured at the location of ALMA-IMF cores but diluted in the 2.5″ PPMAP beam, is the dust temperature image corrected for the 70 μm opacity. However, at the location of cold cores such as prestellar cores and low-luminosity protostellar cores located in Evolved protoclusters, these opacity-corrected dust temperature images display local heating. The PPMAP assumption that part of the 70 μm emission, associated with the heating by H II regions, originates from a bright protostar embedded within prestellar cores or cold envelopes of low-luminosity protostars is indeed erroneous. Therefore, the temperature for prestellar cores and low-luminosity protostellar cores in Evolved protoclusters are overestimated. We propose that the least biased temperature estimate for the background-diluted temperature of these low-luminosity cores is the average between the temperatures measured in the original and in the opacity-corrected images (see Appendix A). This simple average takes into account both the underestimation of cloud heating of the original image and the overestimation of local heating of the opacity-corrected image. We then constructed combined dust temperature images, from the opacity-corrected and original temperature images of Dell’Ova et al. (2024). Their default, opacity-corrected, temperature images are modified at the location of prestellar cores and protostars not bright enough to be seen in the luminosity images. For these cores, whose nature is defined by companion papers (Nony et al. 2020, 2023, and in prep.; Armante et al. 2024; Bonfand et al. 2024, see Tables C.1–C.2 and C.6–C.7 published at the CDS), we used the average between the original and the opacity-corrected images, as measured at the central position of the cores and smoothed by Gaussians representing the resolution elements of the 1.3 mm images.
We measured the background-diluted temperature of cores in the combined dust temperature image of each ALMA-IMF protocluster. This temperature corresponds to the one weighted by the column density measured with a 2.5″ beam. Tables C.1–C.2 and C.6–C.7 published at the CDS list the PPMAP dust temperatures at core location, ![$\[\overline{T_{\text {dust}}^{\text {PPMAP}}}\left[1.25^{\prime \prime}\right]\]$](/articles/aa/full_html/2025/02/aa51931-24/aa51931-24-eq1.png) , which range from 17 to 73 K. The uncertainty on the background-diluted core temperature is the quadratic sum of the uncertainty associated with the PPMAP fitting procedure (σPPMAP ~ 16%) and that caused by the opacity correction. In practice, at core location the uncertainty covers the two extreme values provided by the original and opacity-corrected temperature maps.
, which range from 17 to 73 K. The uncertainty on the background-diluted core temperature is the quadratic sum of the uncertainty associated with the PPMAP fitting procedure (σPPMAP ~ 16%) and that caused by the opacity correction. In practice, at core location the uncertainty covers the two extreme values provided by the original and opacity-corrected temperature maps.
3.2 Variations of the dust temperature and hot spots
The ALMA-IMF protoclusters are located in the inner part of the Galactic plane and are often located in the immediate vicinity of massive star clusters (Motte et al. 2022, see their Fig. 1). They were also chosen to be active protoclusters forming high-mass stars, thus associated with clusters of outflows (Nony et al. 2020, 2023; Towner et al. 2024; Valeille-Manet et al. 2024) and H II regions (Díaz-González et al. 2023; Galván-Madrid et al. 2024). We therefore expect the cloud temperature of the ALMA-IMF protoclusters to vary from one protocluster to another and be higher in the Evolved protoclusters. As a matter of fact, Dell’Ova et al. (2024) measured spatially averaged, column-density weighted line-of-sight temperatures that range from 21 to 29 K, with higher temperatures for Evolved protoclusters.
We illustrate the difference in the ALMA-IMF background-diluted core temperature using our four case-study regions: G012.80, W43-MM1, W43-MM2, and W43-MM3. Figure 2 displays their combined dust temperatures images (see definition in Sect. 3.1), along with their Herschel 70 μm and ALMA-IMF H41α emission (Galván-Madrid et al. 2024). The cloud gas of the Evolved G012.80 protocluster is expected to be mainly heated by its three internal H II regions (Beilis et al. 2022; Armante et al. 2024) with temperatures up to 43 K, in line with the spatially averaged temperature weighted by the column density of ~28 K (Dell’Ova et al. 2024). Its 70 μm emission is indeed extended over ~1 pc and very well correlated with both the large-scale structure of the temperature map and the H II regions, outlined by their H41α emission (see Fig. 2a). In contrast, the cloud gas of the Young W43-MM1 and W43-MM2 protoclusters, which are mostly heated by the external ISRF, are colder than G012.80, ~26 K on average, with ~23 K at their center and temperature increases toward their periphery (see Figs. 2b–c). As for the Intermediate protocluster W43-MM3, it remains globally cold, at ~25 K (Dell’Ova et al. 2024), with some moderate heating, 32 K over an area of ~0.35 pc diameter, which is associated with its UCH II region (see Fig. 2d). The 70 μm emission from Young and Intermediate protoclusters is more compact than in Evolved protoclusters because it originates from protostellar groups and compact H II regions (see Figs. 2b–d).
We used the skimage/peak_local_max4 python function to identify dust temperature peaks, which are inflection points whose minimum size corresponds to the resolution element of the combined dust temperature images built in Sect. 3.1. Figures 2a–d locate the temperature peaks that we found in the G012.80, W43-MM1, W43-MM2, and W43-MM3 protoclusters. The large majority, 70%, of these hot gas pockets are low-density structures of PDRs, which are either associated with the H II regions of Evolved protoclusters or with the outer parts of the Young or Intermediate clouds heated by the ISRF of nearby stellar clusters. This is the case throughout Fig. 2a and particularly at the location of the G012.80 H II regions (see Armante et al. 2024). We observe similar PDR features at the periphery of the W43-MM1 and W43-MM2 protoclusters, which are heated by the OB/WR stellar cluster located 5 pc away (see Figs. 2b–c, Motte et al. 2003; Nguyen Luong et al. 2013).
In addition to these PDR features, we identified in the entire ALMA-IMF survey, 83 temperature peaks, which coincide with a luminosity peak and at least one, and up to four, protostellar cores (see Fig. 1). Coincidence occurs when the temperature peak lies within the getsf ellipse describing the FWHM of the luminosity peaks (see Dell’Ova et al. 2024, and Tables C.1–C.2 and C.6–C.7 published at the CDS). These peaks of both temperature and luminosity correspond to the heating imprints, ranging in size from 6000 to 29 000 au, of protostellar groups. In our case-study regions, these hot spots have line-of-sight dust temperatures ranging from 24 K to 42 K (see Tables C.1–C.2 and Fig. 2). In the Evolved G012.80 and Intermediate W43-MM3 protoclusters, three of these temperature and luminosity peaks are located at the periphery or within H II regions: in G012.80 at the periphery of “4” and within “2–3” (see the H II regions outline definition in Beilis et al. 2022; Armante et al. 2024, and Fig. 2a) and in W43-MM3 at the periphery of its UCH II region (see Nguyen Luong et al. 2017, and Fig. 2d).
In the following, Sects. 4–5 describe our methodology, based on the temperature distributions in protostellar envelopes and prestellar cores. We extrapolate below the constraints provided by PPMAP (see Sects. 2.2 and 3.1) toward even higher spatial resolution and estimate the mass-averaged temperature of the 882 ALMA-IMF cores.
4 Mass-averaged dust temperature and luminosity of protostellar cores
Using the well-documented temperature model of protostellar envelopes (see Sect. 4.1), we make two estimates for the mass-averaged temperature of single protostellar cores (see Sects. 4.2–4.3). As illustrated by Fig. 3, the first estimate uses the background-diluted core temperatures determined in Sect. 3.1 and corresponds to an outside-in extrapolation. In addition and for the protostellar cores that are bright enough to be detected in the PPMAP luminosity images, the second estimate is based on the luminosity peaks identified in Sect. 2.2, and is an insideout extrapolation. The G012.80, W43-MM1, W43-MM2, and W43-MM3 protoclusters are used as case studies (see Table C.4) and results for the entire protocluster sample of the ALMA-IMF Large Program are given in Table C.8 published at the CDS.
4.1 Analytical description of dust temperature within protostellar cores
When a protostellar envelope is centrally heated and is optically thin to far-infrared radiation, the temperature inside the envelope follows a power-law as a function of radius, with an index that depends on the dust emissivity index β (Terebey et al. 1993; Kauffmann et al. 2008; Peretto et al. 2020). When neglecting the background temperature, the absolute value of the temperature varies as a function of the luminosity of the protostar, Lproto⋆, once again with an index that depends on β:
![$\[T_{\text {dust}}(r, L_{\text {proto} \star})=T_{0} \times\left(\frac{r}{r_{0}}\right)^{-q} \times\left(\frac{L_{\text {proto} \star}}{L_{0}}\right)^{q / 2},\]$](/articles/aa/full_html/2025/02/aa51931-24/aa51931-24-eq2.png) (1)
(1)
with q = 2/(4 + β) and the normalization constants, T0 = 25 K, r0 = 6685 au, and L0 = 520 L⊙, taken from the model of Terebey et al. (1993). For a protostellar core described by a density profile of ρ(r) ∝ r−p and a temperature law following Eq. (1), the mass-averaged temperature within its outer radius Rout is
![$\[\begin{align*}\overline{T_{\text {dust}}(r, L_{\text {proto} \star})}[R_{\text {out}}] & =\frac{\int_{r=0}^{r=R_{\text {out}}} T_{\text {dust}}(r, L_{\text {proto} \star}) \times 4 \pi r^{2} \rho(r) \mathrm{d} r}{\int_{r=0}^{r=R_{\text {out}}} 4 \pi r^{2} \rho(r) \mathrm{d} r} \\& =\frac{3-p}{3-p-q} \times T_{\text {dust}}(R_{\text {out}}, L_{\text {proto} \star})\end{align*}\]$](/articles/aa/full_html/2025/02/aa51931-24/aa51931-24-eq3.png) (2)
(2)
In the case of both low- and high-mass protostellar envelopes, the best suited power-law indices for their density and dust opacity laws are p = 2 ± 0.3 (Motte & André 2001; Beuther et al. 2002; Gieser et al. 2021, in agreement with theoretical models by, e.g., Shu 1977; Gómez et al. 2021) and β = 1.5 ± 0.3 (André et al. 1993; Rathborne et al. 2010; Juvela et al. 2015; Palau et al. 2021), respectively. We note, however, that recent dust models and observations of low-mass protostellar disks suggest that flatter emissivity indices may be more appropriate in very dense cloud structures such as these disks, and potentially high-mass cores such as those characterized here (Ysard et al. 2019; Galametz et al. 2019). The emissivity index chosen above yields a power-law index for the temperature profile of q ≃ 0.36, which is close to the q ≈ 0.4 index recently measured (Gieser et al. 2021) and adopted in initial studies (e.g., Motte & André 2001; Beuther et al. 2002). We adapted the normalisation constants of Eq. (1) to the characteristics of protostellar cores in ALMA-IMF protoclusters. We assumed that the spatial distribution of cores intensity is described by a Gaussian function5 and took their median deconvolved FWHM sizes (~2100 au, Motte et al. 2022) as a proxy for their outer radius. As for the typical protostellar luminosity, our only constraint at this stage is the median luminosity of protostellar groups: ~1100 L⊙ (Dell’Ova et al. 2024). With these assumptions and typical outer radius and luminosity, Eqs. (1)–(2) become
![$\[T_{\text {dust}}(r, L_{\text {proto} \star}) \simeq 43.5 \mathrm{~K} \times\left(\frac{r}{2100 ~\mathrm{au}}\right)^{-0.36} \times\left(\frac{L_{\text {proto } \star}}{1100 ~L_{\odot}}\right)^{0.18}\]$](/articles/aa/full_html/2025/02/aa51931-24/aa51931-24-eq4.png) (3)
(3)
![$\[\overline{T_{{dust}}(L_{\text {proto} \star})}[R_{\text {out}}] \simeq 68 \mathrm{~K} \times\left(\frac{R_{\text {out}}}{2100 ~\mathrm{au}}\right)^{-0.36} \times\left(\frac{L_{\text {proto} \star}}{1100 ~L_{\odot}}\right)^{0.18}.\]$](/articles/aa/full_html/2025/02/aa51931-24/aa51931-24-eq6.png)
The relationship of Eq. (4) is found, with variations of ~20%, in grids of radiative transfer models describing protostars with a protostellar envelope and an outflow cavity (Robitaille 2017). It stands, but with greater dispersion, for protostellar envelope models with a disk.
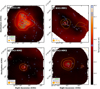 |
Fig. 2 Temperature maps used to estimate the background-diluted temperature of cores detected in a) G012.80, b) W43-MM1, c) W43-MM2, and d) W43-MM3. These images use the corrected PPMAP images along with the original PPMAP products (which ignore the 70 μm opacity correction), revealing both heating at the location of the most luminous protostars and self-shielding toward prestellar cores and low-luminosity protostars (see Sect. 3.1, Appendix A, Fig. A.1 and Dell’Ova et al. 2024). Green and orange contours outline the H41α emission (at 25σ levels) and the 70 μm emission (at 3σ and 7σ levels), respectively. A common color bar for temperature is placed on the right-hand side of the figure and blue horizontal lines indicate the maximum temperature of each panel. Temperature peaks are indicated by blue circles, protostellar cores by white ellipses. The resolution of the ALMA H41α emission, 0.38″−2.1″, the PPMAP dust temperature image, 2.5″, and the 70 μm emission, 5.6″, are given in the lower left corner. The background-diluted core temperature in the Evolved G012.80 protocluster is globally ~4 K hotter than in the three other, Young and Intermediate, protoclusters. |
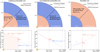 |
Fig. 3 Methodology used to estimate the mass-averaged dust temperature of ALMA-IMF cores: luminous protostellar cores (left panels), low-luminosity protostellar cores (central panels), and prestellar cores (right panels). Sketch (upper panels) and radial profile (lower panels) representing the mass-averaged dust temperature of a given core, as estimated by constraints obtained outside the core and, for the luminous protostars, within the core. The absolute values of the equations, the mean |
![$\[$\overline{T_{\text {dust }}}$\]$](/articles/aa/full_html/2025/02/aa51931-24/aa51931-24-eq5.png)
4.2 Outside-in estimate using PPMAP dust temperatures
A first estimate of the mass-averaged dust temperature of protostellar cores, ![$\[T_{\text {dust }}^{\text {protostellar core }}\]$](/articles/aa/full_html/2025/02/aa51931-24/aa51931-24-eq7.png) , can be obtained from the temperatures provided by PPMAP (see Fig. 3). We used Eq. (4), to extrapolate the PPMAP temperature averaged over a 1.25″ × d ∈ [2500; 7000] au radius to the core outer radius, taken to be equal to the deconvolved FWHM of the core6, Rout:
, can be obtained from the temperatures provided by PPMAP (see Fig. 3). We used Eq. (4), to extrapolate the PPMAP temperature averaged over a 1.25″ × d ∈ [2500; 7000] au radius to the core outer radius, taken to be equal to the deconvolved FWHM of the core6, Rout:
![$\[T_{\text {dust}}^{\text {protostellar core}} \approx \overline{T_{\text {dust}}(L_{\text {proto}\star})}\left[R_{\text {out}}\right]\]$](/articles/aa/full_html/2025/02/aa51931-24/aa51931-24-eq8.png)
![$\[\overline{T_{\text {dust}}(L_{\text {proto} \star})}[R_{\text {out}}]=\overline{T_{\text {dust }}^{\text {PPMAP}}}\left[1.25^{\prime \prime}\right] \times\left(\frac{R_{\text {out}}}{1.25^{\prime \prime} \times d}\right)^{-0.36},\]$](/articles/aa/full_html/2025/02/aa51931-24/aa51931-24-eq9.png)
where ![$\[\overline{T_{\text {dust}}^{\text {PPMAP}}}\left[1.25^{\prime \prime}\right]\]$](/articles/aa/full_html/2025/02/aa51931-24/aa51931-24-eq10.png) is the PPMAP dust temperature of cores diluted in their background, averaged over a radius of 1.25″ (see Sect. 3.1), and d is the distance of the ALMA-IMF protoclusters to the Sun, 5.5 kpc for the W43 regions, 2.4 kpc for G012.80, and 2.0–5.4 kpc for the others (see Table 1 of Motte et al. 2022). As explained in Sect. 3.1 and Appendix A, protostars bright enough to be detected in the luminosity images have their dust temperature,
is the PPMAP dust temperature of cores diluted in their background, averaged over a radius of 1.25″ (see Sect. 3.1), and d is the distance of the ALMA-IMF protoclusters to the Sun, 5.5 kpc for the W43 regions, 2.4 kpc for G012.80, and 2.0–5.4 kpc for the others (see Table 1 of Motte et al. 2022). As explained in Sect. 3.1 and Appendix A, protostars bright enough to be detected in the luminosity images have their dust temperature, ![$\[\overline{T_{\text {dust}}^{\text {PPMAP}}}\left[1.25^{\prime \prime}\right]\]$](/articles/aa/full_html/2025/02/aa51931-24/aa51931-24-eq11.png) , measured in the PPMAP image corrected for the opacity at 70 μm. For the other protostars,
, measured in the PPMAP image corrected for the opacity at 70 μm. For the other protostars, ![$\[\overline{T_{\text {dust}}^{\text {PPMAP}}}\left[1.25^{\prime \prime}\right]\]$](/articles/aa/full_html/2025/02/aa51931-24/aa51931-24-eq12.png) is taken to be the average of values measured in the opacity-corrected and original PPMAP images (see Sect. 3.1). We then used Eq. (5) to compute a first estimate of the mean dust temperature of the ALMA-IMF protostellar cores.
is taken to be the average of values measured in the opacity-corrected and original PPMAP images (see Sect. 3.1). We then used Eq. (5) to compute a first estimate of the mean dust temperature of the ALMA-IMF protostellar cores.
Tables C.4 and C.8 published at the CDS characterize the protostellar cores of the G012.80, W43-MM1, W43-MM2, and W43-MM3 protoclusters and of the remaining ALMA-IMF protoclusters, respectively. They list their outer radius and their mass-averaged dust temperature computed, as shown in Fig. 3, from Eq. (5). The dust temperature of protostellar cores is observed to vary from ~17 to ~127 K.
This extrapolation from the outside in, that is to say from ![$\[\frac{\text { HPBW}_{\text {PPMAP}}}{2}=1.25^{\prime \prime}~(2500{-}7000 ~\mathrm{au})\]$](/articles/aa/full_html/2025/02/aa51931-24/aa51931-24-eq13.png) to Rout = 0.35–0.95″ (1900 au), should be correct for most protostellar cores but, in several cases, it corresponds to an upper limit. First, Eq. (5) is correct as far as the protostellar core remains optically thin to farinfrared radiation at the Rout radius. In the very few cases when this condition is not fulfilled, the extrapolated dust temperature is an upper limit. Then, for evolved protostellar cores such as bright hot cores, which, due to the propagation of the inside-out collapse, could have a slightly flatter density profile, ρ(r) ∝ r−1.5 instead of ρ(r) ∝ r−2 according to theoretical studies (e.g., Shu 1977; Gong & Ostriker 2013) and some observations (Didelon et al. 2015; Jeff et al. 2024), Eq. (5) gives a dust temperature slightly, by 18%, overestimated. Moreover, when no protostellar heating is observed in the PPMAP image as a hot spot associated with a luminosity peak (see Tables C.1–C.2 and C.6–C.7 published at the CDS), the proposed equation also provides upper limit values. And finally when the background temperature is not negligible, the temperature profile would also be flatter and the protostellar core temperature at Rout would be overestimated as well. For a smaller dust emissivity index, for instance, β = 1 (Galametz et al. 2019), the dust temperature remains almost unchanged. In contrast, in the case of a core with a geometry far from being spherical and potentially subfragmenting in a few components, much larger variations are expected. For the purposes of the present statistical study, we will ignore this last case.
to Rout = 0.35–0.95″ (1900 au), should be correct for most protostellar cores but, in several cases, it corresponds to an upper limit. First, Eq. (5) is correct as far as the protostellar core remains optically thin to farinfrared radiation at the Rout radius. In the very few cases when this condition is not fulfilled, the extrapolated dust temperature is an upper limit. Then, for evolved protostellar cores such as bright hot cores, which, due to the propagation of the inside-out collapse, could have a slightly flatter density profile, ρ(r) ∝ r−1.5 instead of ρ(r) ∝ r−2 according to theoretical studies (e.g., Shu 1977; Gong & Ostriker 2013) and some observations (Didelon et al. 2015; Jeff et al. 2024), Eq. (5) gives a dust temperature slightly, by 18%, overestimated. Moreover, when no protostellar heating is observed in the PPMAP image as a hot spot associated with a luminosity peak (see Tables C.1–C.2 and C.6–C.7 published at the CDS), the proposed equation also provides upper limit values. And finally when the background temperature is not negligible, the temperature profile would also be flatter and the protostellar core temperature at Rout would be overestimated as well. For a smaller dust emissivity index, for instance, β = 1 (Galametz et al. 2019), the dust temperature remains almost unchanged. In contrast, in the case of a core with a geometry far from being spherical and potentially subfragmenting in a few components, much larger variations are expected. For the purposes of the present statistical study, we will ignore this last case.
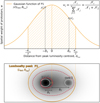 |
Fig. 4 Gaussian distribution, 𝒩(Lbol, RA, Dec, θLbol) (orange curve in the upper panel), which represents the luminosity peak P1 associated with two protostellar cores, and its intensity map (lower panel). The spatial contribution of the protostellar cores, w1 and w2, to luminosity peak P1 is assumed to be proportional to the value of the Gaussian function at the cores’ location, 𝒩1 and 𝒩2 at δ1 and δ2, respectively. The FWHM of the luminosity peak P1, θLbol, is outlined by the dashed area in the upper panel and the orange ellipse in the lower panel. Red contours separate the luminosity peak into the intensity contribution of its two host cores. |
4.3 Inside-out estimate using PPMAP peak luminosities
As shown in Eq. (4), a second estimate of the mass-averaged dust temperature of protostellar cores can be obtained using constraints on their protostellar luminosity (see scheme of Fig. 3). It is clear from Figs. 1 and D.1 (see also Sect. 3.2) that the luminosity peaks of Tables C.1–C.2 and C.6–C.7 published at the CDS correspond to the luminosity imprints of protostellar groups, containing one to four protostars. Determining the contribution of each protostar to the luminosity of protostellar groups requires knowledge of their relative intensity at wavelengths ranging from near-infrared to millimeter. While ALMA provides a good estimate of the relative intensities of protostellar cores in the (sub)millimeter regime, Herschel and Spitzer observatories lack the angular resolution to do so (Dell’Ova et al. 2024). We developed a method, which uses the spatial distribution of luminosity peaks to distribute the luminosity of these groups to each of the individual protostellar cores that they host (see Fig. 4).
Tables C.1–C.2 and C.6–C.7 published at the CDS show that about 30% of the luminosity peaks have contributions from multiple protostellar cores. This ratio is highly variable throughout the ALMA-IMF protoclusters. It primarily depends on the distance of the protoclusters to the Sun; more cores are expected in a 2.5″ area when they have typical sizes of 0.5″, as in W43-MM1, instead of 0.9″ sizes, as in G012.80 (compare Figs. 1a and 1b). This ratio also depends on the number density of cores within protoclusters as observed when comparing, for instance, W43-MM1 and W43-MM2. While the most clustered, W43-MM1, has 3/4 of its luminosity peaks associated with multiple protostellar cores, only 1/4 are multiple in the least clustered of the two, W43-MM2. Moreover, some of the luminosity peaks hosting two or three cores display an elongated shape along the axis that connects them (e.g., P3 in Fig. 1b, P1 of G010.62 I and P3 of G327.29 II in Fig. D.1), suggesting that these cores make a balanced and significant contribution to the luminosity peak. Therefore, the location of each core within their host luminosity peak could give a good estimate of their contribution to the luminosity. Making this assumption, we calculate below the luminosity of protostars listed in Tables C.4 and C.8 published at the CDS.
As illustrated in Fig. 4, the luminosity peaks from Sect. 2.2 have been fitted by getsf with Gaussian functions, 𝒩(RA, Dec, Lbol, θLbol), whose parameters are their center coordinates, their total luminosities, Lbol(r < θLbol), and their FWHM sizes, θLbol. For each protostellar core i contained in one luminosity peak, we then defined its contribution, 𝒩i, as the value of the luminosity peak’s Gaussian function at the location of the core, δi, corresponding to dLbol for core i. The contribution of protostellar core i among ncores to a given luminosity peak is then considered to be
![$\[w_{\text {spatial, } \mathrm{i}}=\frac{\mathcal{N}_{i}}{\sum_{j=1}^{n_{\text {cores}}} \mathcal{N}_{j}}.\]$](/articles/aa/full_html/2025/02/aa51931-24/aa51931-24-eq14.png) (6)
(6)
The Gaussian parameters of each luminosity peak and the contribution to their luminosity of the host protostellar cores are tabulated in Tables C.1–C.2 and C.6–C.7 published at the CDS.
Assuming the contribution computed in Eq. (6), the luminosity of protostar i is
![$\[L_{\text {proto} \star, ~\mathrm{i}}=w_{\text {spatial, } \mathrm{i}} \times\left[L_{\mathrm{bol}}\left(r<\theta_{L_{\mathrm{bol}}}\right)-L_{\mathrm{bck}}\right],\]$](/articles/aa/full_html/2025/02/aa51931-24/aa51931-24-eq15.png) (7)
(7)
where Lbck represents the background luminosity of the 0.5″−0.9″ cores within a given luminosity peak, typically 2.5″−5″ in size. Neglecting Lbck is probably acceptable for luminous protostars in Young protoclusters. It however should lead to overestimating the luminosity of low-luminosity protostars, especially when they are located in the luminous background of Evolved protoclusters (e.g., Evans et al. 2009; Kryukova et al. 2012) or close to the highest-luminosity protostars. As we have no information whatsoever on the value of this background (at scales between 2.5″ and the core size), we are forced to set it here to zero. Beyond this source of uncertainty, the main bias of this method is linked to the chance alignment of cores fortuitously located along the line of sight of a luminosity peak.
Finally, for each luminous protostellar core, thus associated with a luminosity peak, we plugged its protostellar luminosity computed from Eq. (7) into Eq. (4), which gives a second estimate of its mass-averaged dust temperature. Tables C.4 and C.8 published at the CDS list, for 151 (i.e., 55%) ALMA-IMF protostars, an estimate of their protostellar luminosity and associated mass-averaged dust temperature. This second estimate of the dust temperature provides values that range from ~30 to ~143 K and are generally 20 K higher than the outside-in measurements of Sect. 4.2.
For the eight cores associated with the brightest ALMA-IMF hot cores (Bonfand et al. 2024), three different temperatures are calculated from the three luminosity estimates presented in Sect. 2.3 (see Table C.3). For the eight highest-luminosity protostars located within these extreme hot cores, given their sizes 1200–3200 au, Eq. (4) gives a mass-averaged dust temperature of 80–140 K, with an upper value of 100–170 K (see Table C.3). We compare these different derived temperatures in Sects. 6.1 and 6.3.
5 Mass-averaged dust temperature of prestellar cores
There is as yet no well-established temperature model to characterize the self-shielding of starless structures in the interstellar medium. Therefore, we examine the temperature profiles of prestellar cores and starless clumps from the literature (see Sect. 5.1), and we determine, in Sect. 5.2, the expected temperature profile for the immediate surrounding of ALMA-IMF prestellar cores. The prestellar cores are indeed embedded in dense clumps, whose dust temperature measured toward the core are diluted in spheres of 5000–14 000 au radii (i.e., 2.5″ at the protocluster distance) as defined in Sect. 3.1. The mass-averaged dust temperature of prestellar cores is estimated by extrapolating their clump-diluted temperature, by a factor of 1 to 4 in radii, down to the outer radius of the prestellar cores, ranging from 700 to 9900 au (median at 2900 au). Temperature extrapolation for prestellar cores is illustrated in Fig. 3 and performed in Sect. 5.2.
5.1 Current knowledge of the temperature profiles of prestellar cores
The density profile of prestellar cores is often assimilated to that of a Bonnor-Ebert sphere (Bonnor 1956; Alves et al. 2001). However, the existence of an outer edge is still much debated (see, e.g., references in Sect. 5.2). On the other hand, it is well established that the outer part of their density profile is similar to that of protostars, that is close to ρ(r) ∝ r−2, and that their inner part, often reported at radii r < Rflat, shows a definite flattening (Ward-Thompson et al. 1999; Launhardt et al. 2013; Roy et al. 2014).
In absence of internal heating from protostars, the gas in prestellar cores of typical Galactic disk environments is heated by the local ISRF, cosmic rays, and shocks, with the ISRF dominating the heating of isolated prestellar cores (Evans et al. 2001). The dust temperature profile of prestellar cores, therefore controlled by their self-shielding against the ISRF, decreases with increasing density and thus decreasing radius toward their center. As already suggested before the Herschel era (e.g., Zucconi et al. 2001; Evans et al. 2001; Pagani et al. 2003; Crapsi et al. 2007), the temperature distribution of the Taurus prestellar cores and isolated Bok globules is made up of a central plateau of ρC density and cold, ~7–8 K, temperature and a trend of increasing temperature toward the outside (Launhardt et al. 2013; Marsh et al. 2014; Roy et al. 2014). Many efforts have been made in radiative transfer models to describe in detail the temperature profiles of a handful of iconic prestellar cores, notably B68 and L1544 (Crapsi et al. 2007; Nielbock et al. 2012; Juárez et al. 2017) or similarly isolated cores (Malinen et al. 2011; Marsh et al. 2014). Several parametrizations of temperature profiles have been proposed to interpret observations of samples of prestellar cores (Kauffmann et al. 2008; Launhardt et al. 2013; Marsh et al. 2014; Koumpia et al. 2020, see their Eq. (8), Eq. (8), Eq. (3), and Eq. (8), respectively). The parameters of these empirical temperature distributions are currently only constrained by observation, and could only be linked to a simple isothermal model such as Bonnor-Ebert spheres (Bonnor 1956). Radiative transfer models of observed and simulated cores, with more realistic density structure than that of Bonnor-Ebert spheres are therefore necessary to make major improvements.
Analytical solutions are therefore not straightforward and the outcome of Monte Carlo radiative transfer models strongly depends on the cooling functions and the structure assumed for the synthetic prestellar cores (e.g., Gonçalves et al. 2004). For instance, the inner temperature of prestellar cores crucially depends on its inner structure, such as its mean density and its density distribution, including its subfragmentation and deviation from spherical symmetry (Wilcock et al. 2012). In addition, the environment of prestellar cores, through its ISRF and dust properties, obviously has a major impact on their temperature at their outer radius, but also on their mass-averaged temperature, since most of a core’s mass is found in its outer parts (Gonçalves et al. 2004). Although the physical scales of the outer part of nearby prestellar cores are similar to those of the immediate surrounding of ALMA-IMF cores, that is ~1000–10 000 au, ALMA-IMF environments are probably more filamentary, denser, and subject to a higher ISRF.
Despite these many caveats, we give a first-order estimate of the self-shielding effect of prestellar cores. This is, most probably, better than just taking a single fixed temperature, the background-diluted temperature of cores, or even decreasing it by a few degrees like was done in the pilot and initial ALMA-IMF studies (Motte et al. 2018b; Pouteau et al. 2022; Armante et al. 2024).
5.2 Outside-in estimate for prestellar cores using PPMAP dust temperatures
The common and most robust part of the structure of prestellar cores remains the outer part of its density profile, which follows a ρ(r) ∝ r−2 power-law (see, however, Nielbock et al. 2012). A similar density power-law is observed for the outer part of cloud filaments, which displays a Plummer-like profile:
![$\[\rho_{\mathrm{p}}(r)=\frac{\rho_{\mathrm{C}}}{\left[1+\left(r / R_{\text {flat}}\right)^{2}\right]^{p / 2}}\]$](/articles/aa/full_html/2025/02/aa51931-24/aa51931-24-eq16.png) (8)
(8)
with p often set to 2 (Palmeirim et al. 2013; Stutz 2018; Arzoumanian et al. 2019, but also see Stutz & Gould 2016; Peretto et al. 2023). At large radii, that is for r ≫ Rflat and r between 10000 to 80000 au, this density profile is reminiscent of the ρ(r) ∝ r−2 structure observed for the outer parts of prestellar cores (e.g., Ward-Thompson et al. 1999; Launhardt et al. 2013), but at radii ten times greater than these. The temperature distribution of high-density filaments has also been observed and predicted to decrease as one approaches their crest (e.g., Hill et al. 2012; Anathpindika & Freundlich 2015). Besides, on similar spatial scales as the Plummer-like filaments above, Wilcock et al. (2011) modeled a handful of infrared-darks clouds (IRDCs), which are cold elongated clumps forming intermediate- to high-mass stars, and found a decreasing temperature profile with decreasing radius.
According to published radiative transfer models, those of Wilcock et al. (2012) are the most adequate to model the gas surrounding ALMA-IMF cores. They state that an exponential relationship with distance is a good description of the dust temperature profile produced by self-shielding effects. Given the small range of radii investigated here, from ~2900 au (the core size) to 5000–14 000 au (the 2.5″ PPMAP beam), this exponential law is, over this range, approximated by a simple power-law, Tdust(r) ∝ r−q. We measured the power-law indices q for the temperature profiles presented in the figures provided by many authors for the observed or modeled prestellar cores or IRDCs, focusing on the radius range where their density profile follows a power-law close or equal to ρ(r) ∝ r−2.
About twenty observed and/or modeled prestellar cores, which are low-mass and located nearby, display temperature profiles in their outer parts, before reaching their background temperature, of Tdust(r) ∝ r−q with −q = 0.1 − 0.32 with a median value of −q ≃ 0.2 (Gonçalves et al. 2004; Crapsi et al. 2007; Nielbock et al. 2012; Launhardt et al. 2013; Marsh et al. 2014; Juárez et al. 2017). IRDCs have been modeled assuming a non spherical shape and four times stronger ISRF than what is generally assumed for low-mass prestellar cores (Wilcock et al. 2011, 2012). Surprisingly, their median temperature profiles are very similar, with −q = 0.2, with Δq ≃ 0.05 variations when considering the distribution in the mid-plane of the elongated IRDC or perpendicular to it. Moreover, Jørgensen et al. (2006) made radiative transfer modeling and showed that the temperature profile of a prestellar core should quantitatively vary with its surrounding ISRF. Most ALMA-IMF protoclusters should be under the influence of a strong ISRF (Motte et al. 2022), stronger than that required to model the IRDCs of Wilcock et al. (2012). The lack of dedicated radiative transfer modeling for these extreme protoclusters nevertheless prevents us from predicting the effect of a strong ISRF on the index studied here. In the following, we therefore assumed the temperature distribution of the background of ALMA-IMF prestellar cores to be following a Tdust(r) ∝ r0.2 power-law in the range of radii considered for the extrapolation (see Fig. 3).
When the core FWHM is smaller than the PPMAP beam, we extrapolated the mean dust temperature of prestellar cores from the temperature measured in the combined PPMAP images, averaged over a radius of 1.25″, ![$\[\overline{T_{\text {dust }}^{\text {PPMAP}}}\left[1.25^{\prime \prime}\right]\]$](/articles/aa/full_html/2025/02/aa51931-24/aa51931-24-eq17.png) . Like protostellar cores, the core outer radius, Rout, is taken to be equal to the deconvolved FWHM of the core (see Sect. 4.2). We also assume that the core background follows the same density profile as the outer parts of prestellar cores, IRDCs or filaments: ρ(r) ∝ r−2. Given the temperature law defined above, the mass-averaged temperature within its outer radius Rout is
. Like protostellar cores, the core outer radius, Rout, is taken to be equal to the deconvolved FWHM of the core (see Sect. 4.2). We also assume that the core background follows the same density profile as the outer parts of prestellar cores, IRDCs or filaments: ρ(r) ∝ r−2. Given the temperature law defined above, the mass-averaged temperature within its outer radius Rout is
![$\[T_{\text {dust }}^{\text {prestellar core }} \approx \overline{T_{\text {dust}}(\text {prestellar core})}[R_{\text {out }}]\]$](/articles/aa/full_html/2025/02/aa51931-24/aa51931-24-eq18.png)
![$\[\overline{T_{\text {dust}}(\text {prestellar core})}[R_{\text {out}}]=\overline{T_{\text {dust }}^{\text {PPMAP }}}\left[1.25^{\prime \prime}\right] \times\left(\frac{R_{\text {out }}}{1.25^{\prime \prime} \times d}\right)^{0.2}.\]$](/articles/aa/full_html/2025/02/aa51931-24/aa51931-24-eq19.png)
We used Eq. (9) to estimate the mean dust temperature of the ALMA-IMF prestellar cores or directly measured it in the PPMAP images when the core FWHM is larger than the PPMAP beam. Table C.5 lists the prestellar cores7 of the ALMA-IMF protoclusters, along with their estimated mass-averaged dust temperatures, which vary from ~17 to ~31 K (5th and 95th percentiles). The highest temperatures are found in Evolved protoclusters, in particular in the PDR of H II regions and under the influence of luminous protostars, in agreement with measurements done in the Rosette molecular cloud (Motte et al. 2010; Bőgner et al. 2022) and in clustered environments (Sánchez-Monge et al. 2013). With an uncertainty of ±0.1 for the power law index of their dust temperature profile, the resulting mass-averaged temperature of prestellar cores could vary by ±1 K in the closest ALMA-IMF protoclusters, and by ±2 K in the furthest protoclusters.
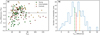 |
Fig. 5 Comparison of the two mass-averaged temperature estimates made for the 151 luminous protostellar cores of ALMA-IMF bright enough to be detected in the luminosity maps. (a) Fractional difference between estimates from the protostellar core luminosity (Col. 5 of Tables C.4 and C.8 published at the CDS) and the background-diluted temperature of cores (Col. 6 of Tables C.4 and C.8 published at the CDS). Protostellar cores in Young, Intermediate, and Evolved protoclusters are indicated by green circles, orange diamonds, and red stars, respectively. The black line shows that the median fractional difference between these two estimates is ~36%. (b) Distribution of the differences between the two temperature estimates of Cols. 5–6 in Tables C.4 and C.8 published at the CDS (blue histogram). Colored dashed lines locate the median of the differences: ~19 K in Young and Evolved protoclusters (green and red, respectively) and ~26 K in Intermediate protoclusters (orange). |
6 Discussion
In Sects. 4–5, we estimated the mass-averaged dust temperature, one of the two essential parameters necessary to determine the mass of the 266 protostellar cores (1–2 independent estimates per core) and 616 prestellar cores (1 estimate per core) found in the ALMA-IMF protoclusters. Sections 6.1–6.2 define the adopted dust temperature of all cores and compute their mass. Section 6.3 then compares these core temperatures with previously estimated values. Core masses and luminosities, two of the most fundamental characteristics of protostars, are finally used in a Mass-versus-Luminosity diagram that traces the evolution of protostars in protoclusters (see Sect. 6.4).
6.1 Adopted core temperatures
For each ALMA-IMF core, we generally provide a single estimate of the mass-averaged dust temperature, which is extrapolated from the images of the background-diluted core temperatures (see Sects. 3.1, 4.2, and 5.2, and see Fig. 3). In addition, for the 151 luminous protostellar cores that are bright enough to be detected in the PPMAP luminosity images, we provide a second temperature estimate, derived from their protostellar luminosity (see Sect. 4.3 and Fig. 3).
Figure 5 compares these two dust temperature estimates and shows that they are correlated. More precisely, their fractional difference is on average 36%, with a 1σ dispersion of about 15% (see Fig. 5a). Equivalently, the dust temperature estimated from the protostellar luminosity is on average ~19 K higher than the dust temperature estimated from the extrapolation of the background-diluted core temperature (see Fig. 5b). Given the assumptions necessary to make these temperature estimates (see Sects. 4.2–4.3), there is no reason to favor one estimate over the other. We therefore simply averaged them and list their mean value in Tables C.4 and C.8 published at the CDS, with an uncertainty that covers these two dust temperature estimates.
Here we investigate the origin of the difference found for the two dust temperature estimates obtained for the luminous protostellar cores of ALMA-IMF. Differences range from −2 K to +50 K, with a median around ~19 K and the fractional differences range from −7% to +76% with a median of +36% (see Fig. 5). First, we could reconcile these estimates with a temperature versus radius relation, which has a steeper power-law index, q > 0.36, than that assumed in Eq. (1). As a matter of fact, Jeff et al. (2024) measured somewhat steeper temperature indices, q ∈ [0.1; 1] ≃ 0.45 ± 0.3, for ten hot cores of the Galactic center that are partly optically thick. Men’shchikov (2016), which carried out radiative transfer modeling within protostellar envelopes, also revealed a similarly steeper temperature profile for their optically thick inner part: Tdust(r) ∝ r−0.88. This could thus apply for the eight cores associated with the brightest hot cores of the ALMA-IMF sample and a few other optically thick protostellar cores. For the other protostellar cores, a steeper temperature gradient would correspond to a higher index for the dust emissivity law. However, the opposite is now observed and predicted in hot, dense structures such as low-mass protostellar disks (Ysard et al. 2019; Galametz et al. 2019), somewhat reminiscent of the ALMA-IMF high-mass, small-scale (>10 M⊙, ~2400 au) protostellar cores. If the theoretical power-law index of Eq. (2) is not valid, the q ≈ 0.4 values observed on the line-of-sight are probably underestimated and correspond to indices closer to q = 0.5–0.6 (Estalella et al. 2024).
These differences may also arise from the assumptions used to compute these two separate estimates. On the one hand, the dust temperature extrapolated from outside, that is from the PPMAP dust temperature image, could be underestimated. One reason could be that the PPMAP mass-averaged temperature represents a line-of-sight temperature biased by the low temperature of the protocluster background and foreground. This marginally applies to Evolved protoclusters. The background-diluted temperature of luminous protostars could also be underestimated by the correction, itself underestimated, of the opacity of the emission at 70 μm as applied to the PPMAP results (Dell’Ova et al. 2024). On the other hand, the dust temperature extrapolated from inside, that is from the protostellar luminosity, could alternatively be overestimated. This happens when the inner part of the protostellar core becomes optically thick. Moreover, the fact that we neglect the background luminosity of the cores in 2.5″-beams in Eq. (7) explains why the fractional difference between these two temperature estimates is greater for protostellar cores in the Intermediate and Evolved protoclusters than for those in the Young protoclusters. Internal geometry and subfragmentation of cores could be another good reason for this disagreement. For example, the gas distribution is not correctly described by a single ρ(r) ∝ r−2 power-law when the inner part of the protostellar envelope free-falls, with a flatter density profile, or when subfragmentation distributes the gas over several sites, leading to a flatter mean density profile. For a ρ(r) ∝ r−1 law, Eq. (4) would give a temperature up to 22% lower: ~20 and ~10 K differences for Tdust = 100 K and Tdust = 50 K, respectively. The combination of high-resolution studies of both molecular lines and infrared emission will be necessary to improve current estimates of the mass-averaged temperature of cores.
Figure 6 displays dust temperature histograms for the three groups of cores, which we treated differently according to their prestellar or protostellar nature, and according to their protostellar luminosity (see Fig. 3). Their temperatures are complementary and have their 5th and 95th percentiles that range from 17 to 31 K, 26 to 51 K, and 38 to 92 K for prestellar cores, low-luminosity and luminous protostellar cores, respectively. Interestingly, prestellar cores located in luminosity peaks and therefore in the immediate vicinity of luminous protostars have a higher dust temperature than cores located further away from them: ~24 K versus ~22 K median values (see Fig. D.3 published on Zenodo).
Figure 7 shows, for each ALMA-IMF protocluster, the distribution of the mass-averaged temperature of its cores, whether prestellar or protostellar. The core temperatures have been computed above and in Sect. 5.2 and the luminosity-to-mass ratio, L/M, of the ALMA-IMF protoclusters is taken from Dell’Ova et al. (2024). As they stated, the L/M ratio of ALMA-IMF protoclusters correlates with the evolutionary stage determined in Motte et al. (2022) but also exhibits a noticeable variability within the groups of Young, Intermediate, and Evolved protoclusters. Assuming that the L/M ratio is a reasonable indicator for the evolutionary state of ALMA-IMF protoclusters, the vertical axis thus could roughly represent the evolutionary path of extreme protoclusters in our Milky Way. Figure 7 displays no obvious correlation between the L/M ratio of ALMA-IMF protoclusters and the median, minimum, and maximum values of its core temperatures. This is surprising, as we would expect core temperatures to increase in more evolved protoclusters, and therefore potentially with L/M (Molinari et al. 2016; Giannetti et al. 2017). If we instead use the ALMA-IMF classification that separates Young, Intermediate, and Evolved protoclusters, the median core temperature increases between these 3 groups: from ~22 K (with G327.29 as the obvious outlier) to ~26 K and finally ~29 K, with continuity between protoclusters in these three groups. We thus argue that the amount of dense gas impacted by H II regions, which is the criterion used by Motte et al. (2022), is a better evolutionary tracer of protoclusters than the L/M ratio that can only be reliably used for individual protostellar cores. G328.25 and G327.29 host, on average, the coldest and hottest cores of the ALMA-IMF protoclusters, consistent with the relative lack of MF emission in G328.25 (Bonfand et al. 2024) and the impact on G327.29 of an external H II region that was not previously taken into account in our classification (Motte et al. 2022; Galván-Madrid et al. 2024).
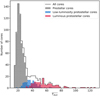 |
Fig. 6 Distribution of the mass-averaged dust temperature of prestellar cores (gray histogram), low-luminosity protostellar cores (blue histogram), and luminous protostellar cores (red histogram), as defined in Sect. 2.1. Despite the different assumptions we used to compute the dust temperatures of these three groups of cores (see Sects. 4–5 and Fig. 3), there is a clear continuity between their distributions, highlighted by the cumulated histogram of all cores (black outline). |
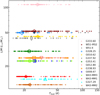 |
Fig. 7 Distribution of the mass-averaged temperature of ALMA-IMF cores (Col. 7 of Tables C.4 and C.8 published at the CDS) versus luminosity-to-mass (L/M) ratios of their protocluster (Dell’Ova et al. 2024). Neither the median temperature (large markers) measured for the cores of each protocluster nor their minimum or maximum values seem to correlate with the protocluster L/M ratio. |
6.2 Resulting core mass
Since the thermal dust emission of most ALMA-IMF cores is largely optically thin at 1.3 mm, we could have computed the mass of ALMA-IMF cores using the following equation:
![$\[M_{\tau \ll 1}=\frac{S_{1.3 \mathrm{~mm}}^{\mathrm{int}} ~d^{2}}{\kappa_{1.3 \mathrm{~mm}} ~B_{1.3 \mathrm{~mm}}\left(T_{\text {dust}}\right)},\]$](/articles/aa/full_html/2025/02/aa51931-24/aa51931-24-eq20.png) (10)
(10)
where the dust + gas mass opacity is set to κ1.3mm = 0.01 cm2 g−1, ![$\[S_{1.3 \mathrm{mm}}^{\mathrm{int}}\]$](/articles/aa/full_html/2025/02/aa51931-24/aa51931-24-eq21.png) is the integrated flux of cores (see core catalogs in Pouteau et al. 2022; Nony et al. 2023; Armante et al. 2024; Louvet et al. 2024), and B1.3mm(Tdust) is the Planck function at the core temperature listed in Col. 7 of Tables C.4 and C.8 published at the CDS.
is the integrated flux of cores (see core catalogs in Pouteau et al. 2022; Nony et al. 2023; Armante et al. 2024; Louvet et al. 2024), and B1.3mm(Tdust) is the Planck function at the core temperature listed in Col. 7 of Tables C.4 and C.8 published at the CDS.
However, several of the densest cores of ALMA-IMF are known to be partly optically thick (Motte et al. 2018b; Pouteau et al. 2022; Jeff et al. 2024). We therefore used the equation proposed by Pouteau et al. (2022) (see also Motte et al. 2018b) to compute the mass of all the 882 ALMA-IMF cores, assuming an optical thickness that at most is close to one:
![$\[M_{\tau \gtrsim 1}=-\frac{\Omega_{\text {beam}} ~d^2}{\kappa_{1.3 \mathrm{mm}}} \frac{S_{1.3 \mathrm{mm}}^{\mathrm{int}}}{S_{1.3 \mathrm{mm}}^{\text {peak}}} ~\ln~ \left(1-\frac{S_{1.3 \mathrm{mm}}^{\text {peak}}}{\Omega_{\text {beam}} ~B_{1.3 \mathrm{mm}}\left(T_{\text {dust}}\right)}\right),\]$](/articles/aa/full_html/2025/02/aa51931-24/aa51931-24-eq22.png) (11)
(11)
where Ωbeam is the solid angle of the 1.3 mm beam (see Table 2 of Motte et al. 2022) and ![$\[S_{1.3 \mathrm{mm}}^{\text {peak}}\]$](/articles/aa/full_html/2025/02/aa51931-24/aa51931-24-eq23.png) is the peak flux of cores. The core optical thickness, measured for their peak flux, is applied to their total flux. This leads to an overestimate of the mass of the few cores whose emission is optically thick, but this overestimate is small because the size of these cores is close to the beam.
is the peak flux of cores. The core optical thickness, measured for their peak flux, is applied to their total flux. This leads to an overestimate of the mass of the few cores whose emission is optically thick, but this overestimate is small because the size of these cores is close to the beam.
Integrated and peak fluxes of cores are corrected for line contamination over the entire ALMA-IMF sample (see Pouteau et al. 2022; Nony et al. 2023; Louvet et al. 2024). In contrast, the core continuum fluxes were not homogeneously corrected for contamination by free-free emission. As detailed in Sect. 2.1, the complete core sample of the four study-case regions, W43-MM1, W43-MM2, W43-MM3, and G012.80, and the hot core candidates found in the other ALMA-IMF protoclusters had their core fluxes corrected when necessary (Pouteau et al. 2022; Nony et al. 2023; Armante et al. 2024; Bonfand et al. 2024). The remaining protostellar cores potentially contaminated by free-free emission have fluxes that correspond to upper limits, and consequently so do their masses.
For the vast majority, ~96%, of the ALMA-IMF cores, their 1.3 mm emission remains optically thin and Eq. (11) gives the same mass value as Section 6.2. In contrast, for ~30 cores, Eq. (11) increases their mass by at least 10%. And in fact, four of these particular protostellar cores have a 50–90% increase in mass, compared with the masses estimated in the optically thin hypothesis. The resulting core masses range from ~0.1 M⊙ to ~260 M⊙ (see Tables C.4 and C.8 published at the CDS). As in companion papers (e.g., Pouteau et al. 2022; Armante et al. 2024), the uncertainty on the mass of cores takes into account errors on their fluxes and on the estimate of their mass-averaged dust temperature (see Sect. 6.1). The temperature uncertainties are dominated, for luminous protostellar cores, by the differences between our two temperature estimates, and for low-luminosity protostellar cores and prestellar cores, by uncertainties on their background-diluted temperature. This leads to relative uncertainties of 20%, up to ~40%, for the masses of the entire ALMA-IMF core sample. Uncertainties on the dust emissivity of dense cloud structures lead to even greater uncertainties in core mass estimates, a factor of at least 5 according to Köhler et al. (2015). Preliminary studies of core mass functions (CMFs) in the W43 protoclusters show that the results of Motte et al. (2018b), Pouteau et al. (2022), and Nony et al. (2023) hold with these new mass estimates. Forthcoming papers (Nony et al., in prep.; Louvet et al., in prep.) will be dedicated to this topic.
6.3 Comparison with other estimates of core temperatures
We here discuss the consistency of the mass-averaged dust temperature we propose for ALMA-IMF cores (see Sect. 6.1) with other temperature estimates. These estimates are taken from papers already published by our consortium: dust temperature of the first ALMA-IMF studies (see Sect. 6.3.1), COM line temperatures assumed for ALMA-IMF hot cores (see Sect. 6.3.2), and mass-averaged temperatures of prestellar cores in massive protoclusters (see Sect. 6.3.3).
6.3.1 Dust temperatures in previous ALMA-IMF papers
The pilot study and two first studies of the ALMA-IMF survey, (Motte et al. 2018b; Pouteau et al. 2022; Armante et al. 2024) estimated the mass-averaged dust temperature of protostellar and prestellar cores, following a methodology close to that presented in the present article. They indeed used PPMAP products, which have a lower angular resolution than ALMA images, and extrapolated at higher resolution the mass-averaged dust temperature for each core. The differences in methodology are shown below, along with their effect on core temperature and mass estimates.
For the Motte et al. (2018b) and Pouteau et al. (2022) studies, the first difference stems from the dust temperature images they used. They were less well corrected for the opacity of the 70 μm emission than the images produced by Dell’Ova et al. (2024), and used in Armante et al. (2024), for which the weighting of the far-infrared images compared with the millimeter images has been improved. As a result, the dust temperature measured in the improved images of Dell’Ova et al. (2024) with a 2.5″ beam are a few, up to 15, degrees higher toward the brightest protostars of the W43-MM1, W43-MM2, and W43-MM3 protoclusters.
The second difference in methodology is that these first three ALMA-IMF studies (Motte et al. 2018b; Pouteau et al. 2022; Armante et al. 2024) did not have PPMAP luminosity images to use. As the luminosity of these protoclusters was not constrained with the 2.5″ resolution of PPMAP, they used the luminosity integrated in areas ~15″ in diameter (Motte et al. 2003; Herpin et al. 2012). They correspond to the sum of the individual luminosity of a handful or dozen protostellar cores and of their background luminosity (see Figs. 1 and D.1). In the G012.80 protocluster, the luminosity of their H II regions dominates, precluding using integrated luminosites from the literature. Rather than using the relative flux at 1.3 mm of the protostars in W43-MM1 and W43-MM2&MM3 to determine their contribution to the luminosity of their protocluster, Motte et al. (2018b) and Pouteau et al. (2022) used their COM line emission, thus focusing on the most luminous protostars associated with a hot core. In detail, Motte et al. (2018b) assumed a proportional relationship between the contribution of protostars hosting hot cores to the protocluster luminosity, ![$\[L_{\text {proto} \star}^{\mathrm{COM}} / L_{\text {bol }}^{\text {protocluster}}\]$](/articles/aa/full_html/2025/02/aa51931-24/aa51931-24-eq24.png) , and the intensity ratio of COM line to continuum emission, γCOM, of the number of hot cores, nHC, of the protocluster:
, and the intensity ratio of COM line to continuum emission, γCOM, of the number of hot cores, nHC, of the protocluster:
![$\[\frac{L_{\text {proto} \star}^{\mathrm{COM}}}{L_{\text {bol }}^{\text {protocluster}}} \sim \frac{\left(\gamma_{\mathrm{COM}}\right)^{3.1}}{\sum_{j=1}^{n_{\mathrm{HC}}}(\gamma_{\mathrm{COM}, \mathrm{j}})^{3.1}}.\]$](/articles/aa/full_html/2025/02/aa51931-24/aa51931-24-eq25.png) (12)
(12)
This approximate relation and its power-law index of 3.1 are obtained by the demonstration, and its hypotheses are provided in Appendix B (in particular see Eq. (B.8)). Motte et al. (2018b) and Pouteau et al. (2022) applied Eq. (12) to the nine W43-MM1 and four W43-MM2 protostellar cores, identified by Brouillet et al. (2022) and Bonfand et al. (2024) to host a hot core. The resulting luminosities are ~5 times smaller than the protostellar luminosities estimated in Sect. 4.3, leading to a ~33% underestimate of the temperatures for the thirteen brightest protostellar cores of W43-MM1 and W43-MM2.
The biggest discrepancies with the dust temperatures estimated by Motte et al. (2018b), and similarly by Louvet et al. (2024), concern protostellar cores not associated with a hot core and prestellar cores. Their temperatures were measured in the images of the background-diluted core temperature, ~23 K, leading to an underestimate by ~70% for protostellar cores and an overestimate by ~20% for prestellar cores. As a result, the masses of protostellar cores were overestimated by ~40% and those of prestellar cores were underestimated by ~40%. Pouteau et al. (2022) and Armante et al. (2024) went beyond the background-diluted temperature of cores provided by PPMAP (Dell’Ova et al. 2024). To account for protostellar heating, they increased by 4 ± 4 K the mass-averaged temperature of protostellar cores driving outflows but no hot core. In addition, they decreased by 2 ± 2 K the mass-averaged temperature of prestellar cores in order to account for their self-shielding. When compared to the present study, the masses resulting from these temperature estimates for these protostellar cores remain overestimated, but only by ~30%, and those of the prestellar cores are similar in Pouteau et al. (2022) and Armante et al. (2024).
To conclude, on average, the dust temperature of Motte et al. (2018b) is consistent with those of the present study to within 40% and those of Pouteau et al. (2022) and Armante et al. (2024) to within 30%.
6.3.2 COM temperatures of the ALMA-IMF survey
Studies of ALMA-IMF molecular lines provide complementary estimates to the dust temperatures estimated by PPMAP SED fits (see Sect. 2.2). These also have a higher angular resolution than the dust based estimates. If the line emission is spatially resolved and assuming that the molecular abundance profile is known, the measured excitation temperatures of a given molecule can approximately represent the core temperature. Implicit in this are the assumptions that dust and gas must be well coupled over the full extent of the core, and that dust and gas emissions are both optically thin. Good coupling is expected for molecules excited in dense envelopes by the internal heating of protostars. As for the dust and line emissions, they should be optically thin in moderate-luminosity protostellar cores associated with hot cores.
Bonfand et al. (2024) used the CH3OCHO molecule and specifically its doublet line at 216.1 GHz, to study images of its integrated emission on the 15 massive protoclusters of ALMA-IMF. They discovered 76 sources and found that 74% of these hot core candidates are slightly more extended than their host core detected in continuum: mean FWHM of ~2300 au versus ~1900 au. They interpreted this as evidence for a filling factor close to one. Besides, detailed studies of eight hot cores in the W43-MM1 protocluster have revealed excitation temperatures of 120–160 K for the CH3CN line emission (Brouillet et al. 2022). Therefore and because these temperatures are also close to the thermal desorption temperature of CH3OCHO, Bonfand et al. (2024) set a dust temperature of Tdust = 100 ± 50 K for the ALMA-IMF protostellar cores associated with candidate hot cores. For eight protostellar cores of their sample, however, Bonfand et al. (2024) increased the temperature up to Tdust = 300 ± 100 K, based on previous measurements (Gibb et al. 2000; Ginsburg et al. 2017). In particular, Ginsburg et al. (2017) imaged three extended hot cores of the W51-E and W51-IRS2 protoclusters and found Trot > 200 K out to radii of ~104 au, using LTE modeling of CH3OH. These eight protostellar cores are notably associated with very extended, 4000–13 400 au, CH3OCHO emission (Bonfand et al. 2024, see also Table C.3).
Among the hot core candidates discovered by Bonfand et al. (2024), 51 are associated with a core in the 1.3 mm ALMA images of the 14 ALMA-IMF protoclusters studied here. Virtually all of these hot core candidates are associated with a luminosity peak in the PPMAP images (see Tables C.4 and C.8 published at the CDS). The core temperatures proposed by Bonfand et al. (2024) and measured by Gibb et al. (2000), Ginsburg et al. (2017), and Brouillet et al. (2022) are on average 1.7 times higher than the dust-based estimates of Sect. 6.1: 100 ± 50 K versus 35–100 K and 300 ± 100 K versus 70–130 K (see Tables C.3–C.4 and C.8 published at the CDS.
If the relation between the mass-averaged temperature and protostellar luminosity given in Eq. (4) is correct, reaching mass-averaged dust temperatures within cores of 2100 au typical sizes of 100 K and 300 K requires protostars with a luminosity of 9.3 × 10³ L⊙ and 4 × 10⁶ L⊙, respectively. In W43-MM1, Bonfand et al. (2024) found 14 hot core candidates associated with protostellar cores and propose that their mass-averaged temperature is 100 ± 50 K. The sum of their luminosities, predicted to be 14 × 9.3 × 103 L⊙ ≃ 1.3 × 10⁵ L⊙, is 1.6 times larger than the luminosity of the W43-MM1 central dense clump (König et al. 2017; Dell’Ova et al. 2024). Assuming 50 K, which is the lower limit temperature proposed by Bonfand et al. (2024), instead of 100 K would make these luminosity estimates more consistent, although this would require non-thermal desorption processes to bring CH3OCHO to the gas phase. As for the three ALMA-IMF protoclusters that Bonfand et al. (2024) propose to contain one to three cores of 300 ± 100 K, the sum of their predicted protostellar luminosity amounts to 4.1–12.5 × 10⁶ L⊙, values 10–80 times greater than the luminosity of their central dense clump (Dell’Ova et al. 2024). These inconsistencies probably suggest that Eq. (4) is not valid for the most massive ALMA-IMF cores, which are expected to subfragment and be partly optically thick to infrared radiation.
Alternatively, these inconsistencies could question the interpretation that the extended CH3OCHO emission is evidence of intense protostellar irradiation alone. In agreement with this questioning, Brouillet et al. (2022) found that the hot cores of W43-MM1 are not resolved when they are traced by the integrated emission of all COM lines detected in the 2 GHz-wide spectral band at 233 GHz. As already stated in Bonfand et al. (2024), the sum of several COM emission peaks associated with protostellar multiples and/or shocks created by protostellar outflows or accretion (Lefloch et al. 2017; Palau et al. 2017; Csengeri et al. 2019; Busch et al. 2024) would mimic an extended emission.
Moreover, we could question the thermal coupling between dust and gas, as was done by studies of massive clumps in their earliest phase of evolution (Merello et al. 2019; Urquhart et al. 2019; Mininni et al. 2021). Our results, however, correspond to scales ten to 100 times smaller and therefore to much denser cloud structures where thermal coupling will be considerably better than in massive clumps. Finally, the spatial coupling between dust emission and COM lines could be much weaker than expected, given a protostellar source geometry that is much more complex than a spherical envelope with a regular concentration of density toward the center. Follow-up studies, in particular on the core subfragmentation and the origin of CH3OCHO emission, are necessary to reconcile SED-based and COM-based methods, or explain why they give different results, to estimate the protostellar luminosity and mass-averaged temperature of protostellar cores.
6.3.3 Prestellar core temperatures
In the solar neighborhood, cores of the quiet Taurus cloud and isolated globules have cold, 10–12 K, temperatures (Launhardt et al. 2013; Marsh et al. 2014). Cores located in low- to intermediate-mass protoclusters have slightly warmer, 12–15 K, temperatures (e.g. Könyves et al. 2015; Ladjelate et al. 2020; Nony et al. 2021). In agreement with this slight temperature increase, low- to intermediate-mass protoclusters are expected to have a stronger (external and internal) ISRF than Taurus (Jørgensen et al. 2006). High-mass, nearby star-forming complexes, under the influence of massive star clusters and H II regions, exhibit filaments and clumps of higher column density. Despite that, these Herschel/HOBYS complexes have higher, 15–20 K, temperatures when measured with SEDs (Motte et al. 2010; Hill et al. 2012; Tigé et al. 2017) and ammonia (Wienen et al. 2012; Bőgner et al. 2022). A handful of starless clumps are also observed to have temperatures of up to ~40 K (Motte et al. 2010; Tigé et al. 2017; Bőgner et al. 2022). Since the ALMA-IMF protoclusters are subject to a stronger ISRF, we expect their core environment to be hotter than in Herschel/HOBYS clouds. Dell’Ova et al. (2024) measured spatially averaged temperature of ~21 to ~29 K for the ALMA-IMF protoclusters, with similar variations in most protoclusters from their cold and dense filaments at 19–23 K to areas heated up to ~45 K by H II regions and luminous protostars (see, e.g., Figs. 2 and A.1). We computed, for ALMA-IMF prestellar cores, mass-averaged temperatures of 15–40 K, with a median value at 23 K and 5th and 95th percentiles at 17 and 31 K.
The companion paper Valeille-Manet et al. (2024) used temperatures ranging from 20 to 27 K for the most massive ALMA-IMF cores, which do not drive powerful outflows and which they call PreSCs. These assumed temperatures are in good agreement, to within 30%, with the measurements of the present paper (see Table C.5 and their Table 3), with the exception of seven of their 42 PreSCs. These PreSCs are either qualified here as protostellar cores (Nony et al. in prep., see Tables C.4 and C.8 published at the CDS) or they are located at the immediate proximity of, and thus are heated by, a luminous protostar (see, e.g., Figs. A.1c and D.1 G333.60 I). Three of these sources are quoted as tentative protostellar cores (Nony et al. in prep.); if we would have assumed them to be prestellar in nature their temperature would agree with the assumptions of Valeille-Manet et al. (2024). Therefore, for more than 80% of the PreSCs of Valeille-Manet et al. (2024), the masses computed using the temperatures of the present study agree, to within 30%, with their mass estimates (see Tables C.4–C.5 and C.8 published at the CDS).
6.4 Protostellar evolution in massive protoclusters
Robust measurements of the basic properties of protostellar cores, such as luminosity and mass, are crucial to build the protostellar evolutionary diagrams necessary to constrain the accretion history of protostars. In particular, this was poorly achieved for protostars forming in massive protoclusters (see, however, the first attempt of Duarte-Cabral et al. 2013). One of the most widely used evolutionary diagrams is that of the mass of protostellar cores as a function of the luminosity of their inner illuminating protostar, the so-called Mcore − Lproto⋆ diagram (e.g., André et al. 2000; Molinari et al. 2008; Duarte-Cabral et al. 2013; Peretto et al. 2020). While Mcore provides a measure of the mass reservoir, the protostar luminosity, Lproto⋆, represents, at early stages, the accretion luminosity and, at later stages, the stellar luminosity related to the mass of the central protostar.
Figure 8 presents the Mcore − Lproto⋆ diagram for the 151 luminous protostellar cores, found by the ALMA-IMF survey to be bright enough to have their protostellar luminosities characterized (see Sects. 4.3 and 6.2). Their masses and luminosities are taken from Tables C.4 and C.8 published at the CDS. The present sample represents intermediate- to high-mass protostars forming in massive protocluster environments. Despite the apparent bias toward luminous sources, many of these protostellar cores are the equivalent of Class 0s (young low-mass protostars), with a core mass much larger than the protostar mass (Motte et al. 2018b; Pouteau et al. 2022). We expect the sample to be complete for protostars of 100 L⊙ and 300 L⊙ luminosities for the Young and Evolved protoclusters, respectively (Dell’Ova et al. 2024).
We first use the Mcore − Lproto⋆ diagram to compare the location of ALMA-IMF protostellar cores with that of other samples of the young stellar objects. We present the result of surveys for protostellar cores in nearby clouds (Bontemps et al. 1996, 2010a; Motte & André 2001) and two studies dedicated to a handful of high-mass IR-quiet protostellar cores in the Cygnus X star-forming complex (Duarte-Cabral et al. 2013) and a dozen of massive clumps hosting UCH II regions (van der Tak et al. 2000). The size of protostellar cores is 6000–10 000 au in nearby protoclusters, set to 4000 au for the protostellar cores of Cygnus X, while UCH II clumps have much larger sizes, 40 000–140 000 au. Therefore, all of these young stellar objects are cloud structures of a larger size and thus potentially of greater mass than the ALMA-IMF luminous protostellar cores, which are ~1900 au in size.
As shown in Fig. 8, ALMA-IMF protostellar cores appear clustered in between the location of the young high-mass protostellar cores of Duarte-Cabral et al. (2013) and the clumps harboring UCH II region of van der Tak et al. (2000). There is a small location gradient between Young, Intermediate, and Evolved protoclusters, with the protostellar population of Evolved protoclusters twice as dispersed as that of Young protoclusters. This result suggests that Evolved protoclusters have formed (high-mass) stars for longer time than Young protoclusters, in line with their more evolved stage. With the exception of seven sources, ALMA-IMF protostellar cores are located in a distinct part of the diagram from UCH II regions, separated by the T = 22 000 K line (see Fig. 8). As for the Cygnus X protostellar cores, they look younger, that is more massive for a given luminosity, than most of the ALMA-IMF protostellar cores. A higher mass by a factor ~2 is expected, as the mass of Cygnus X protostellar cores were extrapolated by Bontemps et al. (2010b) to a radius of 4000 au, twice the measured size of ALMA-IMF protostellar cores. Dividing the core mass of Cygnus X protostars by this factor of two, would provide a better match in the Mcore − Lproto⋆ diagram between the locations of high-mass protostellar cores in Cygnus X and in ALMA-IMF (see Fig. 8). Besides, there is a substantial overlap between the samples of low- to intermediate-mass protostars in nearby star-forming regions and in the ALMA-IMF protoclusters (see Fig. 8). It will allow us soon to study the potential variation in accretion history for protostellar cores of the same mass but forming stars in different environments.
We then use the Mcore − Lproto⋆ diagram to compare the location of observed protostars with predictions of protostellar accretion models. Duarte-Cabral et al. (2013) proposed several parametrized models, adapted from Bontemps et al. (1996) and André et al. (2000), with constant and decreasing accretion rates, and with continuous or intermittent accretion. They computed the associated probability density distribution of their protostellar cores and the evolutionary tracks predicted for protostars of a given core mass. We reported in Fig. 8 one model by Duarte-Cabral et al. (2013), based on decreasing accretion rates and intermittent accretion. The accretion of high-mass protostars is taken to be strong but sporadic, as expected when gas reaches protostellar cores through mass inflows (Smith et al. 2009; Galván-Madrid et al. 2009; Csengeri et al. 2011; Olguin et al. 2023). The location of low-mass protostellar cores of nearby clouds (Bontemps et al. 1996, 2010a; Motte & André 2001) agrees with the protostellar number density predicted by this model. In contrast, and even when taking into account an uncertainty factor of two on the absolute value of protostellar core masses, the ALMA-IMF population of intermediate- to high-mass protostellar cores is, on average, either too luminous or not massive enough compared with predictions of Duarte-Cabral et al. (2013). To fit their location in Fig. 8, the horizontal part of the evolutionary tracks tracing the main accretion phase of high-mass protostars should extend into the high-luminosity regime, with mid-lifetime (track arrows in Fig. 8) shifted toward luminosities five times higher. This implies that the mass reservoir of the high-luminosity ALMA-IMF cores would not decrease during the main accretion phase as much as assumed by the model. This mass reservoir could in fact be continuously replenished, or even increased, by external gas inflows, as ALMA-IMF studies have already suggested (including companion papers, Papers V and XIII, Nony et al. 2023; Álvarez-Gutiérrez et al. 2024; Sandoval-Garrido et al. 2024). A better model of protostellar evolution could therefore have a constant or even increasing accretion rate, as well as a core formation efficiency (CFE) greater than 100% of the initial core mass reservoirs. CFE values increasing with core density have already been reported in massive protoclusters (e.g., Louvet et al. 2014) and used for recent protostellar evolutionary models (Peretto et al. 2020).
The Mcore − Lproto⋆ diagram of Fig. 8 will be the subject of follow-up studies. The parameters of the accretion models must be adjusted to better describe, in ALMA-IMF environments, the variation of the accretion rate with time. Ultimately, this will help constrain star formation models suited to the star formation bursts that develop in massive protoclusters.
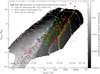 |
Fig. 8 Mass versus luminosity diagram of the 151 protostellar cores discovered, with detectable luminosity, in the ALMA-IMF massive protoclusters (color-filled squares, green, orange, and red for Young, Intermediate, and Evolved protoclusters) compared to reference studies of low-mass protostars (pink circles), IR-quiet high-mass protostars (cyan circles), and clumps hosting UCH II regions (red circles). The surface density of observed protostellar cores is to be compared to that predicted by a parameterized model (gray scale image), here with decreasing accretion rates and intermittent accretion (Duarte-Cabral et al. 2013). The final stellar mass of a protostar is predicted by the evolutionary tracks, for 0.08–50 M⊙ core masses, associated to this model (white curves). The yellow curve theoretically separates high-mass protostars from sources developing an H II region. Current scenario, assuming an accretion from a gas reservoir decreasing with time, does not fit the protostellar number density observed for ALMA-IMF protoclusters: protostellar cores more massive than 2 M⊙ are clustered in areas where the normalized surface density is predicted to be very low (~3 × 10⁻⁵), while only a few of these protostellar cores are found in areas where the surface density is 30 times higher. |
7 Conclusion
This study was carried out in the context of the ALMA-IMF Large Program (Motte et al. 2022). We have made extensive use of some of the ALMA-IMF data products, and we detail them in the following list:
The currently published ALMA-IMF core catalogs are unprecedented for their core detection sensitivity and completeness while excluding spurious sources (Pouteau et al. 2022; Nony et al. 2023; Armante et al. 2024; Louvet et al. 2024). They provide high-quality measurements of the thermal dust emission flux for the vast majority of our ~2300 au cores. A systematic search for outflows driven by ALMA-IMF cores allowed us to classify 266 protostellar cores and 616 prestellar core candidates (Nony et al. in prep., see also Sect. 2.1).
Recent SED analysis of ALMA-IMF protoclusters using the Bayesian technique PPMAP has provided a rich database of dust temperature and luminosity images at the unrivalled resolution of 2.5″ (Dell’Ova et al. 2024). Although this resolution comes close to that of ALMA-IMF images, 0.3–0.9″, it still falls short (see Figs. 1 and D.1). PPMAP thus provides the most likely values for the background-diluted core temperature as well as the luminosity of protostellar groups (see Sects. 2.2 and 3).
We have proposed a methodology for estimating the mass-averaged temperature of cores detected by ALMA-IMF as well as the luminosity of individual high-mass protostars. Our main results regarding this methodology can be summarised as follows:
We used the luminosity peak catalog of Dell’Ova et al. (2024) for the Young and Intermediate ALMA-IMF protoclusters. We augmented this work with a getsf extraction of luminosity peaks, which are not associated with free-free emission, in the Evolved protoclusters of ALMA-IMF (see Sect. 2.2). In total, 111 out of the 255 luminosity peaks host protostellar cores; they are listed and characterized in Tables C.1–C.2 and C.6–C.7 published at the CDS. We also integrated, in larger radii, the luminosity of the strongest luminosity peaks, encompassing the six brightest hot cores identified in ALMA-IMF by Bonfand et al. (2024) (see Sect. 2.3 and Fig. D.2). Cores that drive outflows and are associated with luminosity peaks are dubbed “luminous protostellar cores”, and those that are not strong enough to be detected in the PPMAP luminosity images are referred to as “low-luminosity protostellar cores” (see Fig. 3).
The default dust temperature image of Dell’Ova et al. (2024) is produced with the 70 μm emission corrected for the optical depth toward the protocluster and its protostellar cores. This process gives the temperature of the ALMA-IMF protoclusters as a whole and the most likely background-diluted temperature of their luminous protostellar cores (see Sect. 3 and Appendix A). The background-diluted temperature of low-luminosity protostars, prestellar cores, and starless filaments is best estimated by averaging the two dust temperature images provided by Dell’Ova et al. (2024): the original image and the one corrected for the optical depth at 70 μm (see Sect. 3).
For luminous protostellar cores, we estimated their luminosity, using their distance to their host luminosity peak to determine their contribution to this luminosity (see Sect. 4.3 and Fig. 4). Lists of the luminosity of the luminous protostellar cores are provided in Tables C.4 and C.8 published at the CDS, and they range from 50 L⊙ to 1.5 × 10⁴ L⊙ (5th and 95th percentiles, up to 8 × 10⁴ L⊙).
For these luminous protostellar cores, the mass-averaged temperature was estimated using parametric relations derived from the radiative transfer modeling of protostellar envelopes and two approaches (see Sect. 4 and Fig. 3). The first approach extrapolates the background-diluted temperature of cores down to the size of cores (see Sect. 4.2 and Eq. (5)), while the second approach uses the protostellar luminosity (see Sects. 4.3 and Eq. (4)). The two methods give consistent results (see Sect. 6.1 and Fig. 5). Their average gives, for the 151 luminous protostellar cores, temperatures that range from 38 to 92 K (5th and 95th percentiles) and go up to 127 K, with a median value of 54 K (see Tables C.4 and C.8 published at the CDS).
For low-luminosity protostellar cores, the mass-averaged temperature was estimated using a single approach, namely, the first approach described above for luminous protostars (see Sect. 4.2, Fig. 3 and Eq. (5)). The resulting mass-averaged temperatures of the 115 low-luminosity protostellar cores are listed in Tables C.4 and C.8 published at the CDS, and they range from 26 to 51 K (5th and 95th percentiles), with a median value of 37 K.
For prestellar cores, we estimated the mass-averaged temperature, applying a parametric cooling relation from their background-diluted temperature (see Sect. 5.2 and Fig. 3). The power-law index of this self-shielding has been systematically measured in published studies of observations or radiative transfer models dedicated to cloud structures following a ρ(r) ∝ r−2 law (see Sect. 5.1 and Eq. (9)). The resulting mass-averaged temperatures of the 616 ALMA-IMF prestellar cores are listed in Table C.5 and range from 17 to 31 K (5th and 95th percentiles), with a median value of 22 K.
We applied our methodology to the entire sample of 882 ALMA-IMF cores detected at the original angular resolution. The core masses were computed using our final temperature estimates in Eq. (11) (see Sects. 6.1–6.2), and they are listed in Tables C.4–C.5 and C.8 published at the CDS. These results are consistent with initial ALMA-IMF studies (see Sects. 6.3.1 and 6.3.3). However, it is worth noting that the dust-based temperature of luminous protostellar cores associated with hot cores is half that of the COM line-based temperatures (see Sect. 6.3.2).
The 151 luminous protostellar cores constitute the largest sample obtained to date, which provides both mass and luminosity, in the high-mass regime and at the core scale. We placed these protostellar cores in a Mcore/Lproto⋆ evolutionary diagram (see Fig. 8). A comparison with protostellar evolutionary tracks and the protostellar core number density of an accretion scenario using the initial core as the mass reservoir suggests that core mass growth during protostellar evolution would be more appropriate (see Sect. 6.4).
The present ALMA-IMF catalog of 882 cores with robust characteristics, such as their size, temperature, mass, and luminosity (for 151 of them), represents a gold mine of data. It will be used in future papers studying core populations, including their CMF, CFE, and Mcore/Lproto⋆ diagram, with the aim of constraining cloud and star formation models in extreme Galactic protoclusters, such as those imaged by the ALMA-IMF Large Program. Our result calls for follow-up studies to resolve the contradiction between the mass-averaged temperature we compute and their COM line-based temperatures. Among others, this will require higher angular resolution observations in the (sub)millimeter regime, surveys dedicated to chemical studies, and JWST observations of ALMA-IMF protostars. Moreover, radiative transfer modeling is needed to improve the analytical description of the self-shielding of intermediate- to high-mass prestellar cores in environments resembling the ALMA-IMF protoclusters.
Data availability
The full Tables C.1–C.8 are available at the CDS via anonymous ftp to cdsarc.cds.unistra.fr (130.79.128.5) or via https://cdsarc.cds.unistra.fr/viz-bin/cat/J/A+A/694/A24.
Figure D.3 is available via Zenodo.
Acknowledgements
This paper makes use of the following ALMA data: ADS/JAO.ALMA#2017.1.01355.L, #2013.1.01365.S, and #2015.1.01273.S. ALMA is a partnership of ESO (representing its member states), NSF (USA) and NINS (Japan), together with NRC (Canada), MOST and ASIAA (Taiwan), and KASI (Republic of Korea), in cooperation with the Republic of Chile. The Joint ALMA Observatory is operated by ESO, AUI/NRAO and NAOJ. The project leading to this publication has received support from ORP, which is funded by the European Union’s Horizon 2020 research and innovation program under grant agreement No. 101004719 [ORP]. This project has received funding from the European Research Council (ERC) via the ERC Synergy Grant ECOGAL (grant 855130) and from the French Agence Nationale de la Recherche (ANR) through the project COSMHIC (ANR-20-CE31-0009). Y.P. and B.L. acknowledge funding from the European Research Council (ERC) under the European Union’s Horizon 2020 research and innovation programme, for the Project DOC, grant agreement No 741002. T.N. and R.G.M. acknowledge support from UNAM-PAPIIT project IN104319 and from CONACyT Ciencia de Frontera project ID 86372. Part of this work was performed at the high-performance computers at IRyA-UNAM. T.N. acknowledges support from the Large Grant INAF 2022 YODA. T.Cs. and M.B. have received financial support from the French State in the framework of the IdEx Université de Bordeaux Investments for the future Program. A.S. gratefully acknowledges support by the Fondecyt Regular (project code 1220610), and ANID BASAL project FB210003. A.G. acknowledges support from the NSF under grants AST 2008101 and CAREER 2142300. F.L. acknowledges support by the Marie Curie Action of the European Union (project MagiKStar, Grant agreement number 841276). M.B. is a postdoctoral fellow in the University of Virginia’s VICO collaboration and is funded by grants from the NASA Astrophysics Theory Program (grant number 80NSSC18K0558) and the NSF Astronomy & Astrophysics program (grant number 2206516). P.S. was partially supported by a Grant-in-Aid for Scientific Research (KAKENHI Number JP22H01271 and JP23H01221) of JSPS. R.A. gratefully acknowledges support from ANID Beca Doctorado Nacional 21200897. L.B. gratefully acknowledges support by the ANID BASAL project FB210003.
Appendix A Background-diluted dust temperature of cores in the ALMA-IMF protoclusters
This section presents our best-estimate of the background-diluted temperature of cores, based on the two dust temperature images produced by Dell’Ova et al. (2024) using the PPMAP technique. The “original dust temperature images” are the regular output of the PPMAP procedure (Marsh et al. 2015, 2017). Since ALMA-IMF protoclusters are highly embedded protoclusters, >5 × 1022 cm−2 (Díaz-González et al. 2023, see their Figs. 9 and 14), Dell’Ova et al. (2024) further corrected the PPMAP dust temperature for the opacity of their 70 μm emission. The resulting image, the “corrected dust temperature image”, is better suited than the original dust temperature image for the embedded ALMA-IMF protoclusters and in particular for the line-of-sights toward their luminous protostars and H II regions. As this correction was designed for hot, embedded sources, we must propose another background-diluted temperature image for the cold parts of the ALMA-IMF protoclusters, including low-luminosity protostellar cores and prestellar core candidates (see definitions in Sect. 2). We therefore created “combined dust temperature images”, which consist of the opacity-corrected image except at the location of prestellar cores and low-luminosity protostars, where the average of the two is taken (see Sect. 3.1). In detail, we measured the temperatures at the location of these cores in both the original and opacity-corrected temperature images, and averaged them. Gaussians with these peak values and widths corresponding to the half power beam width of each 1.3 mm image then replace the opacity-corrected temperature for the low-luminosity protostars and prestellar cores.
Table A.1 lists the spatially averaged dust temperatures, ![$\[\overline{T_{\text {dust}}^{P P M A P}}\]$](/articles/aa/full_html/2025/02/aa51931-24/aa51931-24-eq26.png) , and the mean temperatures weighted by the column density,
, and the mean temperatures weighted by the column density, ![$\[\overline{T_{\text {dust}}^{P P M A P}}\]$](/articles/aa/full_html/2025/02/aa51931-24/aa51931-24-eq27.png) [w-NH2], both in the original and combined images, and their differences. Figure A.1 displays the original and combined PPMAP temperature images, and their subtraction, for the Young protocluster W43-MM1 and the Evolved protoclusters G012.80 and W51-IRS2. The comparison of the original and combined images shows that, on average, they are very close (see, e.g., Fig. A.1). Their values deviate toward protostars and H II regions, in agreement with the purpose of the correction of the 70 μm opacity. In more detail, when spatially averaged over the full extent of the ALMA-IMF protoclusters, the mean dust temperature of the original versus combined PPMAP images are only 1–3 K different. As for the temperature weighted by the column density, which can meaningfully be compared to temperature derived from SED estimates in beams covering the full extent of ALMA-IMF protoclusters, they are slightly hotter for Evolved protoclusters than Young or Intermediate protoclusters. The largest increases,
[w-NH2], both in the original and combined images, and their differences. Figure A.1 displays the original and combined PPMAP temperature images, and their subtraction, for the Young protocluster W43-MM1 and the Evolved protoclusters G012.80 and W51-IRS2. The comparison of the original and combined images shows that, on average, they are very close (see, e.g., Fig. A.1). Their values deviate toward protostars and H II regions, in agreement with the purpose of the correction of the 70 μm opacity. In more detail, when spatially averaged over the full extent of the ALMA-IMF protoclusters, the mean dust temperature of the original versus combined PPMAP images are only 1–3 K different. As for the temperature weighted by the column density, which can meaningfully be compared to temperature derived from SED estimates in beams covering the full extent of ALMA-IMF protoclusters, they are slightly hotter for Evolved protoclusters than Young or Intermediate protoclusters. The largest increases, ![$\[\overline{T_{\text {dust}}^{P P M A P}}\]$](/articles/aa/full_html/2025/02/aa51931-24/aa51931-24-eq28.png) [w-NH2] ≃ 10 K to ≃ 17 K, are found for the three protoclusters, which host the most luminous protostars of ALMA-IMF: G327.29, W51-E, and W51-IRS2 (see Sect. 2.3 and Table C.3). The other protoclusters globally have their mean temperature increased by
[w-NH2] ≃ 10 K to ≃ 17 K, are found for the three protoclusters, which host the most luminous protostars of ALMA-IMF: G327.29, W51-E, and W51-IRS2 (see Sect. 2.3 and Table C.3). The other protoclusters globally have their mean temperature increased by ![$\[\overline{T_{\text {dust}}^{P P M A P}}\]$](/articles/aa/full_html/2025/02/aa51931-24/aa51931-24-eq29.png) [w-NH2] ≃ 2–5 K above 24.5 ± 1.8 K, leading to a decrease of their total mass by only ~15%.
[w-NH2] ≃ 2–5 K above 24.5 ± 1.8 K, leading to a decrease of their total mass by only ~15%.
In Fig. A.1c, displaying the difference between the combined and original image of W43-MM1, we measure a small increase in temperature over the protocluster extent from a spatially averaged temperature of ~27 K (see Table A.1). Both the original and combined images show filaments with temperatures 2 K lower than their surroundings, consistent with an expected self-shielding of the denser gas. Moreover, in the densest parts of the W43-MM1 cloud, the combined image presents several temperature peaks up to ~46 K (see Fig. A.1c). These hot areas, either point-like or extended, are in line with the heating expected from the luminosity of their protostellar cores listed in Table C.4. According to Section 4.1, the heating radius reaching the background temperature of ![$\[T_{\text {dust }}^{\mathrm{bck}}\]$](/articles/aa/full_html/2025/02/aa51931-24/aa51931-24-eq30.png) is
is
![$\[r(T_{\text {dust}}^{\mathrm{bck}}, L_{\text {proto} \star}) \simeq 2100 ~\mathrm{au} \times\left(\frac{T_{\text {dust}}^{\mathrm{bck}}}{43.5 \mathrm{~K}}\right)^{-1 / 0.36} \times\left(\frac{L_{\text {proto} \star}}{1100 ~L_{\odot}}\right)^{0.5}\]$](/articles/aa/full_html/2025/02/aa51931-24/aa51931-24-eq31.png) (A.1)
(A.1)
and for ![$\[T_{\text {dust }}^{\mathrm{bck}}\]$](/articles/aa/full_html/2025/02/aa51931-24/aa51931-24-eq32.png) ≃ 23 K in the inner part of the W43-MM1 protocluster located at 5.5 kpc, it leads to the angular radius of
≃ 23 K in the inner part of the W43-MM1 protocluster located at 5.5 kpc, it leads to the angular radius of
![$\[\theta(T_{\text {dust}}^{\text {bck}}=23 \mathrm{~K}, L_{\text {proto} \star}) \simeq 2.2^{\prime \prime} \times\left(\frac{L_{\text {proto} \star}}{1100 ~L_{\odot}}\right)^{0.5}.\]$](/articles/aa/full_html/2025/02/aa51931-24/aa51931-24-eq33.png) (A.2)
(A.2)
W43-MM1 presents nine heating points, of which the four main ones are extended, with radii computed from Eq. (A.2) to be θ(23 K) ≃ 2″−5″ (see Fig. A.1c). Prestellar cores and lowluminosity protostellar cores in the immediate proximity of these luminous protostars should be heated by their luminosity, like observed for other cores under the influence of luminous sources (Sánchez-Monge et al. 2013; Bőgner et al. 2022).
In Figs. A.1f and A.1i, G012.80 and W51-IRS2 display a similar increase of temperature between the original and combined images from spatially averaged temperatures of 28–29 K (see Table A.1), than in Young protoclusters. Both the original and combined images display warm gas associated to their developed H II regions. Since the combined images are constructed to correct for the opacity of the 70 μm emission, the heating of these H II regions is better revealed in the combined images. Evolved protoclusters show a more substantial increase of their temperature weighted spatially by the column density, ![$\[\overline{T_{\text {dust}}^{P P M A P}}\]$](/articles/aa/full_html/2025/02/aa51931-24/aa51931-24-eq34.png) [w-NH2] ≃ 3 − 17 K (see Table A.1). The increased heating of the high-density gas is caused by their luminous protostars, as in the Young protoclusters. G012.80 and W51-IRS2 host eight and two main heating points, respectively, associated with luminous protostars or HCH II regions (see Figs. A.1e–f, A.1h–i and Table A.1). Using the protostellar luminosities listed in Tables C.4 and C.8 published at the CDS in Eq. (A.1), we computed heating radii of θ(26 K) ≃ 2.5″−3.7″ in G012.80 and θ(28 K) ≃ 18″ in W51-IRS2 (see Figs. A.1f, A.1i).
[w-NH2] ≃ 3 − 17 K (see Table A.1). The increased heating of the high-density gas is caused by their luminous protostars, as in the Young protoclusters. G012.80 and W51-IRS2 host eight and two main heating points, respectively, associated with luminous protostars or HCH II regions (see Figs. A.1e–f, A.1h–i and Table A.1). Using the protostellar luminosities listed in Tables C.4 and C.8 published at the CDS in Eq. (A.1), we computed heating radii of θ(26 K) ≃ 2.5″−3.7″ in G012.80 and θ(28 K) ≃ 18″ in W51-IRS2 (see Figs. A.1f, A.1i).
Ultimately, the most luminous protostars largely heat the high-density parts of the ALMA-IMF protoclusters, regardless of their evolutionary status (see Fig. A.1 and Table A.1). The three extreme protoclusters, G327.29, W51-E, and W51-IRS2, which host protostars with luminosities larger than 104 L⊙ (see Tables C.3 and C.8 published at the CDS), have mean temperatures, measured in the combined image and weighted by column density, above 35 K (see Table A.1). From Eq. (3), the radii of heating down to their background temperature are θ(22.5 K, 9000 L⊙) ≃ 15″ in G327.29, θ(23.6 K, 32 000 L⊙) ≃ 11″ and θ(23.6 K, 90 000 L⊙) ≃ 19″ in W51-E and θ(28 K, 200 000 L⊙) ≃ 18″ in W51-IRS2. These radii cover a large part of the G327.29, W51-E, and W51-IRS2 protoclusters, and in particular their high-column density parts, as illustrated in Fig. A.1h for W51-IRS2. This alone explains the overall increase of the temperature of these three extreme protoclusters when measured in their combined images. The consistency between luminosity and temperature images supports the use of the combined dust temperature images.
Therefore, the combined images of dust temperature are appropriate to measure both the overall temperature of the protocluster and the background-diluted temperature of luminous protostellar cores. The background-diluted temperature of low-luminosity protostellar cores and prestellar cores is necessarily influenced by the overall cloud temperature and its local heating by luminous protostars. The original dust temperature images of, for instance, Figs. A.1a, d, and g thus underestimate the temperature of all cores, including low-luminosity protostellar cores and prestellar cores. The opacity-corrected image, however, provides local heating within all high-density peaks, including prestellar cores (Dell’Ova et al. 2024). At the location of all prestellar cores and low-luminosity protostars, which are undetected in the PPMAP luminosity images, we therefore averaged the temperatures measured in the original and in the opacity-corrected images. This simple average merely provides a first order estimates of their background-diluted temperature, taking into account both the underestimation of cloud heating and the overestimation of local heating. Errorbars at these locations cover the two extreme values provided by the original and opacity-corrected temperature maps.
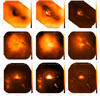 |
Fig. A.1 Original (left) and combined (center column) dust temperature images and their subtraction (right) for the Young protocluster W43-MM1 (upper) and the Evolved protoclusters G012.80 (central row) and W51-IRS2 (lower). In the right panels, bright areas represent gas structures, whose 70 μm flux is extinguished by the protocluster high column density gas. Their temperature has been increased by the opacity-corrected procedure of PPMAP. Unresolved bright and dark sources are the luminous protostellar cores and, low-luminosity protostellar or prestellar cores, respectively. White circles mark the areas heated beyond the 2.5″ beam of PPMAP by the brightest protostars of these regions. |
Dust temperature in the ALMA-IMF protoclusters.
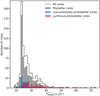 |
Fig. A.2 Distribution of the background-diluted dust temperature for protostellar cores, which are either luminous or are low-luminosity (red and blue histograms, respectively), and for prestellar cores (gray histogram). These temperatures, which approximate the background temperature of cores, are lower than those reported in Fig. 6 for protostellar cores and higher for prestellar cores. While the background-diluted dust temperature of low-luminosity protostars and prestellar cores span a narrow range, 20 − 40 K, the one of luminous protostars is twice larger. |
Figure A.2 displays the distribution of dust temperatures measured in the combined images at the location of protostellar and prestellar cores. These temperatures are quoted as the background-diluted core temperatures and are used in Sects. 4–5 (see also Fig. 3). The background-diluted dust temperature of prestellar cores and low-luminosity protostars span similar ranges, from ~20 K to ~40 K. Their values are marginally increased from those measured in the original PPMAP dust temperature images, with the notable exception of cores located close to luminous protostars (see, e.g., Figs. A.1c and A.1i). The background-diluted temperatures of luminous protostars range from ~25 K to ~70 K.
We assume in the present paper that the combined images of dust temperature are appropriate to measure both the overall temperature of the protocluster and the background-diluted temperature of cores, whatever their nature.
Appendix B Relationship between protostellar luminosity and COM line emission
In the ALMA-IMF pilot study, Motte et al. (2018b) used the flux arising from COMs and its ratio to the continuum emission to make a first-order estimate of the luminosity of protostellar cores in the W43-MM1 protocluster. This attempt was crucial, as the only existing luminosity constraints at the time were measurements made over the 18″ −36 ″ beams of Herschel in the submillimeter range (Nguyen Luong et al. 2013). Arguments in favor of a correlation between this COM intensity ratio and the protostellar luminosity were obtained by Brouillet et al. (2022), who studied this protocluster particularly rich in hot cores (Bonfand et al. 2024). The molecular emission of the eight brightest hot cores of W43-MM1, when scaled to the intensities of the CH3OCHO doublet lines at 216.21 GHz, turns out to be relatively homogeneous and, in detail, similar to within a factor of 2 − 3 (Brouillet et al. 2022).
Theoretical arguments, unfolded below, led Motte et al. (2018b) to propose a proportional relationship between the protostellar luminosity of a core powering a hot core, Lproto⋆, and the intensity ratios of the COM line emission to continuum emission (γCOM, defined in Appendix B.1) of this core and of the other hot cores of the protocluster. We here present their assumptions and equations to express the mass of gas heated to over 100 K, by the protostellar luminosity, as a function of γCOM (see Appendix B.2) and Lproto⋆ (see Appendix B.3). By equalizing the resulting equations, Appendix B.4 gives a relationship between Lproto⋆ and γCOM (see Eq. (B.8)). The mathematical relationships derived here are not used in the present study but remain interesting. They present the methodology used in the first ALMA-IMF studies, and equations and assumptions that could be improved and discussed in future studies comparing temperature estimates based on SED and COM line analyses.
B.1 γCOM definition and measurement
The intensity ratio of COM lines to continuum at 1.3 mm can be estimated by integrating the line emission measured at core center or averaged over the beam. Integrating the intensity of COM lines over a wide spectral band gives statistical significance to this intensity ratio. Brouillet et al. (2022) integrated the line intensities observed over the two spectral bands of 2 GHz each at 232.4 GHz and 233.4 GHz, from the ALMA-IMF pilot dataset. In these two spectral bands, which cover no molecular lines other than COMs, Molet et al. (2019) identified over 100 molecular line transitions, including those from CH3OH, CH3OCHO, CH3CN, and C2H5CN. The intensity ratio of COM line emission, S COM, to the continuum emission, S cont, is simply
![$\[\gamma_{\mathrm{COM}}=\frac{S_{~\mathrm{COM}}}{S_{~\mathrm{cont}}}.\]$](/articles/aa/full_html/2025/02/aa51931-24/aa51931-24-eq40.png) (B.1)
(B.1)
While the continuum emission is assumed to represent the core mass, the brightness temperature of the line emission might be used to estimate the mass of gas radiatively heated to over ~100 K (see arguments in Appendix B.2). If the hot core emission is not resolved by the ALMA beam, this ratio reflects the dilution of the hot core gas within the beam and hence the development of the hot core, which we assume here to be mainly heated by the protostellar luminosity. In the W43-MM1 protocluster, the intensity ratios of COM line to continuum emission range from 0.5% to 50% (Brouillet et al. 2022). In Appendix B.2, we first use these γCOM ratios to estimate the mass of gas, which is radiatively heated to over 100 K.
B.2 Gas mass heated to over 100 K as a function of γCOM
The equations presented in this section are based on strong assumptions:
Firstly, we assume that COM abundances are directly and uniquely related to protostellar heating, in line with chemical models of Garrod & Herbst (2006). In agreement with this hypothesis, it has been observed that the abundance of certain COMs correlates with the luminosity or luminosity-to-mass ratio of high-mass protostars (e.g., Coletta et al. 2020). This hypothesis rejects any other physical processes that may desorb COMs from the grain such as outflow or accretion shocks (see, e.g., Lefloch et al. 2017; Palau et al. 2017; Csengeri et al. 2019; Busch et al. 2024; Bouscasse et al. 2024) or form COMs in the gas phase (e.g., De Simone et al. 2020; Law et al. 2021). Furthermore, it ignores the variability of COMs production depending on their composition. For instance, is has been shown that O-bearing COMs are enriched in shocked regions and that complex cyanides are sensitive to other processes (Lefloch et al. 2017; Palau et al. 2021; Rojas-García et al. 2024).
We also assume that continuum and COM line emissions are optically thin throughout the entire volume of the cores considered here. However, the most massive cores of ALMA-IMF are found to be partly optically thick at 1.3 mm (Motte et al. 2018b; Louvet et al. 2024, and see Sect. 6.2). And the hot cores in the W51-E and W51-IRS2 protoclusters also show indications of optical thickness (De Simone et al. 2020; Jeff et al. 2024).
Finally, despite the fact that each molecular transition has its own characteristics (frequency, Einstein coefficients, energy, degeneracy, and partition function at the excitation temperature), we assume that the ensemble of all observed COM transitions in a given cloud can be statistically represented by a single line with similar median characteristics. Arguments in favor of the homogeneity of COM abundances in hot core gas are found with relatively constant abundance ratios across a wide range of physical conditions (Bonfand et al. 2019; Brouillet et al. 2022). In detail, however, this assumption of homogeneity is challenged when chemical differentiation is observed, particularly with Obearing COMs and complex cyanides localized in different parts of the protostellar envelopes (e.g., Jiménez-Serra et al. 2012; Rojas-García et al. 2024). Protostars in the same protostellar group (see Fig. 1) or in Young ALMA-IMF protoclusters should have formed from a relatively chemically homogeneous gas. The gas in Young protoclusters should also be pristine, that is yet unaffected by the feedback effects of stars already formed. In these environments, the relative contribution of COM lines is therefore expected to be close from one protostar to another.
In the unlikely event that these three hypotheses hold, we would expect a correlation between the integrated flux density of COM lines, summed over a wide spectral band, and the gas mass of a protostellar envelope, assumed to be heated by the luminosity of its central protostar. Systematic biases due to optical depth effects and the different chemical origin for COMs should distort such a correlation, and at our angular resolution, could play a role that remains to be quantified. COM lines emitted by hot cores correspond to molecular transitions with excitation temperatures ranging from 50 K (e.g., Belloche et al. 2013; Bouscasse et al. 2022) to 300 K (e.g., Gibb et al. 2000; Ginsburg et al. 2022), with many excitation temperatures around ~100 K (e.g., Bonfand et al. 2017; Brouillet et al. 2022). When considering a large number of COM transitions, that is within so-called hot core line forests, the median value of the excitation temperature should therefore be statistically close to the desorption temperatures predicted for COMs in chemical models, that is ~100 K (e.g., Garrod & Herbst 2006). Moreover, since protostellar envelopes are dense regions of the interstellar medium, and if the line and continuum emissions are optically thin, the excitation temperatures correlate well with the dust temperature and can be considered equal to it.
Under these conditions, the mass of gas heated to over 100 K by the luminosity of a protostar, ![$\[M_{\text {envelope }}^{>100 \mathrm{~K}}\]$](/articles/aa/full_html/2025/02/aa51931-24/aa51931-24-eq41.png) , should be statistically proportional to the integrated flux density of the COM lines, SCOM, which itself is proportional to the intensity ratio between the COM line to continuum emissions, γCOM:
, should be statistically proportional to the integrated flux density of the COM lines, SCOM, which itself is proportional to the intensity ratio between the COM line to continuum emissions, γCOM:
![$\[M_{\text {envelope }}^{>100 \mathrm{~K}} \propto S_{~\mathrm{COM}}=\gamma_{\mathrm{COM}} \times S_{~\text {cont }}.\]$](/articles/aa/full_html/2025/02/aa51931-24/aa51931-24-eq42.png) (B.2)
(B.2)
This equation can be compared to that describing the mass of gas heated to over 100 K, as a function of the protostellar luminosity (see Appendix B.3).
B.3 Gas mass heated to over 100 K as a function of Lproto⋆
As in Sect. 4.2, we here assume that protostellar envelopes are spherical, centrally heated, optically thin to infrared radiation, and well described by a power-law density profile. With these assumptions, protostellar envelopes follow the temperature profile of Eq. (1), which becomes Eq. (3) with p = 2 and β = 1.5 for the power-law indices of the density and dust emissivity laws. The radius at which the temperature of the protostellar envelope reaches 100 K, R100 K, is then derived from Eq. (3), according to
![$\[R_{100 \mathrm{~K}}(L_{\text {proto} \star}) \simeq 207 ~\mathrm{au} \times\left(\frac{L_{\text {proto} \star}}{1100 ~L_{\odot}}\right)^{0.5}.\]$](/articles/aa/full_html/2025/02/aa51931-24/aa51931-24-eq43.png) (B.3)
(B.3)
For a given protostellar envelope, the mass of heated gas above 100 K is therefore the integration, up to R100 K (see Eq. (B.3)), of its density profile assumed to be of the form ![$\[\rho(r)=\rho_{0}\left(\frac{r}{r_{0}}\right)^{-2}\]$](/articles/aa/full_html/2025/02/aa51931-24/aa51931-24-eq44.png) , where ρ0 is the envelope volumetric density at r0 radius.
, where ρ0 is the envelope volumetric density at r0 radius.
![$\[\begin{aligned}M_{\text {envelope }}^{>100 \mathrm{~K}} & =4 \pi ~\rho_0 ~r_0^2 \times R_{100 \mathrm{~K}} \\& =4 \pi ~\rho_0 ~r_0^2 \times 207 ~\mathrm{au} \times\left(\frac{L_{\mathrm{proto}\star}}{1100 ~L_{\odot}}\right)^{0.5}.\end{aligned}\]$](/articles/aa/full_html/2025/02/aa51931-24/aa51931-24-eq45.png) (B.4)
(B.4)
We introduced the mass Mbeam of the protostellar envelope measured in a beam of radius Rbeam = θbeam × d, where θbeam is the half power beam width of the observation considered and d is the distance to the Sun:
![$\[M_{\text {beam }}=4 \pi ~\rho_{0} ~r_{0}^{2} ~R_{\text {beam }}\]$](/articles/aa/full_html/2025/02/aa51931-24/aa51931-24-eq46.png)
to simplify Eq. (B.4), that becomes
![$\[M_{\text {envelope }}^{>100 \mathrm{~K}}=M_{\text {beam }} \times\left(\frac{207 ~\mathrm{au}}{R_{\text {beam}}}\right) \times\left(\frac{L_{\text {proto} \star}}{1100 ~L_{\odot}}\right)^{0.5}.\]$](/articles/aa/full_html/2025/02/aa51931-24/aa51931-24-eq47.png) (B.5)
(B.5)
If we assume that the continuum emission at contλ = 1.3 mm is optically thin in the beam of our ALMA observations, masses integrated within the beam are computed from the following equation that, we here simplify using the Rayleigh-Jeans approximation and assuming that d and κλ will not vary from one protostar to another in a given region:
![$\[\begin{gathered}M_{\text {beam}} \qquad=\frac{S_{~\text {cont} \lambda} ~d^2}{\kappa_\lambda ~B_\lambda(\overline{T_{\text {dust}}} [R_{\text {beam}}])} \\\quad\quad\quad\propto S_{~\text {cont} \lambda} \times(\overline{T_{\text {dust}}}[R_{\text {beam}}])^{-1}.\end{gathered}\]$](/articles/aa/full_html/2025/02/aa51931-24/aa51931-24-eq48.png) (B.6)
(B.6)
Applying Eq. (4) to Rbeam, which is constant for all protostars of a given region, Eq. (B.5) gives the following proportional relationship between the mass of gas heated to over 100 K and the protostellar luminosity:
![$\[\begin{aligned}& M_{\text {envelope}}^{>100 \mathrm{~K}} \propto S_{~\text {cont} \lambda} \times\left(L_{\text {proto} \star}\right)^{0.5} \times\left(L_{\text {proto} \star}\right)^{-0.18} \\& ~~~~~~~\quad\quad \propto S_{~\text {cont} \lambda} \times\left(L_{\text {proto} \star}\right)^{0.32}.\end{aligned}\]$](/articles/aa/full_html/2025/02/aa51931-24/aa51931-24-eq49.png) (B.7)
(B.7)
As mentioned in Sect. 6.1, these equations are strictly valid only in the case of spherical geometry. However, observations at very high spatial resolutions now indicate that protostellar envelopes subfragment and harbor disks and outflow cavities (Yoo et al. in prep.). This deviation from spherical geometry will modify the density and temperature laws within the protostellar envelope, which in turn will have a very strong impact on the chemistry expected in these various components.
B.4 Relationship between the protostellar luminosity and the intensity ratio of the COM line to the continuum emission
Combining the relationships found in Appendices B.2 and B.3 (see Eqs. B.2 and B.7) that describe the mass of gas heated to over 100 K gives a proportional relationship between Lproto⋆ and γCOM,
![$\[\gamma_{\text {COM }} \times S_{~\text {cont}} \propto S_{~\text {cont} \lambda} \times\left(L_{\text {proto}\star}\right)^{0.32},\]$](/articles/aa/full_html/2025/02/aa51931-24/aa51931-24-eq50.png)
![$\[L_{\text {proto}\star} \propto\left(\gamma_{\mathrm{COM}}\right)^{3.1}\]$](/articles/aa/full_html/2025/02/aa51931-24/aa51931-24-eq51.png)
because the continuum flux mentioned here is the flux density of the continuum emission at 1.3 mm, as measured in a beam at the location of the protostellar core.
This proportionality relationship is based on a very simple hot core model, whose simplistic assumptions are presented in Sect. B.2 and a simple protostellar envelope model, discussed in Sect. B.3. It was interesting at the time of the ALMA-IMF pilot study of Motte et al. (2018b), and is only statistically valid for a Young region with many cores, such as W43-MM1. Its extension to all hot cores forming in ALMA-IMF protoclusters, or even more difficult in protoclusters in general, will require significant improvements to this model, notably by taking better account of some of its many limitations and even resolving some of them.
Appendix C Tables
Appendix C presents Tables C.1–C.2 and Table C.4, which focus on the case study regions G012.80, W43-MM1, W43-MM2, and- MM3. Tables C.6–C.8 published at the CDS complement them, respectively, for the ten other ALMA-IMF regions: the Young G327.29, G328.25, G337.92, and G338.93 protoclusters, the Intermediate G008.67, G353.41, and W51-E protoclusters, and the Evolved G010.62, G333.60, and W51-IRS2 protoclusters.
Tables C.1 and C.6 published at the CDS list, for the Young and Intermediate protoclusters, their luminosity peaks associated with protostars, characterize them and their association with temperature peaks (see Sects. 2.1–2.2 and 3.2, Fig. D.1). Tables C.2 and C.7 published at the CDS do the same for the luminosity peaks identified by the present study in Evolved protoclusters.
As for Tables C.4 and C.8 published at the CDS, they give the main physical properties of the protostellar cores found in the ALMA-IMF protoclusters. They list their mass-averaged temperature, mass, and luminosity, as computed in Sects. 4 and 6.1 (see also Fig. 3), in Sect. 6.2, and in Sect. 4.3 (see also Fig. 4).
Table C.5 is dedicated to the prestellar core candidates found in the 14 ALMA-IMF protoclusters studied in the present study (see Sects. 2.1). It focuses here on the cores more massive than 6.5 M⊙ but the complete table of 616 ALMA-IMF prestellar cores is accessible through the CDS services. The table provides the mass-averaged dust temperature and mass of prestellar cores, as computed in Sect. 5 (see also Fig. 3) and Sect. 6.2, respectively.
Luminosity peaks in Young and Intermediate W43 protoclusters and their association with temperature peaks and protostellar cores.
Luminosity peaks in the Evolved G012.80 protocluster and their association with temperature peaks and protostellar cores.
Luminosity and mass-averaged temperature of the protostellar cores driving the six brightest hot cores of ALMA-IMF.
Main characteristics of protostellar cores in the G012.80, W43-MM1, W43-MM2, and W43-MM3 protoclusters.
Main characteristics of the 616 prestellar cores in the ALMA-IMF protoclusters.
Appendix D Complementary figures
Appendix D complements Fig. 1 by presenting in Fig. D.1 all the other coincidences of luminosity peaks with the ALMA-IMF protostellar cores (Nony et al. 2020, 2023, in prep.; Armante et al. 2024; Valeille-Manet et al. 2024). In addition, Fig. D.2 displays the luminosity profiles at four locations encompassing the six brightest hot cores of ALMA-IMF (Bonfand et al. 2024). These profiles are used to estimate the total luminosity of their eight associated protostellar cores, which are listed in Table C.3. And Fig. D.3, published on Zenodo, compares the mass-averaged dust temperature of prestellar cores, whether they are located in luminosity peaks or not.
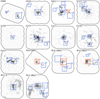 |
Fig. D.1 Zoom into the luminosity and temperature peaks, characterized at 2.5″, to identify their associated protostellar and prestellar cores, detected at 0.3″−0.9″ resolution. Fourteen first panels: Location of the different zooms on the 1.3 mm image of each ALMA-IMF protocluster. Red squares outline the zooms of Fig. 1 and blue squares the complementary zooms shown here. Zoom-in of regions in ALMA-IMF protoclusters: G008.67 (two panels), G10.62 (two panels), G012.80 (five panels completing Fig. 1a), and G327.29 (three panels). Red and blue contours display the PPMAP luminosity and dust temperature map values, respectively, overlaid on the 1.3 mm continuum map shown in the grayscale background. Orange ellipses outline the FWHM size of the luminosity peaks associated with at least one protostellar core (see Dell’Ova et al. 2024, Tables C.2 and C.7 published at the CDS). White ellipses and crosses locate the protostellar and prestellar cores, respectively, identified by (Nony et al. 2020, 2023, in prep.), Pouteau et al. (2022), Armante et al. (2024), and Louvet et al. (2024). A scale bar is shown in the right-hand side of each panel. Some luminosity (and temperature) peaks host two and up to four protostellar cores of 1900 au typical size (see, e.g., P1 and P4 in G10.62). Zoom-in of regions in ALMA-IMF protoclusters: G328.25 (one panel), G333.60 (three panels), G337.92.80 (two panels), G338.93 (three panels), G353.41 (two panels), and W43-MM1 (one panel completing Fig. 1b). Some luminosity (and temperature) peaks host two and up to four protostellar cores of 1900 au typical size (see, e.g., P4 in G333.60, P2 in G337.92, and P3 and P10 in G338.93). Zoom-in of regions in ALMA-IMF protoclusters: W43-MM2 (three panels completing Fig. 1c), W43-MM3 (two panels completing Fig. 1d), W51-E (two panels), and W51-IRS2 (five panels). Some luminosity (and temperature) peaks host two and up to four protostellar cores of 1900 au typical size (see, e.g., P1 and P2 in W51-E, P1 and P2 in W51-IRS2). |
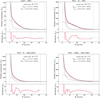 |
Fig. D.2 Luminosity profiles of the four positions at 2.5" resolution encompassing the six brightest ALMA-IMF hot cores (Bonfand et al. 2024). The luminosity is azimuthally averaged at four locations encompassing these hot cores using the median in rings spaced by 1.25″ in radius from these locations. Profiles are fitted by the combination of a power-law and a Gaussian. |
References
- Álvarez-Gutiérrez, R. H., Stutz, A. M., Sandoval-Garrido, N., et al. 2024, A&A, 689, A74 (Paper XIII) [NASA ADS] [CrossRef] [EDP Sciences] [Google Scholar]
- Alves, J. F., Lada, C. J., & Lada, E. A. 2001, Nature, 409, 159 [NASA ADS] [CrossRef] [Google Scholar]
- Anathpindika, S., & Freundlich, J. 2015, PASA, 32, e007 [NASA ADS] [CrossRef] [Google Scholar]
- André, P., Di Francesco, J., Ward-Thompson, D., et al. 2014, Protostars and Planets VI (Tucson: University of Arizona Press), 27 [Google Scholar]
- André, P., Ward-Thompson, D., & Barsony, M. 1993, ApJ, 406, 122 [Google Scholar]
- André, P., Ward-Thompson, D., & Barsony, M. 2000, Protostars and Planets IV (Tucson: University od Arizona Press), 59 [Google Scholar]
- Armante, M., Gusdorf, A., Louvet, F., et al. 2024, A&A, 686, A122 (Paper X) [NASA ADS] [CrossRef] [EDP Sciences] [Google Scholar]
- Arzoumanian, D., André, P., Könyves, V., et al. 2019, A&A, 621, A42 [NASA ADS] [CrossRef] [EDP Sciences] [Google Scholar]
- Battersby, C., Ginsburg, A., Bally, J., et al. 2014, ApJ, 787, 113 [NASA ADS] [CrossRef] [Google Scholar]
- Beilis, D., Beck, S., & Lacy, J. 2022, MNRAS, 509, 2234 [NASA ADS] [Google Scholar]
- Belloche, A., Müller, H. S. P., Menten, K. M., Schilke, P., & Comito, C. 2013, A&A, 559, A47 [NASA ADS] [CrossRef] [EDP Sciences] [Google Scholar]
- Beuther, H., Schilke, P., Menten, K. M., et al. 2002, ApJ, 566, 945 [Google Scholar]
- Bőgner, R., Csengeri, T., Montillaud, J., et al. 2022, A&A, 667, A137 [NASA ADS] [CrossRef] [EDP Sciences] [Google Scholar]
- Bonfand, M., Belloche, A., Menten, K. M., Garrod, R. T., & Müller, H. S. P. 2017, A&A, 604, A60 [NASA ADS] [CrossRef] [EDP Sciences] [Google Scholar]
- Bonfand, M., Belloche, A., Garrod, R. T., et al. 2019, A&A, 628, A27 [NASA ADS] [CrossRef] [EDP Sciences] [Google Scholar]
- Bonfand, M., Csengeri, T., Bontemps, S., et al. 2024, A&A, 687, A163 (Paper XI) [NASA ADS] [CrossRef] [EDP Sciences] [Google Scholar]
- Bonnor, W. B. 1956, MNRAS, 116, 351 [NASA ADS] [CrossRef] [Google Scholar]
- Bontemps, S., Andre, P., Terebey, S., & Cabrit, S. 1996, A&A, 311, 858 [NASA ADS] [Google Scholar]
- Bontemps, S., André, P., Könyves, V., et al. 2010a, A&A, 518, L85+ [NASA ADS] [CrossRef] [EDP Sciences] [Google Scholar]
- Bontemps, S., Motte, F., Csengeri, T., & Schneider, N. 2010b, A&A, 524, A18 [NASA ADS] [CrossRef] [EDP Sciences] [Google Scholar]
- Bouscasse, L., Csengeri, T., Belloche, A., et al. 2022, A&A, 662, A32 [NASA ADS] [CrossRef] [EDP Sciences] [Google Scholar]
- Bouscasse, L., Csengeri, T., Wyrowski, F., Menten, K. M., & Bontemps, S. 2024, A&A, 686, A252 [NASA ADS] [CrossRef] [EDP Sciences] [Google Scholar]
- Brouillet, N., Despois, D., Molet, J., et al. 2022, A&A, 665, A140 (Paper IV) [NASA ADS] [CrossRef] [EDP Sciences] [Google Scholar]
- Busch, L. A., Belloche, A., Garrod, R. T., Müller, H. S. P., & Menten, K. M. 2024, A&A, 681, A104 [NASA ADS] [CrossRef] [EDP Sciences] [Google Scholar]
- Coletta, A., Fontani, F., Rivilla, V. M., et al. 2020, A&A, 641, A54 [NASA ADS] [CrossRef] [EDP Sciences] [Google Scholar]
- Crapsi, A., Caselli, P., Walmsley, M. C., & Tafalla, M. 2007, A&A, 470, 221 [NASA ADS] [CrossRef] [EDP Sciences] [Google Scholar]
- Csengeri, T., Bontemps, S., Schneider, N., Motte, F., & Dib, S. 2011, A&A, 527, A135 [NASA ADS] [CrossRef] [EDP Sciences] [Google Scholar]
- Csengeri, T., Bontemps, S., Wyrowski, F., et al. 2017, A&A, 601, A60 [NASA ADS] [CrossRef] [EDP Sciences] [Google Scholar]
- Csengeri, T., Belloche, A., Bontemps, S., et al. 2019, A&A, 632, A57 [NASA ADS] [CrossRef] [EDP Sciences] [Google Scholar]
- Cunningham, N., Ginsburg, A., Galván-Madrid, R., et al. 2023, A&A, 678, A194 (Paper VII) [NASA ADS] [CrossRef] [EDP Sciences] [Google Scholar]
- De Simone, M., Codella, C., Ceccarelli, C., et al. 2020, A&A, 640, A75 [NASA ADS] [CrossRef] [EDP Sciences] [Google Scholar]
- Dell’Ova, P., Motte, F., Gusdorf, A., et al. 2024, A&A, 687, A217 (Paper XII) [NASA ADS] [CrossRef] [EDP Sciences] [Google Scholar]
- Díaz-González, D. J., Galván-Madrid, R., Ginsburg, A., et al. 2023, ApJS, 269, 55 (Paper VIII) [CrossRef] [Google Scholar]
- Didelon, P., Motte, F., Tremblin, P., et al. 2015, A&A, 584, A4 [NASA ADS] [CrossRef] [EDP Sciences] [Google Scholar]
- Duarte-Cabral, A., Bontemps, S., Motte, F., et al. 2013, A&A, 558, A125 [NASA ADS] [CrossRef] [EDP Sciences] [Google Scholar]
- Dunham, M. M., Arce, H. G., Allen, L. E., et al. 2013, AJ, 145, 94 [Google Scholar]
- Estalella, R., Palau, A., & Busquet, G. 2024, MNRAS, 528, 4364 [NASA ADS] [CrossRef] [Google Scholar]
- Evans, Neal J., I., Rawlings, J. M. C., Shirley, Y. L., & Mundy, L. G. 2001, ApJ, 557, 193 [NASA ADS] [CrossRef] [Google Scholar]
- Evans, Neal J., I., Dunham, M. M., Jørgensen, J. K., et al. 2009, ApJS, 181, 321 [NASA ADS] [CrossRef] [Google Scholar]
- Furlan, E., Fischer, W. J., Ali, B., et al. 2016, ApJS, 224, 5 [Google Scholar]
- Galametz, M., Maury, A. J., Valdivia, V., et al. 2019, A&A, 632, A5 [NASA ADS] [CrossRef] [EDP Sciences] [Google Scholar]
- Galván-Madrid, R., Keto, E., Zhang, Q., et al. 2009, ApJ, 706, 10364 [Google Scholar]
- Galván-Madrid, R., Díaz-González, D. J., Motte, F., et al. 2024, ApJS, 274, 15 (Paper XIV) [CrossRef] [Google Scholar]
- Garrod, R. T., & Herbst, E. 2006, A&A, 457, 927 [NASA ADS] [CrossRef] [EDP Sciences] [Google Scholar]
- Giannetti, A., Leurini, S., Wyrowski, F., et al. 2017, A&A, 603, A33 [NASA ADS] [CrossRef] [EDP Sciences] [Google Scholar]
- Gibb, E., Nummelin, A., Irvine, W. M., Whittet, D. C. B., & Bergman, P. 2000, ApJ, 545, 309 [NASA ADS] [CrossRef] [Google Scholar]
- Gieser, C., Beuther, H., Semenov, D., et al. 2021, A&A, 648, A66 [EDP Sciences] [Google Scholar]
- Ginsburg, A., Goddi, C., Kruijssen, J. M. D., et al. 2017, ApJ, 842, 92 [Google Scholar]
- Ginsburg, A., Csengeri, T., Galván-Madrid, R., et al. 2022, A&A, 662, A9 (Paper II) [NASA ADS] [CrossRef] [EDP Sciences] [Google Scholar]
- Gómez, G. C., Vázquez-Semadeni, E., & Palau, A. 2021, MNRAS, 502, 4963 [CrossRef] [Google Scholar]
- Gonçalves, J., Galli, D., & Walmsley, M. 2004, A&A, 415, 617 [NASA ADS] [CrossRef] [EDP Sciences] [Google Scholar]
- Gong, H., & Ostriker, E. C. 2013, ApJS, 204, 8 [NASA ADS] [CrossRef] [Google Scholar]
- Herpin, F., Chavarría, L., van der Tak, F., et al. 2012, A&A, 542, A76 [NASA ADS] [CrossRef] [EDP Sciences] [Google Scholar]
- Hill, T., Motte, F., Didelon, P., et al. 2012, A&A, 542, A114 [NASA ADS] [CrossRef] [EDP Sciences] [Google Scholar]
- Hoare, M. G., Kurtz, S. E., Lizano, S., Keto, E., & Hofner, P. 2007, Protostars and Planets V (Tucson: University of Arizona Press), 181 [Google Scholar]
- Izumi, N., Sanhueza, P., Koch, P. M., et al. 2024, ApJ, 963, 163 [NASA ADS] [CrossRef] [Google Scholar]
- Jeff, D., Ginsburg, A., Bulatek, A., et al. 2024, ApJ, 962, 48 [CrossRef] [Google Scholar]
- Jiménez-Serra, I., Zhang, Q., Viti, S., Martín-Pintado, J., & de Wit, W. J. 2012, ApJ, 753, 34 [Google Scholar]
- Jørgensen, J. K., Johnstone, D., van Dishoeck, E. F., & Doty, S. D. 2006, A&A, 449, 609 [NASA ADS] [CrossRef] [EDP Sciences] [Google Scholar]
- Juárez, C., Girart, J. M., Zamora-Avilés, M., et al. 2017, ApJ, 844, 44 [Google Scholar]
- Juvela, M., Demyk, K., Doi, Y., et al. 2015, A&A, 584, A94 [NASA ADS] [CrossRef] [EDP Sciences] [Google Scholar]
- Kauffmann, J., Bertoldi, F., Bourke, T. L., Evans, N. J., I., & Lee, C. W. 2008, A&A, 487, 993 [NASA ADS] [CrossRef] [EDP Sciences] [Google Scholar]
- Köhler, M., Ysard, N., & Jones, A. P. 2015, A&A, 579, A15 [NASA ADS] [CrossRef] [EDP Sciences] [Google Scholar]
- König, C., Urquhart, J. S., Csengeri, T., et al. 2017, A&A, 599, A139 [Google Scholar]
- Könyves, V., André, P., Men’shchikov, A., et al. 2015, A&A, 584, A91 [Google Scholar]
- Koumpia, E., Evans, L., Di Francesco, J., van der Tak, F. F. S., & Oudmaijer, R. D. 2020, A&A, 643, A61 [NASA ADS] [CrossRef] [EDP Sciences] [Google Scholar]
- Kryukova, E., Megeath, S. T., Gutermuth, R. A., et al. 2012, AJ, 144, 31 [Google Scholar]
- Ladjelate, B., André, P., Könyves, V., et al. 2020, A&A, 638, A74 [NASA ADS] [CrossRef] [EDP Sciences] [Google Scholar]
- Launhardt, R., Stutz, A. M., Schmiedeke, A., et al. 2013, A&A, 551, A98 [NASA ADS] [CrossRef] [EDP Sciences] [Google Scholar]
- Law, C. J., Zhang, Q., Öberg, K. I., et al. 2021, ApJ, 909, 214 [Google Scholar]
- Lefloch, B., Ceccarelli, C., Codella, C., et al. 2017, MNRAS, 469, L73 [Google Scholar]
- Louvet, F., Motte, F., Hennebelle, P., et al. 2014, A&A, 570, A15 [NASA ADS] [CrossRef] [EDP Sciences] [Google Scholar]
- Louvet, F., Hennebelle, P., Men’shchikov, A., et al. 2021, A&A, 653, A157 [NASA ADS] [CrossRef] [EDP Sciences] [Google Scholar]
- Louvet, F., Sanhueza, P., Stutz, A., et al. 2024, A&A, 690, A33 (Paper XV) [NASA ADS] [CrossRef] [EDP Sciences] [Google Scholar]
- Malinen, J., Juvela, M., Collins, D. C., Lunttila, T., & Padoan, P. 2011, A&A, 530, A101 [NASA ADS] [CrossRef] [EDP Sciences] [Google Scholar]
- Marsh, K. A., Griffin, M. J., Palmeirim, P., et al. 2014, MNRAS, 439, 3683 [NASA ADS] [CrossRef] [Google Scholar]
- Marsh, K. A., Whitworth, A. P., & Lomax, O. 2015, MNRAS, 454, 4282 [Google Scholar]
- Marsh, K. A., Whitworth, A. P., Lomax, O., et al. 2017, MNRAS, 471, 2730 [Google Scholar]
- McKee, C. F., & Ostriker, E. C. 2007, ARA&A, 45, 565 [Google Scholar]
- Men’shchikov, A. 2016, A&A, 593, A71 [Google Scholar]
- Men’shchikov, A. 2021, A&A, 649, A89 [EDP Sciences] [Google Scholar]
- Merello, M., Molinari, S., Rygl, K. L. J., et al. 2019, MNRAS, 483, 5355 [NASA ADS] [CrossRef] [Google Scholar]
- Mininni, C., Fontani, F., Sánchez-Monge, A., et al. 2021, A&A, 653, A87 [NASA ADS] [CrossRef] [EDP Sciences] [Google Scholar]
- Molet, J., Brouillet, N., Nony, T., et al. 2019, A&A, 626, A132 [EDP Sciences] [Google Scholar]
- Molinari, S., Faustini, F., Testi, L., et al. 2008, A&A, 487, 1119 [NASA ADS] [CrossRef] [EDP Sciences] [Google Scholar]
- Molinari, S., Merello, M., Elia, D., et al. 2016, ApJ, 826, L8 [Google Scholar]
- Molinari, S., Baldeschi, A., Robitaille, T. P., et al. 2019, MNRAS, 486, 4508 [Google Scholar]
- Motte, F., & André, P. 2001, A&A, 365, 440 [NASA ADS] [CrossRef] [EDP Sciences] [Google Scholar]
- Motte, F., Schilke, P., & Lis, D. C. 2003, ApJ, 582, 277 [NASA ADS] [CrossRef] [Google Scholar]
- Motte, F., Bontemps, S., Schilke, P., et al. 2007, A&A, 476, 1243 [NASA ADS] [CrossRef] [EDP Sciences] [Google Scholar]
- Motte, F., Zavagno, A., Bontemps, S., et al. 2010, A&A, 518, L77 [CrossRef] [EDP Sciences] [Google Scholar]
- Motte, F., Bontemps, S., & Louvet, F. 2018a, ARA&A, 56, 41 [NASA ADS] [CrossRef] [Google Scholar]
- Motte, F., Nony, T., Louvet, F., et al. 2018b, Nat. Astron., 2, 478 [Google Scholar]
- Motte, F., Bontemps, S., Csengeri, T., et al. 2022, A&A, 662, A8 (Paper I) [NASA ADS] [CrossRef] [EDP Sciences] [Google Scholar]
- Nguyen Luong, Q., Anderson, L. D., Motte, F., et al. 2017, ApJ, 844, L25 [NASA ADS] [CrossRef] [Google Scholar]
- Nguyen Luong, Q., Motte, F., Hennemann, M., et al. 2011, A&A, 535, A76 [NASA ADS] [CrossRef] [EDP Sciences] [Google Scholar]
- Nguyen Luong, Q., Motte, F., Carlhoff, P., et al. 2013, ApJ, 775, 88 [CrossRef] [Google Scholar]
- Nielbock, M., Launhardt, R., Steinacker, J., et al. 2012, A&A, 547, A11 [NASA ADS] [CrossRef] [EDP Sciences] [Google Scholar]
- Nony, T., Galván-Madrid, R., Motte, F., et al. 2023, A&A, 674, A75 (Paper V) [NASA ADS] [CrossRef] [EDP Sciences] [Google Scholar]
- Nony, T., Motte, F., Louvet, F., et al. 2020, A&A, 636, A38 [NASA ADS] [CrossRef] [EDP Sciences] [Google Scholar]
- Nony, T., Robitaille, J. F., Motte, F., et al. 2021, A&A, 645, A94 [NASA ADS] [CrossRef] [EDP Sciences] [Google Scholar]
- Olguin, F. A., Sanhueza, P., Chen, H.-R. V., et al. 2023, ApJ, 959, L31 [NASA ADS] [CrossRef] [Google Scholar]
- Pagani, L., Lagache, G., Bacmann, A., et al. 2003, A&A, 406, L59 [NASA ADS] [CrossRef] [EDP Sciences] [Google Scholar]
- Palau, A., Walsh, C., Sánchez-Monge, Á., et al. 2017, MNRAS, 467, 2723 [NASA ADS] [Google Scholar]
- Palau, A., Zhang, Q., Girart, J. M., et al. 2021, ApJ, 912, 159 [NASA ADS] [CrossRef] [Google Scholar]
- Palmeirim, P., André, P., Kirk, J., et al. 2013, A&A, 550, A38 [NASA ADS] [CrossRef] [EDP Sciences] [Google Scholar]
- Peretto, N., Rigby, A., André, P., et al. 2020, MNRAS, 496, 3482 [NASA ADS] [CrossRef] [Google Scholar]
- Peretto, N., Rigby, A. J., Louvet, F., et al. 2023, MNRAS, 525, 2935 [NASA ADS] [CrossRef] [Google Scholar]
- Planck Collaboration XXIV. 2011, A&A, 536, A24 [NASA ADS] [CrossRef] [EDP Sciences] [Google Scholar]
- Pols, S., Schwörer, A., Schilke, P., et al. 2018, A&A, 614, A123 [NASA ADS] [CrossRef] [EDP Sciences] [Google Scholar]
- Pouteau, Y., Motte, F., Nony, T., et al. 2022, A&A, 664, A26 (Paper III) [NASA ADS] [CrossRef] [EDP Sciences] [Google Scholar]
- Pouteau, Y., Motte, F., Nony, T., et al. 2023, A&A, 674, A76 (Paper VI) [NASA ADS] [CrossRef] [EDP Sciences] [Google Scholar]
- Rathborne, J. M., Jackson, J. M., Chambers, E. T., et al. 2010, ApJ, 715, 310 [NASA ADS] [CrossRef] [Google Scholar]
- Robitaille, J. F., Motte, F., Schneider, N., Elia, D., & Bontemps, S. 2019, A&A, 628, A33 [NASA ADS] [CrossRef] [EDP Sciences] [Google Scholar]
- Robitaille, T. P. 2017, A&A, 600, A11 [NASA ADS] [CrossRef] [EDP Sciences] [Google Scholar]
- Rojas-García, O. S., Gómez-Ruiz, A. I., Palau, A., et al. 2024, MNRAS, 527, 2110 [Google Scholar]
- Roy, A., André, P., Palmeirim, P., et al. 2014, A&A, 562, A138 [NASA ADS] [CrossRef] [EDP Sciences] [Google Scholar]
- Sánchez-Monge, Á., Palau, A., Fontani, F., et al. 2013, MNRAS, 432, 3288 [CrossRef] [Google Scholar]
- Sandoval-Garrido, N. A., Stutz, A. M., Álvarez-Gutiérrez, R. H., et al. 2024, A&A, submitted [NASA ADS] [CrossRef] [EDP Sciences] [Google Scholar]
- Shu, F. H. 1977, ApJ, 214, 488 [Google Scholar]
- Smith, R. J., Clark, P. C., & Bonnell, I. A. 2009, MNRAS, 396, 830 [Google Scholar]
- Stutz, A. M. 2018, MNRAS, 473, 4890 [NASA ADS] [CrossRef] [Google Scholar]
- Stutz, A. M., & Gould, A. 2016, A&A, 590, A2 [NASA ADS] [CrossRef] [EDP Sciences] [Google Scholar]
- Terebey, S., Chandler, C. J., & Andre, P. 1993, ApJ, 414, 759 [NASA ADS] [CrossRef] [Google Scholar]
- Tigé, J., Motte, F., Russeil, D., et al. 2017, A&A, 602, A77 [Google Scholar]
- Towner, A. P. M., Ginsburg, A., Dell’Ova, P., et al. 2024, ApJ, 960, 48 (Paper IX) [NASA ADS] [CrossRef] [Google Scholar]
- Urquhart, J. S., Figura, C., Wyrowski, F., et al. 2019, MNRAS, 484, 4444 [Google Scholar]
- Valeille-Manet, M., Bontemps, S., Csengeri, T., et al. 2024, A&A, submitted [Google Scholar]
- van der Tak, F. F. S., van Dishoeck, E. F., Evans, II, N. J., & Blake, G. A. 2000, ApJ, 537, 283 [NASA ADS] [CrossRef] [Google Scholar]
- Vázquez-Semadeni, E., Palau, A., Ballesteros-Paredes, J., Gómez, G. C., & Zamora-Avilés, M. 2019, MNRAS, 490, 3061 [Google Scholar]
- Ward-Thompson, D., Motte, F., & Andre, P. 1999, MNRAS, 305, 143 [Google Scholar]
- Wienen, M., Wyrowski, F., Schuller, F., et al. 2012, A&A, 544, A146 [NASA ADS] [CrossRef] [EDP Sciences] [Google Scholar]
- Wilcock, L. A., Kirk, J. M., Stamatellos, D., et al. 2011, A&A, 526, A159 [NASA ADS] [CrossRef] [EDP Sciences] [Google Scholar]
- Wilcock, L. A., Ward-Thompson, D., Kirk, J. M., et al. 2012, MNRAS, 424, 716 [CrossRef] [Google Scholar]
- Ysard, N., Koehler, M., Jimenez-Serra, I., Jones, A. P., & Verstraete, L. 2019, A&A, 631, A88 [NASA ADS] [CrossRef] [EDP Sciences] [Google Scholar]
- Zucconi, A., Walmsley, C. M., & Galli, D. 2001, A&A, 376, 650 [NASA ADS] [CrossRef] [EDP Sciences] [Google Scholar]
ALMA project #2017.1.01355.L; see http://www.almaimf.com (PIs: Motte, Ginsburg, Louvet, Sanhueza).
Motte et al. (2018b) also used in the PPMAP procedure 350 and 870 μm images obtained at the APEX telescope, as done in Dell’Ova et al. (2024), and 3 mm images from the NOEMA interferometer (Louvet et al. 2014). Their angular resolution, 2″, 8″, and 18″, is intermediate between those of the ALMA and Herschel data.
The G351.77 protocluster is excluded from the present study because the quality of its CO(2–1) datacube precluded investigating outflows in this region (Cunningham et al. 2023; Valeille-Manet et al. 2024).
See documentation at https://scikit-image.org/docs/stable/auto_examples/segmentation/plot_peak_local_max.html
The protostellar cores extracted by getsf have a size of ~1.5 times the beam (e.g., Pouteau et al. 2022; Nony et al. 2023; Louvet et al. 2024). A Gaussian therefore reasonably describes their intensity distribution, which corresponds to the convolution of a barely resolved power-law with the clean beam, which is a pure 2D Gaussian.
![$\[\mathrm{FWHM}_{\text {core }}^{\mathrm{dec}}=\sqrt{\theta_{\text {core }}^{2}-\Theta_{\text {beam }}^{2}} \times d\]$](/articles/aa/full_html/2025/02/aa51931-24/aa51931-24-eq61.png) , where θcore is listed in Tables C.1–C.2 and C.6–C.7 published at the CDS, Θbeam can be found in published catalogs (Pouteau et al. 2022; Nony et al. 2023; Armante et al. 2024; Louvet et al. 2024) and d in Motte et al. (2022) (see their Table 1).
, where θcore is listed in Tables C.1–C.2 and C.6–C.7 published at the CDS, Θbeam can be found in published catalogs (Pouteau et al. 2022; Nony et al. 2023; Armante et al. 2024; Louvet et al. 2024) and d in Motte et al. (2022) (see their Table 1).
Table C.5 lists the ALMA-IMF prestellar cores more massive than 6.5 M⊙. The complete catalog of ALMA-IMF prestellar cores can be found at CDS.
All Tables
Luminosity peaks in Young and Intermediate W43 protoclusters and their association with temperature peaks and protostellar cores.
Luminosity peaks in the Evolved G012.80 protocluster and their association with temperature peaks and protostellar cores.
Luminosity and mass-averaged temperature of the protostellar cores driving the six brightest hot cores of ALMA-IMF.
Main characteristics of protostellar cores in the G012.80, W43-MM1, W43-MM2, and W43-MM3 protoclusters.
Main characteristics of the 616 prestellar cores in the ALMA-IMF protoclusters.
All Figures
|
Fig. 1 Zoom into the luminosity and temperature peaks, characterized at 2.5″, to identify their associated protostellar and prestellar cores, detected at 0.3″−0.9″ resolution. Example zoom-in regions in our test-case ALMA-IMF protoclusters (the location of zoomed images is shown in Fig. D.1): a) the Evolved G012.80/W33-Main, b) the Young W43-MM1, c) the Young W43-MM2, and d) the Intermediate W43-MM3. Red and blue contours display the PPMAP luminosity and dust temperature map values, respectively, overlaid on the 1.3 mm continuum map shown in the grayscale background. Orange ellipses outline the FWHM size of the luminosity peaks associated with at least one protostellar core (see Dell’Ova et al. 2024, and Table C.2. White ellipses and crosses locate the protostellar and prestellar cores, respectively, identified by Nony et al. (2020), Nony et al. (2023), Nony et al (in prep.), Pouteau et al. (2022), and Armante et al. (2024). A scale bar is shown in the right-hand side of each panel. Some luminosity (and temperature) peaks host two and up to four protostellar cores of 1900 au typical size (see, e.g., P1–5 in panel b and P1 and P5 in panel c). |
| In the text | |
|
Fig. 2 Temperature maps used to estimate the background-diluted temperature of cores detected in a) G012.80, b) W43-MM1, c) W43-MM2, and d) W43-MM3. These images use the corrected PPMAP images along with the original PPMAP products (which ignore the 70 μm opacity correction), revealing both heating at the location of the most luminous protostars and self-shielding toward prestellar cores and low-luminosity protostars (see Sect. 3.1, Appendix A, Fig. A.1 and Dell’Ova et al. 2024). Green and orange contours outline the H41α emission (at 25σ levels) and the 70 μm emission (at 3σ and 7σ levels), respectively. A common color bar for temperature is placed on the right-hand side of the figure and blue horizontal lines indicate the maximum temperature of each panel. Temperature peaks are indicated by blue circles, protostellar cores by white ellipses. The resolution of the ALMA H41α emission, 0.38″−2.1″, the PPMAP dust temperature image, 2.5″, and the 70 μm emission, 5.6″, are given in the lower left corner. The background-diluted core temperature in the Evolved G012.80 protocluster is globally ~4 K hotter than in the three other, Young and Intermediate, protoclusters. |
| In the text | |
|
Fig. 3 Methodology used to estimate the mass-averaged dust temperature of ALMA-IMF cores: luminous protostellar cores (left panels), low-luminosity protostellar cores (central panels), and prestellar cores (right panels). Sketch (upper panels) and radial profile (lower panels) representing the mass-averaged dust temperature of a given core, as estimated by constraints obtained outside the core and, for the luminous protostars, within the core. The absolute values of the equations, the mean |
| In the text | |
|
Fig. 4 Gaussian distribution, 𝒩(Lbol, RA, Dec, θLbol) (orange curve in the upper panel), which represents the luminosity peak P1 associated with two protostellar cores, and its intensity map (lower panel). The spatial contribution of the protostellar cores, w1 and w2, to luminosity peak P1 is assumed to be proportional to the value of the Gaussian function at the cores’ location, 𝒩1 and 𝒩2 at δ1 and δ2, respectively. The FWHM of the luminosity peak P1, θLbol, is outlined by the dashed area in the upper panel and the orange ellipse in the lower panel. Red contours separate the luminosity peak into the intensity contribution of its two host cores. |
| In the text | |
|
Fig. 5 Comparison of the two mass-averaged temperature estimates made for the 151 luminous protostellar cores of ALMA-IMF bright enough to be detected in the luminosity maps. (a) Fractional difference between estimates from the protostellar core luminosity (Col. 5 of Tables C.4 and C.8 published at the CDS) and the background-diluted temperature of cores (Col. 6 of Tables C.4 and C.8 published at the CDS). Protostellar cores in Young, Intermediate, and Evolved protoclusters are indicated by green circles, orange diamonds, and red stars, respectively. The black line shows that the median fractional difference between these two estimates is ~36%. (b) Distribution of the differences between the two temperature estimates of Cols. 5–6 in Tables C.4 and C.8 published at the CDS (blue histogram). Colored dashed lines locate the median of the differences: ~19 K in Young and Evolved protoclusters (green and red, respectively) and ~26 K in Intermediate protoclusters (orange). |
| In the text | |
|
Fig. 6 Distribution of the mass-averaged dust temperature of prestellar cores (gray histogram), low-luminosity protostellar cores (blue histogram), and luminous protostellar cores (red histogram), as defined in Sect. 2.1. Despite the different assumptions we used to compute the dust temperatures of these three groups of cores (see Sects. 4–5 and Fig. 3), there is a clear continuity between their distributions, highlighted by the cumulated histogram of all cores (black outline). |
| In the text | |
|
Fig. 7 Distribution of the mass-averaged temperature of ALMA-IMF cores (Col. 7 of Tables C.4 and C.8 published at the CDS) versus luminosity-to-mass (L/M) ratios of their protocluster (Dell’Ova et al. 2024). Neither the median temperature (large markers) measured for the cores of each protocluster nor their minimum or maximum values seem to correlate with the protocluster L/M ratio. |
| In the text | |
|
Fig. 8 Mass versus luminosity diagram of the 151 protostellar cores discovered, with detectable luminosity, in the ALMA-IMF massive protoclusters (color-filled squares, green, orange, and red for Young, Intermediate, and Evolved protoclusters) compared to reference studies of low-mass protostars (pink circles), IR-quiet high-mass protostars (cyan circles), and clumps hosting UCH II regions (red circles). The surface density of observed protostellar cores is to be compared to that predicted by a parameterized model (gray scale image), here with decreasing accretion rates and intermittent accretion (Duarte-Cabral et al. 2013). The final stellar mass of a protostar is predicted by the evolutionary tracks, for 0.08–50 M⊙ core masses, associated to this model (white curves). The yellow curve theoretically separates high-mass protostars from sources developing an H II region. Current scenario, assuming an accretion from a gas reservoir decreasing with time, does not fit the protostellar number density observed for ALMA-IMF protoclusters: protostellar cores more massive than 2 M⊙ are clustered in areas where the normalized surface density is predicted to be very low (~3 × 10⁻⁵), while only a few of these protostellar cores are found in areas where the surface density is 30 times higher. |
| In the text | |
|
Fig. A.1 Original (left) and combined (center column) dust temperature images and their subtraction (right) for the Young protocluster W43-MM1 (upper) and the Evolved protoclusters G012.80 (central row) and W51-IRS2 (lower). In the right panels, bright areas represent gas structures, whose 70 μm flux is extinguished by the protocluster high column density gas. Their temperature has been increased by the opacity-corrected procedure of PPMAP. Unresolved bright and dark sources are the luminous protostellar cores and, low-luminosity protostellar or prestellar cores, respectively. White circles mark the areas heated beyond the 2.5″ beam of PPMAP by the brightest protostars of these regions. |
| In the text | |
|
Fig. A.2 Distribution of the background-diluted dust temperature for protostellar cores, which are either luminous or are low-luminosity (red and blue histograms, respectively), and for prestellar cores (gray histogram). These temperatures, which approximate the background temperature of cores, are lower than those reported in Fig. 6 for protostellar cores and higher for prestellar cores. While the background-diluted dust temperature of low-luminosity protostars and prestellar cores span a narrow range, 20 − 40 K, the one of luminous protostars is twice larger. |
| In the text | |
|
Fig. D.1 Zoom into the luminosity and temperature peaks, characterized at 2.5″, to identify their associated protostellar and prestellar cores, detected at 0.3″−0.9″ resolution. Fourteen first panels: Location of the different zooms on the 1.3 mm image of each ALMA-IMF protocluster. Red squares outline the zooms of Fig. 1 and blue squares the complementary zooms shown here. Zoom-in of regions in ALMA-IMF protoclusters: G008.67 (two panels), G10.62 (two panels), G012.80 (five panels completing Fig. 1a), and G327.29 (three panels). Red and blue contours display the PPMAP luminosity and dust temperature map values, respectively, overlaid on the 1.3 mm continuum map shown in the grayscale background. Orange ellipses outline the FWHM size of the luminosity peaks associated with at least one protostellar core (see Dell’Ova et al. 2024, Tables C.2 and C.7 published at the CDS). White ellipses and crosses locate the protostellar and prestellar cores, respectively, identified by (Nony et al. 2020, 2023, in prep.), Pouteau et al. (2022), Armante et al. (2024), and Louvet et al. (2024). A scale bar is shown in the right-hand side of each panel. Some luminosity (and temperature) peaks host two and up to four protostellar cores of 1900 au typical size (see, e.g., P1 and P4 in G10.62). Zoom-in of regions in ALMA-IMF protoclusters: G328.25 (one panel), G333.60 (three panels), G337.92.80 (two panels), G338.93 (three panels), G353.41 (two panels), and W43-MM1 (one panel completing Fig. 1b). Some luminosity (and temperature) peaks host two and up to four protostellar cores of 1900 au typical size (see, e.g., P4 in G333.60, P2 in G337.92, and P3 and P10 in G338.93). Zoom-in of regions in ALMA-IMF protoclusters: W43-MM2 (three panels completing Fig. 1c), W43-MM3 (two panels completing Fig. 1d), W51-E (two panels), and W51-IRS2 (five panels). Some luminosity (and temperature) peaks host two and up to four protostellar cores of 1900 au typical size (see, e.g., P1 and P2 in W51-E, P1 and P2 in W51-IRS2). |
| In the text | |
|
Fig. D.2 Luminosity profiles of the four positions at 2.5" resolution encompassing the six brightest ALMA-IMF hot cores (Bonfand et al. 2024). The luminosity is azimuthally averaged at four locations encompassing these hot cores using the median in rings spaced by 1.25″ in radius from these locations. Profiles are fitted by the combination of a power-law and a Gaussian. |
| In the text | |
Current usage metrics show cumulative count of Article Views (full-text article views including HTML views, PDF and ePub downloads, according to the available data) and Abstracts Views on Vision4Press platform.
Data correspond to usage on the plateform after 2015. The current usage metrics is available 48-96 hours after online publication and is updated daily on week days.
Initial download of the metrics may take a while.