Fig. 5

Download original image
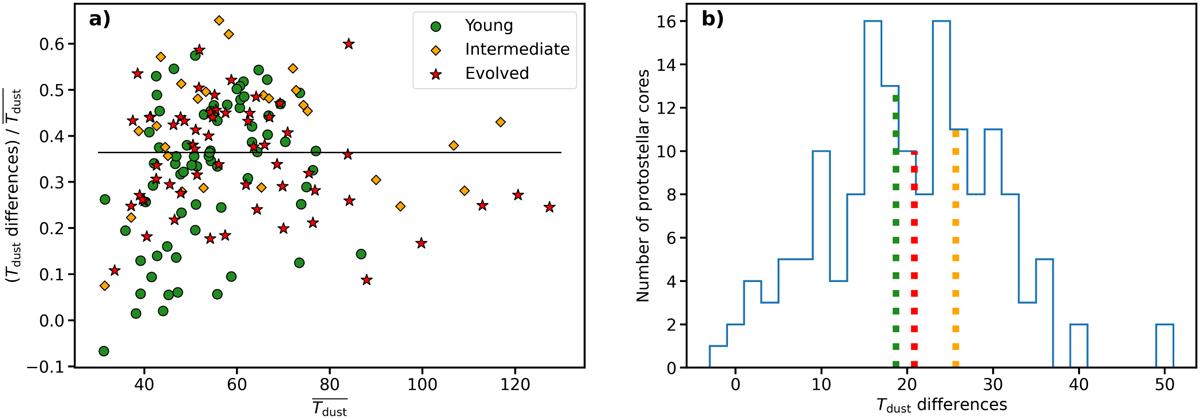
Comparison of the two mass-averaged temperature estimates made for the 151 luminous protostellar cores of ALMA-IMF bright enough to be detected in the luminosity maps. (a) Fractional difference between estimates from the protostellar core luminosity (Col. 5 of Tables C.4 and C.8 published at the CDS) and the background-diluted temperature of cores (Col. 6 of Tables C.4 and C.8 published at the CDS). Protostellar cores in Young, Intermediate, and Evolved protoclusters are indicated by green circles, orange diamonds, and red stars, respectively. The black line shows that the median fractional difference between these two estimates is ~36%. (b) Distribution of the differences between the two temperature estimates of Cols. 5–6 in Tables C.4 and C.8 published at the CDS (blue histogram). Colored dashed lines locate the median of the differences: ~19 K in Young and Evolved protoclusters (green and red, respectively) and ~26 K in Intermediate protoclusters (orange).
Current usage metrics show cumulative count of Article Views (full-text article views including HTML views, PDF and ePub downloads, according to the available data) and Abstracts Views on Vision4Press platform.
Data correspond to usage on the plateform after 2015. The current usage metrics is available 48-96 hours after online publication and is updated daily on week days.
Initial download of the metrics may take a while.


