Fig. 8
Download original image
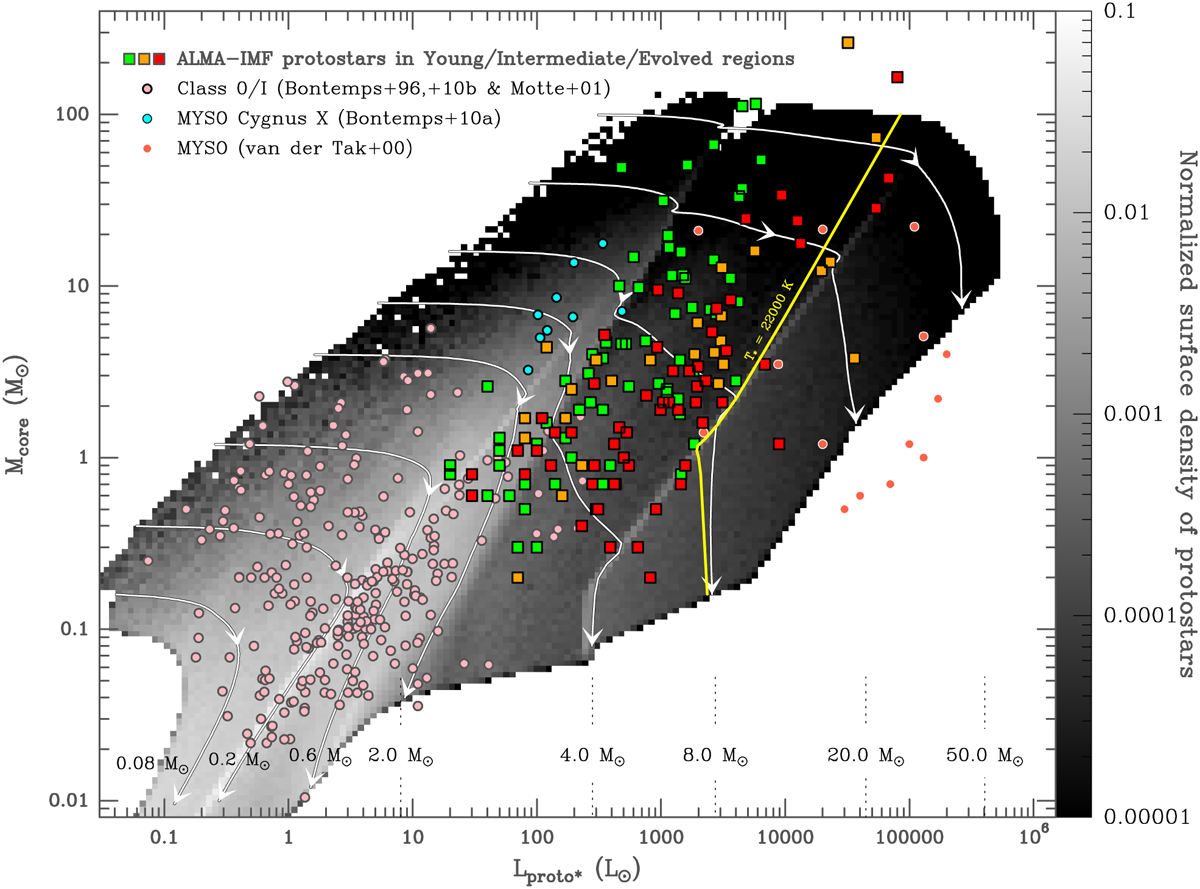
Mass versus luminosity diagram of the 151 protostellar cores discovered, with detectable luminosity, in the ALMA-IMF massive protoclusters (color-filled squares, green, orange, and red for Young, Intermediate, and Evolved protoclusters) compared to reference studies of low-mass protostars (pink circles), IR-quiet high-mass protostars (cyan circles), and clumps hosting UCH II regions (red circles). The surface density of observed protostellar cores is to be compared to that predicted by a parameterized model (gray scale image), here with decreasing accretion rates and intermittent accretion (Duarte-Cabral et al. 2013). The final stellar mass of a protostar is predicted by the evolutionary tracks, for 0.08–50 M⊙ core masses, associated to this model (white curves). The yellow curve theoretically separates high-mass protostars from sources developing an H II region. Current scenario, assuming an accretion from a gas reservoir decreasing with time, does not fit the protostellar number density observed for ALMA-IMF protoclusters: protostellar cores more massive than 2 M⊙ are clustered in areas where the normalized surface density is predicted to be very low (~3 × 10⁻⁵), while only a few of these protostellar cores are found in areas where the surface density is 30 times higher.
Current usage metrics show cumulative count of Article Views (full-text article views including HTML views, PDF and ePub downloads, according to the available data) and Abstracts Views on Vision4Press platform.
Data correspond to usage on the plateform after 2015. The current usage metrics is available 48-96 hours after online publication and is updated daily on week days.
Initial download of the metrics may take a while.