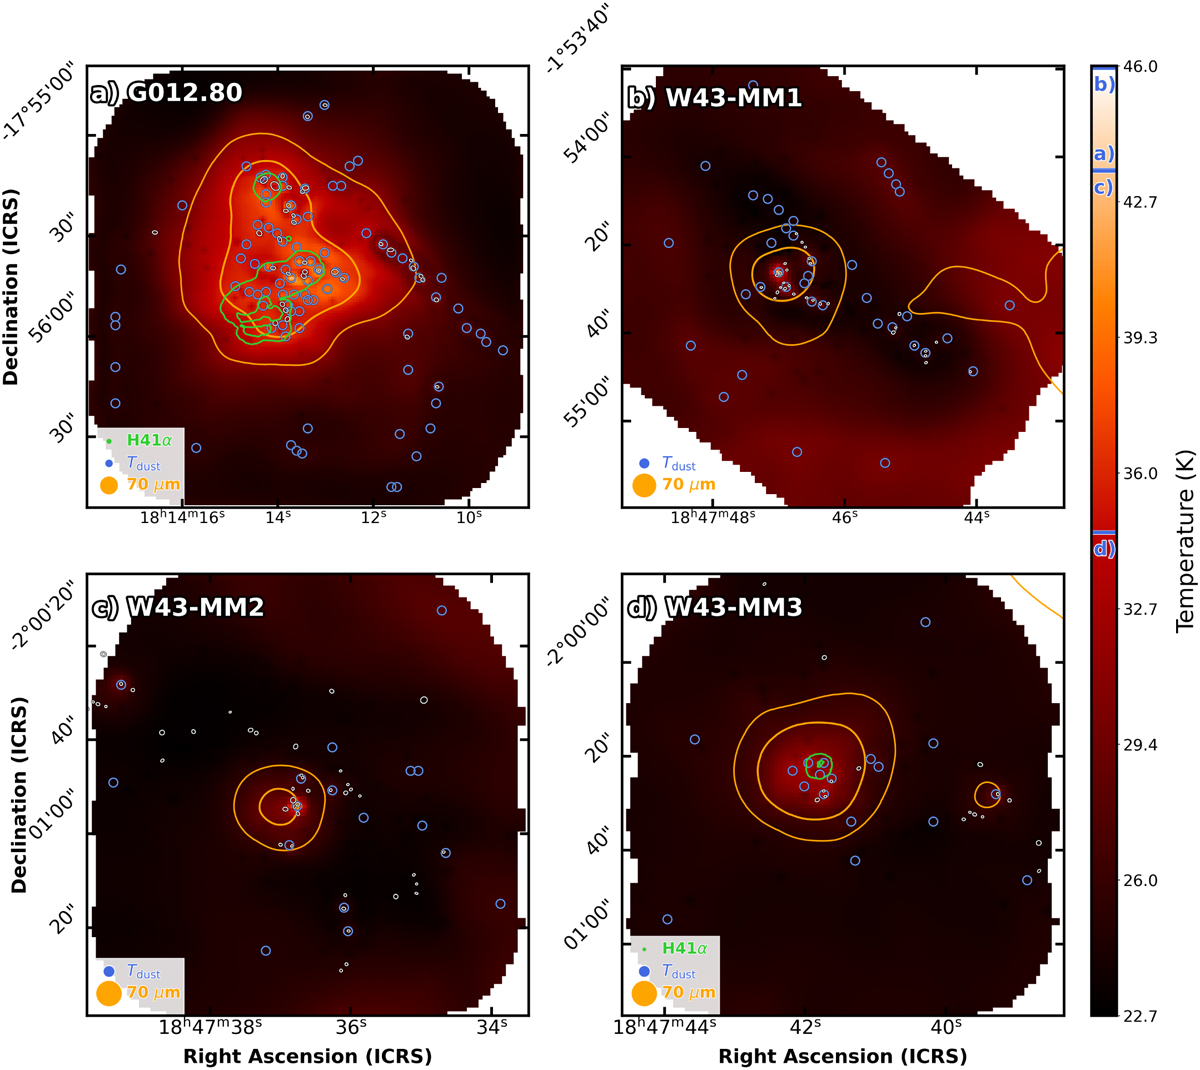
Fig. 2
Download original image
Temperature maps used to estimate the background-diluted temperature of cores detected in a) G012.80, b) W43-MM1, c) W43-MM2, and d) W43-MM3. These images use the corrected PPMAP images along with the original PPMAP products (which ignore the 70 μm opacity correction), revealing both heating at the location of the most luminous protostars and self-shielding toward prestellar cores and low-luminosity protostars (see Sect. 3.1, Appendix A, Fig. A.1 and Dell’Ova et al. 2024). Green and orange contours outline the H41α emission (at 25σ levels) and the 70 μm emission (at 3σ and 7σ levels), respectively. A common color bar for temperature is placed on the right-hand side of the figure and blue horizontal lines indicate the maximum temperature of each panel. Temperature peaks are indicated by blue circles, protostellar cores by white ellipses. The resolution of the ALMA H41α emission, 0.38″−2.1″, the PPMAP dust temperature image, 2.5″, and the 70 μm emission, 5.6″, are given in the lower left corner. The background-diluted core temperature in the Evolved G012.80 protocluster is globally ~4 K hotter than in the three other, Young and Intermediate, protoclusters.
Current usage metrics show cumulative count of Article Views (full-text article views including HTML views, PDF and ePub downloads, according to the available data) and Abstracts Views on Vision4Press platform.
Data correspond to usage on the plateform after 2015. The current usage metrics is available 48-96 hours after online publication and is updated daily on week days.
Initial download of the metrics may take a while.