Fig. D.1
Download original image
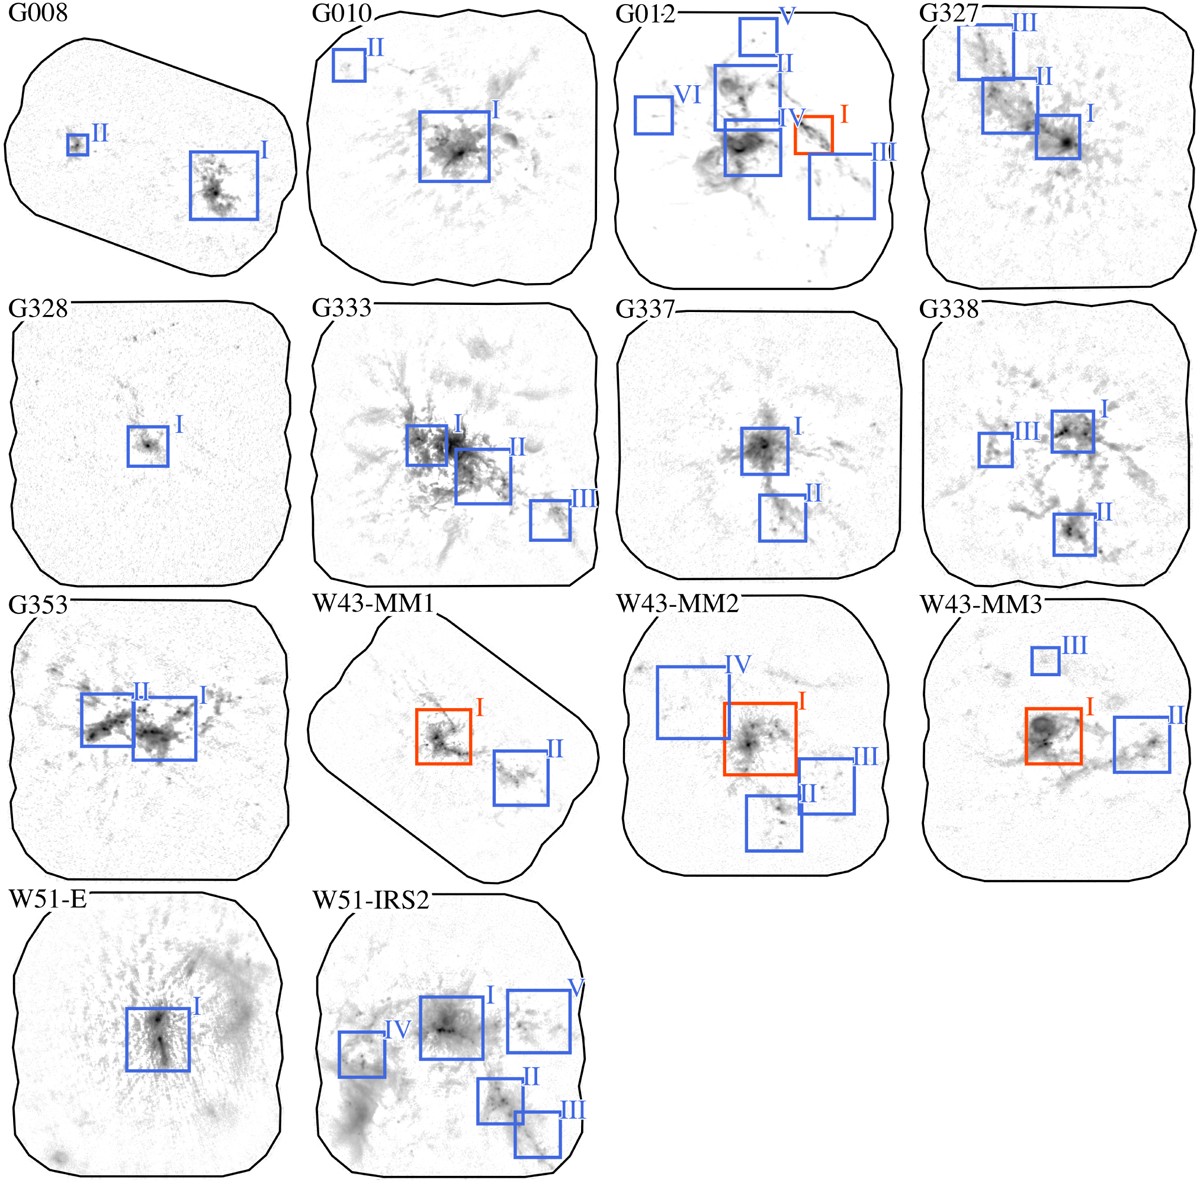
Zoom into the luminosity and temperature peaks, characterized at 2.5″, to identify their associated protostellar and prestellar cores, detected at 0.3″−0.9″ resolution. Fourteen first panels: Location of the different zooms on the 1.3 mm image of each ALMA-IMF protocluster. Red squares outline the zooms of Fig. 1 and blue squares the complementary zooms shown here.
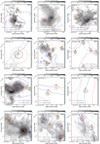
Zoom-in of regions in ALMA-IMF protoclusters: G008.67 (two panels), G10.62 (two panels), G012.80 (five panels completing Fig. 1a), and G327.29 (three panels). Red and blue contours display the PPMAP luminosity and dust temperature map values, respectively, overlaid on the 1.3 mm continuum map shown in the grayscale background. Orange ellipses outline the FWHM size of the luminosity peaks associated with at least one protostellar core (see Dell’Ova et al. 2024, Tables C.2 and C.7 published at the CDS). White ellipses and crosses locate the protostellar and prestellar cores, respectively, identified by (Nony et al. 2020, 2023, in prep.), Pouteau et al. (2022), Armante et al. (2024), and Louvet et al. (2024). A scale bar is shown in the right-hand side of each panel. Some luminosity (and temperature) peaks host two and up to four protostellar cores of 1900 au typical size (see, e.g., P1 and P4 in G10.62).
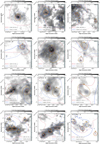
Zoom-in of regions in ALMA-IMF protoclusters: G328.25 (one panel), G333.60 (three panels), G337.92.80 (two panels), G338.93 (three panels), G353.41 (two panels), and W43-MM1 (one panel completing Fig. 1b). Some luminosity (and temperature) peaks host two and up to four protostellar cores of 1900 au typical size (see, e.g., P4 in G333.60, P2 in G337.92, and P3 and P10 in G338.93).
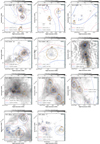
Zoom-in of regions in ALMA-IMF protoclusters: W43-MM2 (three panels completing Fig. 1c), W43-MM3 (two panels completing Fig. 1d), W51-E (two panels), and W51-IRS2 (five panels). Some luminosity (and temperature) peaks host two and up to four protostellar cores of 1900 au typical size (see, e.g., P1 and P2 in W51-E, P1 and P2 in W51-IRS2).
Current usage metrics show cumulative count of Article Views (full-text article views including HTML views, PDF and ePub downloads, according to the available data) and Abstracts Views on Vision4Press platform.
Data correspond to usage on the plateform after 2015. The current usage metrics is available 48-96 hours after online publication and is updated daily on week days.
Initial download of the metrics may take a while.