Fig. 3
Download original image
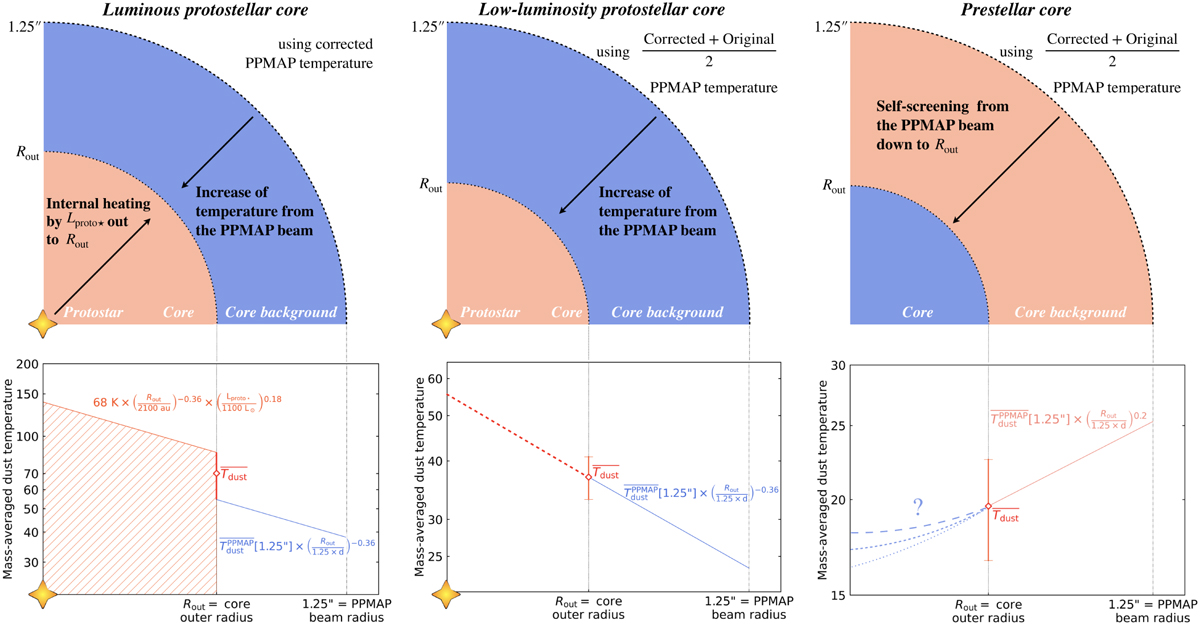
Methodology used to estimate the mass-averaged dust temperature of ALMA-IMF cores: luminous protostellar cores (left panels), low-luminosity protostellar cores (central panels), and prestellar cores (right panels). Sketch (upper panels) and radial profile (lower panels) representing the mass-averaged dust temperature of a given core, as estimated by constraints obtained outside the core and, for the luminous protostars, within the core. The absolute values of the equations, the mean ![]() , and its uncertainty that are used for illustration are those computed for three cores of the W43-MM1 protocluster: core #1 for luminous protostars, core #26 for low-luminosity protostars, and core #6 for prestellar cores. In the left panels, for luminous protostellar cores, the mass-averaged dust temperature was computed with two approaches. The temperature was first measured in PPMAP images at a radius of 1.25″ and extrapolated within the PPMAP beam to the outer radius of the core, Rout (blue area and blue equation). Its value at Rout was also computed from the internal heating of the protostar with a luminosity of Lproto⋆ (orange area and orange equation). In the central panel, for low-luminosity protostellar cores, the mass-averaged dust temperature measured in PPMAP images at a radius of 1.25″ is extrapolated within the PPMAP beam to the outer radius of the core, Rout (blue area and blue equation). In the right panels, for prestellar cores, the mass-averaged dust temperature measured in PPMAP images at a radius of 1.25″ is extrapolated within the PPMAP beam to the outer radius of the core, Rout (orange area and orange equation). The mathematical relationships describing the mass-averaged temperature expected for the inner parts of low-luminosity protostellar cores and prestellar cores are not used in the present study.
, and its uncertainty that are used for illustration are those computed for three cores of the W43-MM1 protocluster: core #1 for luminous protostars, core #26 for low-luminosity protostars, and core #6 for prestellar cores. In the left panels, for luminous protostellar cores, the mass-averaged dust temperature was computed with two approaches. The temperature was first measured in PPMAP images at a radius of 1.25″ and extrapolated within the PPMAP beam to the outer radius of the core, Rout (blue area and blue equation). Its value at Rout was also computed from the internal heating of the protostar with a luminosity of Lproto⋆ (orange area and orange equation). In the central panel, for low-luminosity protostellar cores, the mass-averaged dust temperature measured in PPMAP images at a radius of 1.25″ is extrapolated within the PPMAP beam to the outer radius of the core, Rout (blue area and blue equation). In the right panels, for prestellar cores, the mass-averaged dust temperature measured in PPMAP images at a radius of 1.25″ is extrapolated within the PPMAP beam to the outer radius of the core, Rout (orange area and orange equation). The mathematical relationships describing the mass-averaged temperature expected for the inner parts of low-luminosity protostellar cores and prestellar cores are not used in the present study.
Current usage metrics show cumulative count of Article Views (full-text article views including HTML views, PDF and ePub downloads, according to the available data) and Abstracts Views on Vision4Press platform.
Data correspond to usage on the plateform after 2015. The current usage metrics is available 48-96 hours after online publication and is updated daily on week days.
Initial download of the metrics may take a while.