Fig. 4
Download original image
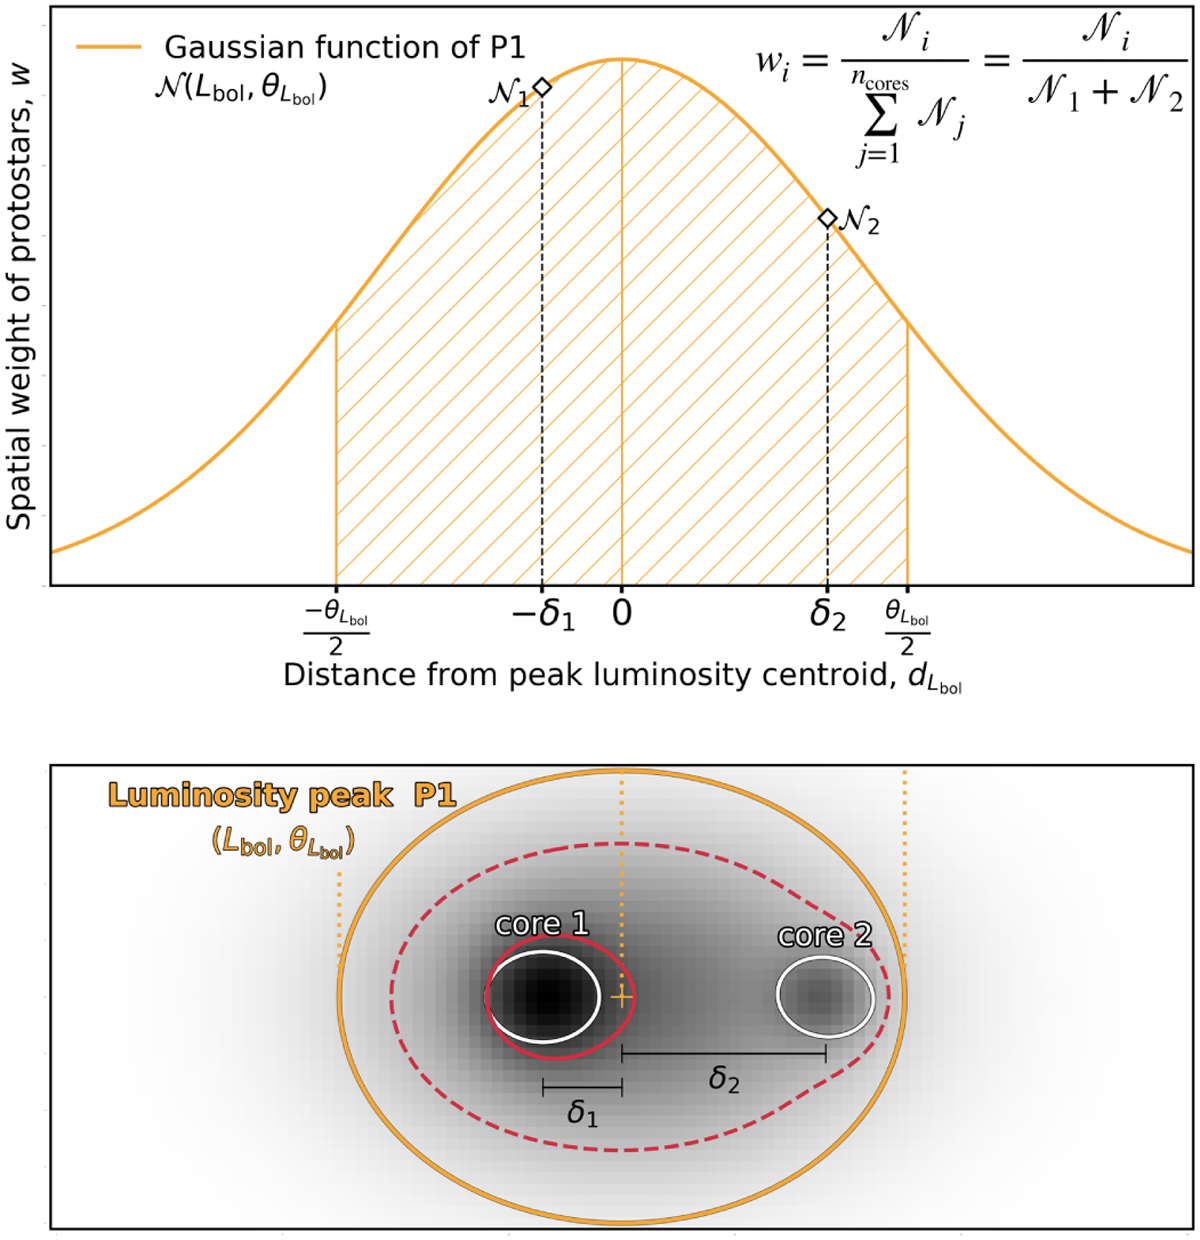
Gaussian distribution, 𝒩(Lbol, RA, Dec, θLbol) (orange curve in the upper panel), which represents the luminosity peak P1 associated with two protostellar cores, and its intensity map (lower panel). The spatial contribution of the protostellar cores, w1 and w2, to luminosity peak P1 is assumed to be proportional to the value of the Gaussian function at the cores’ location, 𝒩1 and 𝒩2 at δ1 and δ2, respectively. The FWHM of the luminosity peak P1, θLbol, is outlined by the dashed area in the upper panel and the orange ellipse in the lower panel. Red contours separate the luminosity peak into the intensity contribution of its two host cores.
Current usage metrics show cumulative count of Article Views (full-text article views including HTML views, PDF and ePub downloads, according to the available data) and Abstracts Views on Vision4Press platform.
Data correspond to usage on the plateform after 2015. The current usage metrics is available 48-96 hours after online publication and is updated daily on week days.
Initial download of the metrics may take a while.