| Issue |
A&A
Volume 688, August 2024
|
|
|---|---|---|
| Article Number | A187 | |
| Number of page(s) | 43 | |
| Section | Catalogs and data | |
| DOI | https://doi.org/10.1051/0004-6361/202449427 | |
| Published online | 21 August 2024 | |
MCXC-II: Second release of the Meta-Catalogue of X-ray detected Clusters of galaxies★
1
Université Paris-Saclay, Université Paris Cité, CEA, CNRS, AIM,
91191,
Gif-sur-Yvette,
France
e-mail: tatyana.sadibekova@cea.fr
2
Observatorio Astronómico Nacional, IGN,
Calle Alfonso XII 3,
28014
Madrid,
Spain
3
Université Paris-Saclay, CEA, Département de Physique des Particules,
91191
Gif-sur-Yvette,
France
Received:
30
January
2024
Accepted:
10
April
2024
We present the second release of the Meta-catalogue of X-ray detected Clusters of galaxies (hereafter MCXC-II). MCXC-II has been compiled from publicly available ROSAT All Sky Survey-based (NORAS, REFLEX, BCS, SGP, NEP, MACS, CIZA, and RXGCC) and serendipitous (160SD, 400SD, SHARC, WARPS, and EMSS) X-ray cluster catalogues. Redshifts were systematically checked and updated when necessary, with additional redshift information (type and origin) added. The X-ray data were standardised to an overdensity of 500, using a new procedure based on the use of the original flux and aperture measurements available in the input catalogues. MCXC-II contains 2221 entries, now including objects from the REFLEX-II and RXGCC surveys, in addition to providing a complete and fully-homogenised sub-catalogue of all published MACS clusters. Duplicate entries from overlaps between the survey areas of the individual input catalogues were carefully handled. For each cluster, the MCXC-II provides three identifiers: redshift, coordinates, and membership in the original catalogue, along with standardised [0.1–2.4] keV band luminosity, L500, total mass, M500, and radius, R500. Uncertainties on L500 were computed from the flux errors in the original catalogues. MCXC-II additionally provides information on overlaps between the input catalogues, reporting the luminosity and its uncertainty when measurements from different surveys are available, along with notes on individual objects.
Key words: catalogs / surveys / galaxies: clusters: general / galaxies: distances and redshifts / X-rays: galaxies: clusters
Catalog MCXC-II is available at the CDS via anonymous ftp to cdsarc.cds.unistra.fr (130.79.128.5) or via https://cdsarc.cds.unistra.fr/viz-bin/cat/J/A+A/688/A187
© The Authors 2024
 Open Access article, published by EDP Sciences, under the terms of the Creative Commons Attribution License (https://creativecommons.org/licenses/by/4.0), which permits unrestricted use, distribution, and reproduction in any medium, provided the original work is properly cited.
This article is published in open access under the Subscribe to Open model. Subscribe to A&A to support open access publication.
1 Introduction
As the nodes of the cosmic web, clusters of galaxies provide information on the assembly and evolution of large-scale structure and on the underlying cosmology hosting these processes. Emitting in X-rays through bremsstrahlung emission of the hot, gaseous intra-cluster medium (ICM), cluster sources have been apparent in the early all-sky X-ray surveys by Uhuru, HEAO-1, and Ariel-V. The launch of Einstein, the first X-ray satellite with imaging capability, allowed for the detection of previously unknown clusters from their X-ray emission (Gioia & Luppino 1994). The advent of the Röntgen SATelleit (ROSAT) and its associated all-sky survey (RASS) in 1990–1991 led to the discovery of hundreds of clusters, with several hundred more found serendipitously in the later pointed observation phase (see references in Sect. 2.1).
The cluster catalogues extracted from the RASS and the ROSAT pointed observation phase have provided the targets for deeper follow-up observations with the subsequent generation of satellites XMM-Newton, Chandra and Suzaku, and for identification of existing clusters in surveys in other wavelengths. However, the different conventions employed in the construction of these catalogues (e.g., cosmology, integration radius etc.), have made it difficult to standardise the information contained within.
In this context, the first Meta-Catalogue of X-ray detected Clusters of galaxies (hereafter MCXC-I) was published by Piffaretti et al. (2011). As a meta-catalogue, the purpose of the MCXC-I was to assemble the information on X-ray clusters from published samples based on ROSAT and Einstein cluster detections and (critically) to homogenise the primary catalogue measurement: the X-ray luminosity, LX. Measurements from all major publicly-available X-ray catalogues were standardised to the same cosmology and integration radius, using an approach based on use of the [0.1–2.4] keV X-ray luminosity as a mass proxy. Using an empirically-measured average profile and a scaling law relating the X-ray luminosity to the underlying mass, all luminosity measurements were standardised to an integration radius of R5001. MCXC-I additionally furnished information on overlaps between the input catalogues, gave the luminosity ratios when measurements from different surveys were available, and provided notes on individual objects.
The majority of the catalogues in MCXC-I were based on X-ray detections of extended sources, either in the original RASS or in deeper observations from the subsequent pointed phase. The advantage of such an approach is that the selection function is purely based on the X-ray characteristics of the sources in the catalogue. The exceptions were the Einstein Extended Medium Sensitivity Survey (Gioia et al. 1990, EMSS), for which optical spectroscopic follow-up of all 835 sources was tractable, and the Massive Cluster Survey (Ebeling et al. 2001, MACS), for which flux cuts and hardness ratio criteria were applied to the ROSAT Bright Source Catalogue before systematic optical spectroscopic follow-up was undertaken. Such approaches are obviously very costly in terms of the observing time needed to complete the optical spectroscopic follow-up and are intractable once the number of sources needing follow-up crosses a given threshold.
Since the release of MCXC-I, the advent of large-scale multiband optical surveys and the subsequent widespread adoption of photometric redshifts has changed the X-ray cluster survey landscape. Examples of catalogues derived from such approaches include MARD-Y3 (Klein et al. 2019), CODEX (Finoguenov et al. 2020), and RASS-MCMF (Klein et al. 2023). Moreover, cluster detection using joint information from X-rays and SZ surveys has also been developed and applied to ROSAT and Planck data, yielding the COMPRASS catalogue (Tarrío et al. 2019). While such approaches have yielded large numbers of new cluster detections, the resulting selection functions depend not only on the X-ray properties of the sources but also on their optical characteristics.
This second release2 of the MCXC (hereafter MCXC-II) now includes objects from the REFLEX II (Chon & Böhringer 2012) and RXGCC (Xu et al. 2022) surveys, where the cluster detection is based on measurements of X-ray source flux and extent. MCXC-II also provides a complete and fully homogenised subcatalogue of all published Massive Cluster Survey (MACS) clusters. Furthermore, MCXC-II revisits and substantially revises the original approach to L500 homogenisation. This is achieved by recalculating the L500 values from the original X-ray flux or count rate measurements where available in the original source catalogues. This approach notably allows us to include uncertainties in the luminosity measurements, which were not available for the MCXC-I release. As a further addition to the catalogue, we provide a new flag on the provenance and nature of the redshift measurement for each system. We leave the issue of the homogenisation of catalogues that make use of large-scale multi-band optical surveys to future work.
The paper is organised as follows. Section 2 describes the new entries, including the search for new redshifts, updates on the overlap and revised merging strategy and Sect. 3 presents the redshift revision. The estimate of L500 and M500 and statistical errors is detailed in Sect. 4. Section 5 present the properties of MCXC-II. In Sect. 6, we discuss the differences between MCXCII and MCXC-I, as well as systematic errors and the general issue of homogenisation of catalogues. Section 7 presents our conclusions.
We adopt a ΛCDM cosmology with H0 = 70 km s−1 Mpc−1, Ωm = 0.3 and ΩΛ = 0.7 throughout the paper. The quantity E(𝓏) is the ratio of the Hubble constant at redshift 𝓏 to its present value, H0, namely, E(𝓏)2 = Ωm(1 + 𝓏)3 + ΩΛ.
2 MCXC-II content
In this section, we describe the addition of new clusters to MCXC-II and how the information on the cross-matching between catalogues was updated. Before describing the second release, we give a brief overview of the content of the MCXC-I that stands as our point of departure.
2.1 Overview of first release
The MCXC-I catalogue of Piffaretti et al. (2011) consists of 1743 entries. These data were compiled from 16 publicly available X-ray catalogues derived primarily from ROSAT observations. The exceptions are the Einstein based EMSS catalogue, for which the X-ray quantities for part of the sample were obtained from ASCA follow-up observations, and the RASS-derived MACS catalogue, where the X-ray quantities were obtained from Chandra follow-up observations.
The simplest classification scheme for these input catalogues is into contiguous area (i.e. RASS-survey) and serendipitous (i.e. pointed) sub-catalogues, as follows:
RASS-based catalogues: the ROSAT-ESO Flux Limited X-ray galaxy cluster survey (REFLEX; Böhringer et al. 2004); the Northern ROSAT All-Sky galaxy cluster survey (NORAS; Böhringer et al. 2000); the Clusters In the Zone of Avoidance survey (CIZA and CIZA II; Ebeling et al. 2002; Kocevski et al. 2007); the ROSAT Brightest Cluster Sample and extended Brightest Cluster Sample (BCS and eBCS; Ebeling et al. 1998, 2000); the South Galactic Pole survey (SGP; Cruddace et al. 2002); the Massive Cluster Survey (MACS; Ebeling et al. 2007; Maughan et al. 2008; Ebeling et al. 2010); and the North Ecliptic Pole survey (NEP; Henry et al. 2006).
Serendipitous catalogues: the 160 Square Degree survey (160SD Mullis et al. 2003); the 400 Square Degree survey (400SD Burenin et al. 2007); the Wide-Angle ROSAT Pointed Survey (WARPS and WARPS II; Perlman et al. 2002; Horner et al. 2008); the Einstein Observatory Extended Medium Sensitivity Survey (EMSS; Gioia & Luppino 1994; Henry 2004); the Bright Serendipitous High-Redshift Archival ROSAT Cluster survey (SHARC BRIGHT Romer et al. 2000; Burke et al. 2003); and Southern SHARC survey (SHARC SOUTH Burke et al. 2003).
Piffaretti et al. (2011) first merged surveys with identical data types into a single catalogue, considering each original survey as a sub-catalogue. This concerns BCS, CIZA, and WARPS, which were merged with their lower-flux extensions eBCS, CIZA-II and WARPS-II, respectively. Similarly, REFLEX and NORAS were merged into a single NORAS/REFLEX catalogue. SHARC SOUTH and SHARC BRIGHT were added to the NORAS/REFLEX catalogue as the respective surveys only differ in their flux limit and sky area. For the very few clusters in common between sub-catalogues (e.g. owing to small region overlaps), the most optimal measurement was kept.
Piffaretti et al. (2011) then carefully identified clusters appearing in several catalogues and defined a priority order to determine the catalogue to be used as the primary input source. This priority is based principally on catalogue size and the availability of an aperture luminosity (see Sect. 2.5 for further details). Unless otherwise stated in very specific cases, in the present work we retain the catalogue priority defined for the MCXC-I. We refer to this primary source catalogue simply as the cluster catalogue (or sub-catalogue). As in Piffaretti et al. (2011), we will use the term ‘overlap’ to refer to the catalogues, corresponding sources, and/or derived properties that are not derived from the primary source catalogue.
For each cluster, MCXC-I provides a name, coordinates, red-shift, standardised [0.1–2.4] keV band luminosity, L500, total mass, M500, and radius, R500, calculated in each case using the luminosity from the source catalogue. MCXC-I additionally furnishes information on overlaps between the input catalogues and the luminosity ratios when measurements from different surveys were available. The MCXC-I release is available online from CDS/VizieR3 and NED4 servers.
2.2 New entries from original MCXC-I source catalogues
When constructing MCXC-I, Piffaretti et al. (2011) only considered objects with a measured redshift and luminosity. They also removed clusters identified as false or likely false in the input source catalogues. We first revised this information using literature and galaxy surveys, particularly the SDSS DR175, 2dF6, and 6dF7 surveys. This revision concerns four catalogues: SGP, NORAS, WARPS, and 160SD. NORAS, SGP, and WARPS were the three MCXC-I input catalogues that do not include full validation and/or redshift information, derived either from literature searches or dedicated optical follow-up studies. The 160SD catalogue includes some candidates with probable false status, which can now be changed to bona fide clusters.
2.2.1 NORAS clusters
The NORAS catalogue (Böhringer et al. 2000, Table 7) includes 27 sources without redshift: nine candidates from the nominal cluster detection in RASS (their Table 1), one being identified as the Abell cluster Abell 2302 without a redshift at the time of publication, and 18 RASS detections at the positions of known Abell clusters (their Table 7). We searched for new counterparts and redshifts by combining information from several sources.
-
NED database search:
By Name on the Abell clusters;
In refcode mode on the NORAS publication. This provides the NED cross-identification of the NORAS clusters with other objects in the literature, and the corresponding redshift measurements when available;
Within 5′of the NORAS position. This reveals possible counterparts missed by the NED cross-identification algorithm. This proved to be essential because NED missed most of the cross-matches between the NORAS and SDSS-based cluster catalogues.
-
Complementary cross-match with optical and SZ catalogues. Although in principle redundant with the NED positional search, this directly provides useful information on the potential counterpart (such as on source redshift or mass proxies).
SZ detected clusters: we used the meta-catalogue of SZ clusters MCSZ (Tarrío et al., in prep.) which includes Planck, ACT and SPT clusters, with a compilation of new redshifts from published Planck cluster optical follow-up, not all of which was included in NED.
The updated versions of the redMaPPer (RM) catalogue based on SDSS DR8 and DES verification data (Rykoff et al. 2016), as well as the WHL12 catalogue (Wen et al. 2012), updated by Wen & Han (2015) using SDSS-DR12 data. When a cluster counterpart appeared in both WHL and RM catalogues with a spectroscopic redshift, we adopted the WHL value, which is based on more recent SDSS data and is computed from the mean of spec-troscopic members (including the BCG), while the RM spectroscopic redshift value is that of the central galaxy only.
We were able to revise the validation or provide a redshift for 26 of the 27 sources, largely owing to the broad overlap between the NORAS and SDSS (and BOSS) footprints and the existence of SZ surveys:
Twenty-one clusters have new redshifts. All but three of these come from cross-identification with optical clusters from SDSS-based catalogues, redMaPPer (Rykoff et al. 2016) and/or WHL (Wen & Han 2015), and/or with SZ clusters with redshifts from the PSZ or ACT catalogues (Planck Collaboration XXVII 2016; Hilton et al. 2021). Except for five clusters, the distance between the NORAS source and its counterpart is smaller than both 2′ and 0.36θ500, with a median distance of 1.03′ and 0.17θ500. Taking into account the RASS resolution (1.5′ half power radius) and the possibility of an offset between the X-ray and the optical/SZ centre, this confirms the cross-identification, as well as the high richness of the optical clusters (e.g. median richness RL,500 = 65 for the optical clusters from Wen & Han 2015, where RL,500 is defined from the total r-band luminosity within R500). The five clusters with the largest counterpart distances are discussed individually in Appendix A.1.1.
When the redshift of the identified SDSS cluster counterpart was photometric or based only on a single galaxy spectrum, we used SDSS-DR17 to refine the redshift estimate. We looked for galaxies with 𝓏spec around the estimated 𝓏 and within θ500 of the optical centre. The refined redshift, derived from the biweight mean estimate (Beers et al. 1990), and the number of galaxies used for redshift estimate, Nz is given in Table 1. For RM clusters with 𝓏spec from the central galaxy, a new redshift is only given if Nz ≥ 5. Detailed information, including notes on some clusters, are given in Table 1.
Three NORAS clusters are in fact eBCS clusters, which are included in MCXC-I (MCXC J0906.4+1020, MCXC J0448.2+0953 and MCXC J1323.5+1117). Piffaretti et al. (2011) performed the cross-identification after removing objects without redshift in the source catalogues, which could not be entered in the overlap information owing to the lack of luminosity measurement.
Two NORAS sources, RX J0910.0+3533 and RXCJ0913.5+8133, are identified in NED with a star and a QSO, respectively. These are targeted NORAS detections towards the Abell clusters Abell 0752 and Abell 0723. The separation between the X-ray and Abell position is large, at 7.8′ and 6.7′ respectively, while the objects in question have a very low extent probability parameter. Thus further supports our conclusion that the counterparts are in fact false cluster detections.
In summary, 24 sources were found to be bona fide clusters with redshifts and 2 turned out to be false candidates. We failed to find a clear counterpart for the last object, RXC J2035.7+0046. The nearest NED counterpart, 3.4′ away, is a poor WHL group at 𝓏 = 0.22.
2.2.2 SGP clusters
The SGP catalogues, obtained from RASS data in the South Galactic Pole region, include 29 sources without redshift, of which 11 objects were identified with Abell clusters. One SGP object, RXC J0152.5–2853, is in fact a MACS cluster, which was included in MCXC-I. This was missed by Piffaretti et al. (2011), because the cross-identification was performed after removing this object without redshift from the SGP catalogue.
For the other objects, we performed a counterpart and red-shift search identical to that for the NORAS clusters described above. The main difference with the SGP catalogue is that the overlap with SDSS is much smaller than for NORAS; however, this is partially compensated for by coverage with the 2dF and 6dF southern optical surveys and the SPT SZ survey. However, the SGP survey is deeper than NORAS and the identification is more difficult, in particular for low-mass objects at low redshift.
As detailed in Table 1, 18 clusters now have a redshift derived from the literature. These include: four Abell clusters with redshift available from 2dF data; six objects cross-identified with SZ clusters; one MACS cluster (not included as such in MCXC-II as no X-ray flux was published); four objects cross-identified with WHL or RM clusters; and three with optical local groups.
For most of the objects, the association is obvious in view of the small separation distance (D < 2′ or < 0.3 θ500) and the estimated mass of the counterpart. However, the cross-identification of four SGP objects required deeper individual studies, in view of their larger separation distances and/or the low mass of the potential counterpart. The new counterparts include the association of MCXC J0012.9–0853 with the ACT cluster ACT-CL J0012.8–0855 at D = 4′, the confirmation of the identification of MCXC J2355.1–2834 with Abell4054 (D = 0.5 θ500), and the cross-match of MCXC J0229.9–1316 and MCXCJ2356.0–0129 with local [DZ2015] compact groups. In the first and last cases, there is clear contamination from pointlike emission. These four clusters are discussed individually in Appendix A.1.2.
Summary of new MCXC-II clusters from the NORAS and SGP catalogues, with newly identified redshifts.
2.2.3 WARPS clusters
Five WARPS-I sources were not included in MCXC-I, owing to a lack of redshift and/or luminosity information. These are additional clusters and candidates which do not belong to the statistically complete, flux-limited, WARPS sample (Perlman et al. 2002, Table 5):
Two low-flux detections, WARP J0236.0–5224 and WARP J0255.3+0004, were without redshift, the optical follow-up having not been completed. WARP J0236.0–5224 was associated with the 160SD cluster [VMF98] 027 by Perlman et al. (2002, Table 5), but was flagged as a false candidate by Vikhlinin et al. (1998) and Mullis et al. (2003). We found that this source is in fact the distant cluster X-CLASS 0418, at 𝓏 = 0.59, re-discovered in the XXMM-Newton serendipitous survey by Ridl et al. (2017). WARP J0255.3+0004 is in the SDSS footprint, but we were unable to find any obvious counterpart.
WARP J1407.6+3415 and WARP J2320.7+1659 do not have a published luminosity. WARP J2320.7+1659 is a cluster at 𝓏 = 0.499 contaminated by an AGN point source at 𝓏 = 1.8. Concerning WARP J1407.6+3415, Perlman et al. (2002) discussed the low quality of its redshift estimate (z = 0.577), and the possibility of AGN contamination. The Chandra archive image clearly shows extended emission; however, there is no obvious AGN contamination, while SDSS-DR17 spectroscopic data confirm the redshift measurement. A galaxy with 𝓏spec = 0.5805, is located at the Chandra X-ray peak, likely the BCG. We found another galaxy with 𝓏spec = 0.5748 at ~0.5 θ500. Both clusters are now included in MCXC-II, with a luminosity estimated from the flux (see Sect. 4.1). The redshift of WARP J1407.6+3415 is set to 𝓏spec = 0.5805, and a note on the point source contamination was added for WARP J2320.7+1659.
WARP J1515.5+4346 has neither a published luminosity nor a flux measurement, the identification of the source being uncertain. Perlman et al. (2002) discuss two possible redshifts for the counterpart, 𝓏 = 0.136 and 𝓏 = 0.237. However, they mis-identified the source with the 160SD cluster [VMF98] 169 (MCXC J1515.6+4350), 4′ to the North, at 𝓏 = 0.243 (Mullis et al. 2003). WARP J1515.5+4346 in fact coincides with [VMF98] 168 (MCXC 1515.5+4346, 𝓏 = 0.137), located 20″ away. Sohn et al. (2018) also detected a clear overdensity at that location and redshift in the HectoMAP Cluster Survey (HMxcl151550.0+434556)8. We could not compute a luminosity for this WARP detection, since its flux was not published, but the object is now included in the overlap information for MCXC 1515.5+4346.
In summary, all WARPS-I are included in MCXC-II, with the exception of WARP J0255.3+0004.
Finally, there is some ambiguity associated with the WARP-II double-peaked source, WARPS J1419.9+0634. Horner et al. (2008) cross-identified the source with the 160SD cluster RX J1419.9+0634 ([VMF98] 162), at 𝓏= 0.549 (Mullis et al. 2003). From their optical follow-up, they split the source into two clusters, WARPS J1419.9+0634W at 𝓏 = 0.5641 and WARPS J1419.9+0634E at 𝓏 = 0.5740. MCXC J1419.8+0634 in the MCXC catalogue (Piffaretti et al. 2011) corresponds to WARPS J1419.9+0634W, with [VMF98] 162 as overlap. It is unclear whether there are two separate clusters (likely in the process of merging, given their similar redshift), or whether WARPS J1419.9+0634 is a single bimodal (post-merger) cluster. For completeness, we added WARPS J1419.9+0634 E as MCXC J1419.9+0634 to the MCXC-II catalogue.
2.2.4 Update of 160SD cluster status
The 160SD catalogue includes 22 objects flagged as likely false detections, and one source with no follow-up as it is obscured by Arcturus. Some of these sources could be bona fide, likely distant, clusters. A NED search on the source name9 indicates that four sources are indeed 𝓏 > 0.5 clusters:
RXJ0236.0–5225 ([VMF98] 027) is an X-CLASS cluster at 𝓏 = 0.59, re-discovered serendipitiously in XMM-Newton observations by Ridl et al. (2017).
Two objects, RXJ1418.7+0644 ([VMF98] 160) and RXJ2004.8–5603 ([VMF98] 197) coincide with SZ clusters at 𝓏 = 0.673 and 𝓏 = 0.761, respectively, from the ACT survey (Hilton et al. 2021). The latter was originally considered by Vikhlinin et al. (1998) to be a cluster at 𝓏phot = 0.7.
RXJ0831.2+4905 ([VMF98]054) matches with the rich (λ = 47) redMaPPer cluster RM J083112.0+490455.2 at 𝓏phot = 0.52 (Rykoff et al. 2016). We used DSS-DR17 spectroscopic data to refine the redshift of this object.
The small distance between the ROSAT position and the SZ or optical counterpart, [0.1–0.3] θ500 (Table 2), and the consistency of the mass proxy estimates support the above associations.
The case of a fifth source, RX J0953.5+4758 ([VMF98] 078) is less clear. It is cross-identified by NED with PDCS 040, a poor (richness class 0 according to the classification proposed by Abell 1958) cluster at 𝓏 = 0.203 from the Palomar Distant Cluster Survey (Holden et al. 1999). It may be surprising that a counterpart at such a redshift was not identified in the 160SD follow-up. However, the derived X-ray mass is consistently low: M500 = 7 × 10¹³ M⊙ for 𝓏 = 0.203, that is, a group-scale object. The distance between the optical and X-ray centres is 0.9′. Although larger than for the other clusters, this distance is still much less than ~0.3 θ500, with all five spectroscopic galaxy members lying within θ500. We therefore added this cluster to MCXC-II, adding a note on a possible chance association. A search for possible counterparts around the X-ray position for 160SD sources flagged as likely false did not reveal any other firm confirmation.
Burenin et al. (2007) further flagged four 160SD clusters from their optical follow-up of the 400SD survey as likely false. This was further supported by high-resolution Chandra observations of one of the sources, [VMF98] 167 or MCXCJ1500.8+2244, which shows a superposition of point sources without extended emission. The source is removed from MCXC-II.
In summary, five new 160SD clusters are included in MCXC-II (see Table 2), and one is removed.
Summary of new MCXC-II clusters from the 160SD catalogue (Vikhlinin et al. 1998; Mullis et al. 2003), previously classified as likely false.
2.3 Duplicate objects
Piffaretti et al. (2011) identified objects that appeared in different catalogues based on angular separation distance, redshift, and examination of RASS and pointed ROSAT observations (see their Sect. 4). Their approach was conservative, meaning that they did not remove any cluster if the association was not certain.
Defining a duplicate as the cross-identification of two MCXC-I clusters as the same object, NED identifies four cases, and Simbad identifies one duplicate more. We reviewed these cases and systematically searched for other duplicates. The angular separation distance of the same object detected in two surveys may be not only depend on the angular resolution of the survey, but also on object size (the centre determination depends on the detection method, particularly for complex morphologies). Therefore, we used the distance, D, of each cluster to its closest neighbour relative to θ500, as the criterion. We found 15 pairs with a separation distance less than θ500.
Four are simply well-resolved pairs of different clusters detected in the same survey. In three cases, the two objects are at the same redshift, and therefore possibly in a premerging state.
Three other pairs correspond to close-by clusters lying at the same redshift, detected in two different surveys. These are MCXCJ2318.5+1842 (BCS, 𝓏 = 0.039, Abell 2572B) at 1.6′ from MCXCJ2318.4+1843 (NORAS, 𝓏 = 0.040, Abell2572); MCXC J2218.2–0350 (EMSS, 𝓏 = 0.09) at 6.7′ (0.8 θ500) from MCXC J2218.6–0346 (REFLEX, 𝓏 = 0.09) both also detected in SGP; and MCXC J2306.5–1319 (REFLEX, revised 𝓏 = 0.11) at 6.9′ (~0.8 θ500) from MCXC J2306.8–1324 (SGP, 𝓏 = 0.066). In all cases the XMM-Newton image shows that these are different objects.
One case, MCXC J1329.5+1147 (NORAS, 𝓏 = 0.022) at 4.1′ (~0.4 θ500) from MCXC J1329.4+1143 (400SD, 𝓏 = 0.023) is ambiguous. The XMM-Newton image shows a very diffuse object with a complex morphology and the NORAS luminosity is about three times greater than the 400SD value. Several bright point sources are also superimposed on the diffuse emission. The 400SD and NORAS objects may be different components of the same structure, and we therefore kept them both.
Finally, we found seven duplicates, including those already identified by NED or Simbad. These are listed in Table 3. Two cases are trivial: a single object is detected in the XMM-Newton archive image, the distance is small (<2′ or 0.17 θ500), and the redshifts are consistent. The other cases required deeper investigation because of luminosity or red-shift discrepancies (cases A and B in Table 3) or separation distances larger than 0.5 θ500 (case C). The association is based on higher resolution observations with XMM-Newton, Chandra, or ROSAT pointings, and ancillary optical data (primarily SDSS). Appendix A.2 contains details for each pair.
2.4 New clusters from MACS and new RASS-based catalogues
In addition to the input catalogues listed above, the MCXC-II was augmented with new clusters from the REFLEX II, MACS, and RXGCC catalogues.
MCXC-I cluster pairs at a separation distance of less than θ500, that are considered as the same object in MCXC-II.
Summary of the construction of the MACS catalogue and its inclusion in MCXC-II.
2.4.1 REFLEX-II
REFLEX-II is the extension of the REFLEX catalogue to a lower-flux limit corresponding to 0.6 times the REFLEX limit, as described by Böhringer et al. (2013). The 22 clusters at red-shift above 𝓏 > 0.2 have been published by Chon & Böhringer (2012) and are included in MCXC-II. All the objects are new, and there is no overlap with other MCXC-II source catalogues.
2.4.2 MACS
First described in Ebeling et al. (2001), MACS has not been released or published as a single homogeneous catalogue. In the first release of the MCXC, Piffaretti et al. (2011) assembled a consolidated catalogue of 39 MACS clusters, plus 11 objects common to other catalogues, by collecting and merging data from various MACS sub-samples that had been published up to that date (Ebeling et al. 2007, 2010; Maughan et al. 2008; Mantz et al. 2010). Since then, two further MACS sub-samples have been published (Mann & Ebeling 2012; Repp & Ebeling 2018).
For MCXC-II, we revised the MACS merging strategy to simplify the integration of the new entries from more recent publications and we re-adapted the sub-catalogue naming scheme for consistency. This is summarised in Table 4. We assigned a data release (DR) number to each MACS sub-sample in order of its publication date, and constructed the corresponding sub-catalogue with the clusters first appearing in each release.
MACS_DR1 is a complete sample of the most distant MACS clusters with 𝓏 > 0.5, published in Ebeling et al. (2007). It contains 12 objects, with Chandra luminosities.
MACS_DR2 is a flux-limited sample of 34 clusters in the redshift range 0.3 < 𝓏 < 0.5, above the flux limit of 2 × 10⁻¹² ergs−1 cm2 in the [0.1–2.4] keV energy band, published in Ebeling et al. (2010). Physical parameters from Chandra follow-up were published by Mantz et al. (2010). Three further sources were listed by Ebeling et al. (2010): a QSO (MACS J1542.0–2915) and two sources contaminated by AGN emission, MACS J0047.3–0810 and MACS J1824.3+4309. The Chandra image of the latter shows clear extended emission, and the corresponding cluster properties are published by Maughan et al. (2008). This object is therefore included in the MACS_DR2 sample, which contains 35 objects in total.
MACS_DR3 was built from the third release of MACS clusters, published by Mann & Ebeling (2012). Based on a complete sample with LX > 5 × 1044erg s−1 , the publication includes a total of 54 clusters with Chandra follow-up. However, only RASS luminosities are provided. DR3 adds 22 clusters to the previous DR1 and DR2 samples.
Additional MACS clusters recovered from non-catalogue studies were assembled into the supplementary MACS_MISC sub-catalogue. Here, we retained only MACS objects with available redshift and luminosity information. MACS_MISC is currently based on the study of Repp & Ebeling (2018), an HST follow-up of 86 clusters at 0.3 < 𝓏 < 0.5. It also includes some clusters for the as-yet unpublished extension of MACS to the southern hemisphere (the SMACS catalogue). We consider the 45 clusters with Chandra follow-up, which adds 16 clusters to the previous sub-catalogues.
All clusters studied by Maughan et al. (2008) are now included in one of the above sub-samples.
The final concatenated MACS catalogue consists of 85 clusters. The information was integrated into MCXC-II, after handling of multiple entries (see Table 4). A total of 63 MACS clusters are included in MCXC-II as primary objects. A further 22 clusters that appear in other MCXC-II input catalogues (NORAS, REFLEX, SGP, or BCS) are included in the overlap information, following the standard catalogue input priority scheme. Four further MACS DR1 or DR2 objects coincide with clusters from the NORAS, REFLEX, or SGP catalogues. One is the SGP cluster RXC J0152.5–2853 (mentioned in Sect. 2.2.2) and three were put as primary objects by Piffaretti et al. (2011) because the MACS redshift was more precise. In principle, since we computed the luminosity from the flux, we could have updated the redshift and used the standard priority for these systems. However, for continuity of the catalogue, we kept the original MCXC-I primary catalogue designation. Finally, two MACS objects also appear in the EMSS catalogues.
The MCXC-II position of the 12 DR1 clusters is the Chandra X-ray centroid determined by Ebeling et al. (2007). For the other clusters, we adopted the latest Chandra X-ray peak position published by Repp & Ebeling (2018), when available (31 clusters). The positions for the remaining nine DR2 and eight DR3 clusters were taken from the original catalogues, given by Ebeling et al. (2010, the Chandra X-ray peak) and Mann & Ebeling (2012), respectively. The position of MACS J1824.3+4309 is its Chandra X-ray centroid as published by Maughan et al. (2008).
The MACS_DR1, MACS_DR2, and MACS_MISC cluster redshifts are spectroscopic redshifts from the original publications (Ebeling et al. 2007, 2010; Maughan et al. 2008; Repp & Ebeling 2018, respectively), except for five DR2 clusters (of which three are prime objects in MCXC-II). For these, the red-shift given by Repp & Ebeling (2018) is slightly different, and we adopted this more recent spectroscopic value. The redshift of the 19 DR3 clusters given by Mann & Ebeling (2012) were based on photometric data. For 14 of these, we consolidated the red-shift with spectroscopic values from the literature: 11 redshifts from a cross-match with the optical catalogue of Wen & Han (2015), three redshifts from a cross-match with the ACT catalogue (Hilton et al. 2021), and one CLASH cluster (Balestra et al. 2016). The difference with the original MACS values is small, δ(𝓏) < 0.008, with a median value of δ(𝓏) = 0.003. For the remaining clusters, we adopted either the catalogue value (Mann & Ebeling 2012), or the values given by (Repp & Ebeling 2018), which were published with more significant digits, when available. The MCXC-II position and redshift may therefore differ slightly from those published by Piffaretti et al. (2011) for common clusters, since they used a single reference for all parameters (the primary catalogue from which the luminosity was extracted).
The standardisation of the X-ray luminosity L500 and mass M500 measurements for the MACS catalogue is different to that applied to the other ROSAT-based catalogues. This is described in Sect. 4.6.
 |
Fig. 1 Separation distance d between each RXGCC candidate and its closest MCXC-II cluster is plotted against their relative separation distance in terms of the angular size of the MCXC-II cluster |

2.4.3 RXGCC
RXGCC (Xu et al. 2022) is a catalogue of galaxy clusters constructed using a dedicated source detection and characterisation algorithm optimised for extended sources in the RASS. It contains 944 groups and clusters above the Galactic plane (|b| > 20° ). The redshifts were estimated from the distribution of spectroscopic and photometric redshifts of galaxies surrounding each detection.
Xu et al. (2022) provide a cross-identification with previously-known clusters from several catalogues, including with MCXC-I (Piffaretti et al. 2011). This cross-identification was based on the positional separation distance d between the objects (using d < 15′ and d < 0.5 Mpc as an association criterion) and their redshift difference (∆𝓏 < 0.01). However, to include the RXGCC catalogue into MCXC-II, we have decided to undertake our own cross-identification between RXGCC and MCXC-II. This allows us to take into account the updates of MCXC-II with respect to the MCXC-I release (including the additional clusters described above, and redshift updates described in Sect. 3), and to use cross-identification criteria that are better adapted to the cluster physical sizes. In particular, our cross-match relies on the angular separation distance between the clusters (d) and on their relative distance in terms of the angular size of the MCXC-II cluster  .
.
To identify the RXGCC clusters that are already included in one (or more) of the catalogues used to construct MCXC-II, we determined for each RXGCC cluster its nearest MCXC-II cluster. Figure 1 shows these possible associations in the d versus  plane. We distinguish two clouds of points: those with a small separation in absolute and in relative terms (the green-shaded area defined as d < 5′ and
  ), which correspond to correct associations, and those with a large separation in absolute and in relative terms (the red-shaded area defined as d > 10′ and
  ), which correspond to incorrect associations. We further individually analysed all the potential associations with an intermediate separation distance (the yellow-shaded area defined as d < 10′ and
  , or d > 5′ and
  using XMM-Newton, Chandra, SWIFT, ROSAT PSPC, and SDSS images (when available). We found that all the cluster pairs with d > 10′ were bad associations, and that all the pairs with d < 10′ except two seemed to be good associations. These two exceptions are the two pairs with the largest relative separation
  in the intermediate region.
RXGCC767 and MCXC J1807.4+6946
 , which are indeed two different objects that can be distinguished in the ROSAT PSPC image.
RXGCC 908 and MCXC J2256.9+0532
 : SWIFT, Chandra and XMM-Newton images show extended emission from two nearby sources and one bright point source. The MCXC position lies between the two extended sources, but the RXGCC position is centred on the point source emission. We consider that this RXGCC cluster is a false detection, since the point source is driving the detection, but it is not identified as a point source due to the nearby cluster that adds some extension.
Based on this analysis, we decided to use the following criteria for the RXGCC-MCXC-II association if the separation distance d between the RXGCC cluster and its closest MCXC-II cluster is less than 10 arcmin and less than  , we associate the RXGCC cluster to the existing MCXC-II cluster. Otherwise, the RXGCC cluster is considered to be a new entry for the MCXCII catalogue, except for the identified RXGCC false detection mentioned above. This results in 550 RXGCC clusters associated with already existing MCXC-II clusters, 393 new clusters for MCXC-II, and one RXGCC cluster that is not included in MCXC-II.
There are some differences between our RXGCC-MCXC-II cross-identification and the RXGCC-MCXC cross-identification included in RXGCC, owing to the use of different cross-identification criteria. In particular, there are 37 pairs of RXGCC-MCXC-II clusters that were not cross-identified in the RXGCC catalogue (marked with a cross in Fig. 1), 25 in the green-shaded area, and 12 in the yellow-shaded area.
We analysed all of these pairs individually. The disagreement in 15 of the 25 pairs in the green area is due to a new cluster or a redshift update in MCXC-II with respect to MCXC-I. Using the new redshift, the clusters would have also been cross-matched with the RXGCC criteria. Another case of disagreement in the green area is the pair MCXC J1314.4–2515–RXGCC 493, which is not associated in RXGCC because the distance (d=0.51 Mpc) is just above their threshold (this fixed distance criterion becomes more restrictive as the redshift increases). However, the XMM-Newton image shows a unique cluster and so, taking into account the angular extent of the source  , we consider this to be a correct association. In the nine remaining pairs of disagreement in the green area, there is a difference between the MCXC and RXGCC redshifts, in some cases owing to a superposition of different objects in the line-of-sight (as in MCXC J1601.3+5354, detailed in Appendix A.3), or the detection of two or more nearby clusters as a single object (as in MCXC J0034.2–0204, MCXC J0909.1+1059, and MCXCJ1032.2+4015, also described in Appendix A.3). We considered the association to be correct in these cases since the detected X-ray signal is the same for MCXC and RXGCC, but the redshift assignment is undertaken differently.
In our case, we chose the component that contributes the majority of the X-ray signal, whereas in RXGCC the redshift was assigned to the component with the most galaxies at that redshift. In other cases, the redshift difference is likely explained by the combination of spectroscopic and photometric redshifts included in the RXGCC, which produces a less accurate redshift estimation than the spectroscopic redshift preferred by the MCXC. This was the case for MCXC J1700.7+6412 (detailed in Appendix A.3), MCXC J1751.6+6719, MCXC J1755.7+6752, and MCXC J1921.3+7433. The last case with a redshift difference is the pair MCXCJ1659.6+6826–RXGCC 685, which is in fact a collection of point sources and not a real cluster (as detailed in Appendix A.3).
Regarding the yellow-shaded area, there are 12 pairs that we have associated, but RXGCC does not associate, either due to a large redshift difference, to a large separation distance, or both. Except for two cases, the redshift disagreement disappears when considering the updated MCXC-II redshifts (described below in Sect. 3). One of the exceptions is MCXC J0056.0–3732, for which the RXGCC redshift is incorrectly selected (see details in Appendix A.3). The second exception is MCXC J1414.2+7115, for which the redshift difference is just borderline (zMCXC = 0.225 , zRXGCC = 0.215). The XMM-Newton and Chandra images of this cluster show several extended emission sources, but both the MCXC and RXGCC aperture radii cover all of these sources (although the central position is chosen differently). Therefore, we consider that this is a correct association. On the other hand, the cross-identifications that are missing in RXGCC due to a large separation distance (d > 0.5 Mpc) can be explained by the different positions chosen by MCXC and RXGCC. Except for one case, MCXC generally chooses the peak of the X-ray emission whereas RXGCC chooses the centroid. This creates a separation between the MCXC and the RXGCC positions when the X-ray emission is elongated, in such a way that it exceeds the RXGCC distance threshold. The exception is the triple cluster MCXC J0956.4–1004, where the MCXC position is centred in between the three components, and the RXGCC position is centred in one of the components (see details in Appendix A.3).
Finally, we verified the coherence between the redshifts of all associated RXGCC-MCXC-II clusters, and individually checked all the cases with |zRXGCC − zMCXC|/(1 + zMCXC) > 0.01 or |zRXGCC − zMCXC|/zMCXC > 0.1. A total of nine pairs were found for the first criterion. For eight of these, there was a disagreement in the cross-identification as mentioned above. The final pair concerns MCXC J2306.5–1319, for which we have updated the redshift (see details in Appendix A.4). For the second criterion, we found six additional pairs one of which has a cross-identification disagreement mentioned above (MCXC J1755.7+6752), as well as five low-redshift pairs for which the redshift difference can be explained by the use of photometric redshifts in the RXGCC catalogue (MCXC J0152.9–1345, MCXC J1506.4+0136, MCXCJ1654.7+5854, MCXC J1705.1–8210, and MCXC J1836.5+6344). The final MCXC-II catalogue includes a note for all the cases with a significant redshift difference, which is usually due to the superposition of different clusters.
2.5 Update of multiple-entry information and final MCXC-II content
Updating the MCXC-II content as described in Sect. 2 has an impact on the overlap information provided in the catalogue. New multiple entries primarily originate from the overlap between the MCXC-II and the new catalogues, but new duplicates also occur between objects in the MCXC-II input source catalogues.
When a cluster appears in several catalogues, Piffaretti et al. (2011) had to choose the source catalogue (hereafter, ’primary catalogue’) from which they extracted all the relevant physical properties (position, redshift, and luminosity). They, therefore, defined a priority hierarchy between input catalogues, based principally on catalogue size and the availability of an aperture luminosity (rather than a total value), in order to maximise the homogeneity of the final meta-catalogue. There were two exceptions to the general priority rule. When the redshift difference was larger than 10%, they chose the catalogue with the best redshift. In case of multiple systems, they adopted the measurement that best separated the components or was better centred on the main component. We maintained this strategy for complex systems. However, the first exception is no longer necessary: since we recompute the luminosity from the flux, we can simply update the redshift in the primary catalogue.
In the treatment of new multiple entries, we generally follow the philosophy of Piffaretti et al. (2011). In particular, we maintained the same ranking of MCXC-I input catalogues, as given in Table 5. A further concern was the continuity of the MCXC catalogue itself and how it is used. We, therefore, resolved to change the cluster reference catalogue and physical parameters only when necessary, and we did not change the primary catalogue of objects already present in MCXC-I, unless physically justified. In practice, the following treatments were used for the different cases of multiple detection:
For duplicates already identified in MCXC-I, we kept the primary catalogue. In particular, this concerns the five BCS-NORAS and three MACS-(NORAS or REFLEX) pairs whose primary choice does not follow the catalogue priority but is based on redshift considerations (see Piffaretti et al. 2011, Table B.1).
For the seven new MCXC-II cluster duplicates identified Sect. 2.3), the choice of object to be retained was based on catalogue priority, except for MCXC J1010.2+5430 (400SD) and MCXC J0034.2–0204 (SGP). The former is preferred to MCXC J1010.2+5429 (NORAS) because the NORAS detection is contaminated by a point source. The latter is preferred to MCXC J0034.6–0208 (REFLEX) because it is well centred on the main component of the multiple system. Both cases are discussed in detail in Appendix A.2.
The new clusters from source catalogues considered in MCXC-II because of newly available redshift measurements (Sect. 2.2) are essentially new single entries, as expected. The only exception is MCXC J0236.0–5225, which is listed both in 160SD (where it is formally flagged as false) and WARPS (Sect. 2.2.3). However, there are also four new pairs introduced by our use of input catalogue flux measurements, rather than luminosities. These pairs comprise the three NORAS objects (Sect. 2.2.1) and the SGP cluster (Sect. 2.2.2), which were excluded by Piffaretti et al. (2011) owing to the lack of a redshift and therefore luminosity measurement. These were matched with three eBCS clusters and one MACS_DR2 cluster. We computed the luminosity from the flux at the cluster redshift for these objects. For catalogue continuity, we did not change the primary source, in spite of the higher NORAS and SGP catalogue priority, but the overlap information for these objects is complete.
During the revision, we further realised that six clusters with redshift are in fact missing in the overlap information.These include two EMSS clusters (MS 0906.5+1110 and MS 2318.7–2328), the BCS detection of Abel10168, one 160SD cluster ([VMF98] 196), one SHARC_BRIGHT cluster (RX J1142.2+1026) and one MACS_DR2 cluster (MACS J2228.5+2036). Their corresponding input sub-catalogue and luminosity are now included in the overlap information of their counterpart in higher priority catalogues: MCXCJ0909.1+1059 (NORAS), MCXC J2321.4–2312 (REFLEX), MCXC J0115.2+0019 (REFLEX), MCXC J2003.4–5556 (400SD), MCXC J1142.2+1027 (400SD), and MCXC J2228.6+2036 (NORAS), respectively.
The cross-identification of clusters from new catalogues (REFLEX-II, the MACS extension, and RXGCC) with other MCXC-II clusters, is described in the corresponding sections (Sects. 2.4.1, 2.4.2, and 2.4.3, respectively). REFLEX-II has no overlap with other input catalogues, and only one cluster in common with RXGCC, and was therefore simply added as a sub-catalogue of the NORAS/REFLEX catalogue. The 24 new MACS clusters not matching previously known MCXC-II clusters from higher priority catalogues (NORAS, REFLEX, or SGP) were introduced as primary objects. There is a large overlap between the RXGCC catalogue and the RASS based catalogues, and its inclusion was undertaken in such a way as to maximise the MCXC continuity. Although the RXGCC catalogue size is slightly larger than that of NORAS+REFLEX (the highest priority catalogue) and does include aperture flux measurements, we simply added the RXGCC catalogue at the end of the list. This choice avoids an artificial change of the parameters of the 550 objects in common with other MCXC-II clusters, while the RXGCC and MCXC-I luminosities are in good agreement (Sect. 5.4). We found that none of the complex association cases discussed in Sects. 2.4.3 and A.3 required a change of primary choice.
In all cases, the information on additional detections is provided in the overlap fields of each MCXC-II cluster. We give the names of overlapping catalogues and the corresponding L500 values, computed from the respective flux at the adopted redshift. These may differ from the MCXC-I values, which were based on source catalogue luminosities, and thus subject to additional systematic differences in cases of redshift discrepancy between catalogues.
The final MCXC-II catalogue content is summarised in Table 5. For each input catalogue, we give the number of clusters included in MCXC-II (excluding false objects, or those still without redshift), and the number of clusters after handling of multiple entries between catalogues. Figure 2 summarises the catalogue update steps. MCXC-II comprises a total of 2221 clusters, as compared to the 1743 MCXC-I clusters. This 27% increase is primarily due to the inclusion of the RXGCC. A detailed comparison between MCXC-I and MCXC-II is presented in Sect. 6.1.
3 Cluster redshift revision
3.1 General method
In the first release of the MCXC, the redshift z of each object was taken to be that given in the parent catalogue. A cross-check was undertaken in the case of catalogue overlaps, and objects with redshifts differing by more than 10% were subject to manual verification as described in Appendix B of Piffaretti et al. (2011). The redshift values in the parent catalogues come from literature searches for known objects, dedicated optical follow up, or a mixture of both. Although spectroscopic redshifts are the ‘gold standard’, the value is often based on measurements for one galaxy, which may be a foreground object. Rozo & Rykoff (2014) compared the MCXC-I redshift and SDSS-based redMaPPer photometric redshift of 323 MCXC-I clusters at z > 0.1, and found excellent agreement, albeit with eight prominent outliers (their Fig. 1). For six of these, the photometric measurements indicated that the MCXC-I redshift was incorrect, while the two remaining objects were affected by zphot systematics.
For MCXC-II, we performed a systematic revision of the MCXC-I redshift. In this undertaking, our goal was not to identify the best available redshift for each object, a task which is far beyond the scope of the paper (and which is arguably somewhat subjective). Our aim was simply to identify and update ‘problematic’ redshifts as broadly as possible; in particular, where there is a significant impact on the luminosity and (thus) mass estimate. For this, we compared the MCXC-II redshifts with the preferred values of the NED and Simbad database as of August 2023, as well as the spectroscopic redshift of optical counterparts from large catalogues from large optical/NIR surveys (SDSS, WISE, etc.)10.
The criteria for further redshift inspection were: i) a difference from the MCXC value larger than 10% and/or ii) a ∆(z)/(1 + z) > 0.01. Via the luminosity-distance factor, the first criterion corresponds to systematic uncertainty of ≳ 20% on the luminosity, similar to its typical statistical precision. The second criterion corresponds to ~3000 km s−1, or three times the typical velocity dispersion of a massive cluster, and is an indicator of a possible redshift measurement based on a foreground/background object. This dominates the ∆(z)/z < 10% requirement at z > 0.1, above the median MCXC- redshift. The decision to update the redshift was based on a manual inspection of each case. Depending on data availability and case complexity, the information we used may include the following.
Information on the quality of the original redshift, particularly the number of galaxies used for its estimation. This was retrieved from the original publication or follow-up information.
Complementary information from NED and Simbad, such as a search around the position, and the consideration of various z estimates. The main cluster identified as the source of the redshift measurement is also important in complex cases of multiple (or close-by) systems at the X-ray position.
-
Comparison with redshift of possible counterparts. This includes clusters from the Abell catalogue (Abell et al. 1989) and recent optical catalogues based on large galaxy surveys:
redMaPPer catalogues (hereafter RM) published by Rykoff et al. (2016), including clusters from DES Science Verification data and the updated version of the catalogue of Rozo et al. (2015) from SDSS-DR8 data. The spectroscopic redshift of the BCG is available for 60% of the SDSS clusters.
The catalogues of Wen & Han (2015, hereafter WH) and Wen et al. (2018, herafter WHY) based on SDSS-DR12 and 2MASS, WISE, and SuperCOSMOS data, respectively. The WH catalogue constitutes an update of the WHL12 catalogue (Wen et al. 2012), with new clusters at high z. Spectroscopic redshifts, estimated from all spectroscopic members, are available for ~75% of the WH clusters.
The catalogue of 0.01 < z < 0.2 clusters identified from over-densities in redshift phase space from SDSS-DR13 data by Abdullah et al. (2020, herafter GalWCat).
We also considered the XMM-Newton serendipitous catalogue of Koulouridis et al. (2021, herafter X-CLASS), using the redshift information (position and redshift of spectroscopic galaxies) available from their database11. We also make use of the RXGCC database12, which contains redshift histograms and overlays of X-ray images and galaxy distributions at various redshift peaks.
Inspection of X-ray images from RASS, XMM-Newton, Chandra, and SWIFT (available in the M2C database), and/or pointed ROSAT PSPC observations, and SDSS optical images, with the positions of optically-detected clusters and galaxies with spectroscopically-measured redshifts overlaid.
Summary of the MCXC-II catalogues and sub-catalogues, the revised version of Table 1 from Piffaretti et al. (2011).
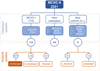 |
Fig. 2 MCXC-II catalogue update summary diagram. Top panel: revision of catalogue content, from left to right: 1) removal of one false cluster and seven duplicates (Sect. 2.3) in the original MCXC-I catalogue (Piffaretti et al. 2011); 2) entries from new ROSAT-based catalogues (Sect. 2.4); 3) new entries from source catalogues not previously considered owing to a lack of redshift or luminosity information (Sect. 2.2). Bottom panel: redshift revision of MCXC-II redshift (Sect. 3) and new redshift sources (Sect. 2.2). |
3.2 From NED and Simbad
For 98 MCXC-II clusters, the MCXC-I redshift difference with respect to the preferred NED and/or Simbad value is larger than 10%. This includes 18 discrepant redshifts with both NED and Simbad, 37 with NED only and 43 with Simbad only. The ∆(z)/(1 + z) < 0.01 criterion adds 45 additional discrepant red-shift cases, of which only two are in common between NED and Simbad.
The majority of the cases (68%) were not retained for revision. There are a few complex cases of confusion, or even incorrect cross-identification of the MCXC cluster. However, the majority of the redshift discrepancies concern older references (and generally less precise redshifts) in NED or Simbad, or the choice of a photometric preferred redshift rather than spectro-scopic values. Examples of ‘old’ measurements include: Abell cluster redshifts based on one or two galaxies where better estimates are available in the X-ray catalogues; and the redshifts for the 16SD catalogue in Simbad, which were mostly taken from the original publication Vikhlinin et al. (1998) rather than the values derived from dedicated latter follow-up by Mullis et al. (2003). Concerning photometric redshift measurements, NED favours redshifts with uncertainties, which is the case for the photometric redshifts in the RM catalogue. Several cases of redshift mismatch correspond to photometric redshifts taken from the RM catalogue (Rykoff et al. 2016), with differences consistent with the spectroscopic value.
In 30 cases, we decided to revise the MCXC-II redshift. The original MCXC-I redshift, zcat, and the revised value are listed in Table 6, together with the redshift type and reference. Note that the final redshift is based on examination of the available information, and is not necessarily the NED or Simbad preferred value. The 23 largest revisions, with ∆(z)/z > 30% or ∆(z)/(1 + z) > 0.03 are marked in bold in the table and are discussed individually in Appendix A.4.
At low redshift (z < 0.1) the revision greatly benefitted from the GalWCat catalogue, and large-scale spectroscopic follow-up of cluster samples (Wegner et al. 1999; Smith et al. 2004, e.g.) or complex fields (e.g. Monteiro-Oliveira et al. 2022), which allows us to refine the catalogue values. Large outliers, with ∆(z)/(1 + z) > 0.01, were observed above z > 0.1. Several cases simply correspond to a catalogue redshift value based on one or two likely foreground galaxies, for example, RASS clusters matched with Abell systems that have a redshift estimated from only one or two galaxies. Other cases mostly included complex fields, with several close-by objects or even structures at different redshifts along the line of sight. These important revisions are usually supported by converging evidence from the cross-match with optical clusters (GalWCat, RM and WH/WHY) and/or X-CLASS/RXGCC data, with the revised redshifts usually based on a large number of spectroscopic galaxies (see columns 11 and 12 of Table 6).
3.3 Additional revision from cross-match with optical catalogues
In a second step, we cross-identified the remaining clusters with matching NED/Simbad redshift with large optical RM, WH/WHY, and GalWcat catalogues. The difference criteria remained the same, only considering optical clusters with spectroscopic redshits. We started with the WH catalogue, which is based on more recent (and thus complete) SDSS spectroscopic data.
Cross-identification with optical catalogues is not trivial, owing to physical offsets between X-ray and optical centres and superpositions along the line of sight. In particular, the probability of chance association is expected to increase with decreasing redshift as the source angular extent becomes larger. Furthermore, SDSS-based catalogues are incomplete at low redshift, and may miss the optical counterpart even of nearby massive objects, while distant low-mass optical groups can appear in projection against the large angular extent of the X-ray cluster. We cannot exclude these cases using ∆(z) constraints, as those would artificially exclude cases of false redshifts. For each MCXC-II object in the original MCXC-I catalogue we identified the closest optical cluster, or the second-closest optical cluster if the latter was richer than the former.
To put a constraint on the separation distance D, we first looked at the cluster position in the D–D/θ500 plane. We considered both the θ500 estimated from the X–ray measurements (θ500,Mcxc), and the optical value derived from the massrichness relation calibrated in the respective optical catalogues (θ500,opt). Contrary to the case of the cross-match between MCXC and RXGCC (Fig. 1), we did not observe two well-separated clouds. We therefore further examined the location of clusters with matching SDSS redshifts in the D–D/θ500 plane, taking into account their redshift difference. This allowed us to define the following criteria for possible optical counterpart: zMCXC > 0.04 and D/θ500,opt < 1 (in practice this also corresponds to D/θ500,MCXC < 1).
We identified 533 potential WH counterparts, whose optical redshifts are compared to the MCXC-I redshift in the left panel of Fig. 3. The agreement is excellent for 498 objects with a median ratio of 0.9995 ± 0.0005 (that is, zero bias) and a 68% dispersion of only ∆(z) = 0.0024. There are 35 outliers. Thirteen cases correspond to MCXC-II redshifts that are discrepant with NED or Simbad values, whose redshifts have been revised to a new redshift in agreement with the SDSS value (Sect. 3.2). After individual examination of the 22 remaining cases, we further revised the redshift of seven objects (Table 6). The largest revisions are discussed in Appendix A.4, and correspond to the same typical cases as discussed in Sect. 3.2. The remaining 15 WH outliers, but for two entries, are background objects. They are at much larger redshift than the MCXC-II cluster (∆(z) = [0.04–0.6], see Fig. 3), while the choice of MCXC-II redshift is further supported by redMaPPer and/or GalWCat counterpart, not present in WH catalogues.
We repeated the procedure for the catalogue of Wen et al. (2018, WHY). Here we only examined the cases of clusters not already in the Wen & Han (2015) catalogue, as indicated in their table. Of eight new discrepant cases, we further retained two revisions, discussed in detail in Appendix A.4. In the case of two REFLEX cluster, the procedure was inconclusive owing to a lack of additional data, so we conservatively kept the MCXC value.
We then considered possible discrepancies with redMaPPer spectroscopic redshifts. The pre-selection of potential counterparts was defined following the same method as for the WH clusters. We used a slightly higher redshift threshold, zMCXC > 0.075, and D/θ500,opt. The right-hand panel of Fig. 3 compares the MCXC-I and RM redshifts for the 250 objects in common. There is an excellent agreement for the vast majority of cases, with a median ratio of 1.0006 ± 0.0008 and a 68% dispersion of only ∆(z) = 0.0022, for the 237 objects with ∆(z)/z < 0.1 . Of the 13 outliers, nine had already been revised in the previous steps, in agreement with the RM value. The remaining four outliers are clearly background objects that were not retained for revision.
Finally, we cross-matched with the GalWCat catalogue. No further redshift revision was required. This was expected as Simbad includes the GalWCat cross-match, and discrepant redshifts were mostly identified with the NED/Simbad test.
Clusters with revised redshifts.
3.4 Redshift type and reference and consolidation
For each cluster, we provide additional information beyond the redshift value: the bibliographic reference Z_REF, given as far as possible in the form of BIBCODE, the redshift type Z_TYPE, and a flag, Z_FLAG.
For Z_TYPE, we distinguish firstly between photometric (P) and spectroscopic (S) redshift. A few redshifts are only estimated (e.g. from the magnitude of the BCG) and these have a redshift type designated ‘E’. We added the category ‘SP’ for RXGCC redshifts (see below). When we could not determine the provenance of the redshift, it was set to ‘U’ for unknown.
Z_FLAG refers to the redshift revision. We set Z_FLAG to ‘NEW’ for NORAS, SGP, 160SD or WARPS entries based on newly-available redshifts (Tables 1 and 2). Z_FLAG is set to ‘ Revised’ for clusters with revised redshift presented in Sect. 3 (Table 6). For the other clusters, the redshift is nominally taken from the source catalogue and Z_FLAG is therefore set to ‘ Catalogue’. In some cases, we used another reference as described below, and the corresponding clusters are denoted by Z_FLAG = ‘Consolidated’
For clusters with new or revised redshifts, the redshift type and reference are given in the corresponding sections (Sects. 2.2 and 3). The redshift type and reference of MACS clusters is described in Sect. 2.4.2. For RXGCC, the redshift was primarily determined from a compilation of galaxy redshifts, combining spectroscopic and photometric values. In that case Z_TYPE is set to ‘SP’. When this was not possible, Xu et al. (2022) gave a redshift taken from the literature, simply specifying whether the cross-identified cluster was from optical or X-ray catalogues. In that case we set Z_TYPE to ‘U’. In all cases, Z_REF is the BIBCODE of the RXGCC publication.
For the other clusters, we started with the information in the catalogue publication, as now described. For five catalogues, NEP, SHARC_SOUTH, WARPS, WARPSII, and EMSS_1994, the redshifts were all derived from dedicated follow-up. We thus put the reference of the catalogue, except for EMSS and NEP, the reference being the previously published follow-up (Stocke et al. 1991; Gioia et al. 2003, respectively).
For the other catalogues, the redshift source is a mixture of dedicated follow-up (published separately or not) and/or literature (including the galaxy catalogue). In that case, the reference for each cluster can be retrieved from the VizieR table associated with each cluster catalogue. It lists the correspondence between the reference code (number or letter) given in the catalogue and the BIBCODE when available and/or a description of the reference. Some homogenisation and manipulation were necessary.
We set Z_REF to the BIBCODE of the catalogue publication when:
The redshift comes from dedicated follow-up, if no corresponding published article is listed. Note that more information on part of the SGP and REFLEX observing campaigns, are published in the PhD thesis of K. Romer (1995) and in Guzzo et al. (2009), respectively. This also concerns references quoted as ‘in preparation’, explicitly as a forthcoming follow-up article (that we could not find in some cases) or by the catalogue authors. However, in the specific case of BCS, the BCG redshift for clusters listed with the reference ‘Crawford et al., in prep.’ have been published by Crawford et al. (1999). In that case, we replaced the catalogue value and reference with this publication.
The redshift is a compilation of several sources from the literature (possibly combined with the follow-up). This concerns REFLEX, NORAS, SGP and CIZAI catalogues.
The source is a galaxy catalogue, from which the cluster redshift is estimated. In that case we add the catalogue name to the BIBCODE. This concerns the CfA catalogues, Cat. <VII/193>13, by Huchra & et al. (1992); Huchra et al. (1990a) used for BCS/eBCS (although it is not always clear which version were used), the reference catalogue of Bright galaxies, Cat. <VII/155>14 by de Vaucouleurs et al. (1991), used for NORAS, BCS and eBCS, and Cat. <VII/115>15 by Lauberts & Valentijn (1989) used for NEP and SGP.
In all these case the redshift type (essentially spectroscopic) is unambiguous from the follow-up description and/or the quoted source.
When the redshift source was a published article, we simply set Z_REF to its corresponding BIBCODE. For publications based on previous work, for example, the compilation of Struble & Rood (1999), we did not trace back to the original reference, unless if needed to determine the redshift type or when needed settle the cases of problematic redshifts (Sect. 3). The only exception is the 400SD clusters for which Burenin et al. (2007) refer to the 160SD publication (Mullis et al. 2003). In this case, the redshift source is taken from the latter. The redshift type can generally be found in the publication in question.
Finally, there are cases where the source given in the catalogue is not sufficient to determine the redshift type, such as ‘private communication’, publications ‘in preparation’ or a few other problematic references. In these cases, we searched for other redshift sources. If available, we list the corresponding reference (given in Z_REF), as well as the redshift for consistency. The difference with the catalogue value is negligible. These cases are flagged by Z_FLAG set to ‘Consolidated’.
 |
Fig. 3 Comparison between MCXC-II redshifts and spectroscopic redshift values from SDSS-based catalogues. The revised values discussed in Sect. 3 are marked in red, and connected to the MCXC-I values by a red line. Left panel: comparison with the closest potential counterpart from the Wen & Han (2015, WH) catalogue (see text). MCXC J0019.6+2517, labelled in the figure, is a line-of-sight structure where the main component is identified with the richest second-closest WH cluster. Right panel: same for redMaPPer clusters from the updated version of the catalogue of Rozo et al. (2015), published by Rykoff et al. (2016). |
4 Luminosity and mass determination
4.1 General method
The X-ray luminosity information published in each catalogues is not homogeneous, being given in various energy bands and apertures, and for different cosmologies. MCXC-I provided standardised luminosity and mass within R500, L500 and M500. As detailed in Sect. 3.4.1 of Piffaretti et al. (2011), the published catalogue luminosities were first converted to [0.1–2.4] keV band luminosities for the reference cosmology when necessary and then aperture-corrected.
In a significant improvement with respect to the original release, MCXC-II has been fully updated with new L500 calculations. For 96% of MCXC-II, the L500 was recalculated using the X-ray flux information from the original source catalogues.
The remaining 4% correspond to 14 EMSS objects and the clusters in the MACS catalogue, the specific treatment of which is detailed in Sects. 4.7 and 4.6. This approach was deemed necessary to include newly-available redshifts for which no luminosity had been published. Moreover, this new approach allowed us to homogenise further the luminosity measurements, to calculate statistical errors on L500 directly from measured quantities, and to rigorously update the luminosity with new redshifts, if applicable.
The starting observable is the flux in a given energy band at Earth in a given aperture, ![${F_{{\rm{ap}},\left[ {{{\rm{E}}_1} - {{\rm{E}}_2}} \right]}}$](/articles/aa/full_html/2024/08/aa49427-24/aa49427-24-eq13.png) , which must be converted to
, which must be converted to ![${L_{{\rm{ap}},\left[ {{{\rm{E}}_1} - {{\rm{E}}_2}} \right]}}$](/articles/aa/full_html/2024/08/aa49427-24/aa49427-24-eq14.png) , the X-ray luminosity in the same energy band at the source. This conversion is undertaken via the standard K-correction factor
, the X-ray luminosity in the same energy band at the source. This conversion is undertaken via the standard K-correction factor ![${K_{\left[ {{{\rm{E}}_1} - {{\rm{E}}_2}} \right]}}$](/articles/aa/full_html/2024/08/aa49427-24/aa49427-24-eq15.png) (T, z), namely: the ratio of the luminosity in the measured energy band, [E1 − E2], to the luminosity in the shifted energy band of the incoming photons, [E1 − E2](1 + z) as follows:
(T, z), namely: the ratio of the luminosity in the measured energy band, [E1 − E2], to the luminosity in the shifted energy band of the incoming photons, [E1 − E2](1 + z) as follows:
![${{K_{\left[ {{{\rm{E}}_1} - {{\rm{E}}_2}} \right]}}(T,z) = {{{L_{{\rm{X}},\left[ {{{\rm{E}}_1} - {{\rm{E}}_2}} \right]}}} \over {{L_{{\rm{X}},\left[ {{{\rm{E}}_1}(1 + {\rm{z}}) - {{\rm{E}}_2}(1 + {\rm{z}})} \right]}}}}}$](/articles/aa/full_html/2024/08/aa49427-24/aa49427-24-eq16.png) (1)
(1)
![${L_{{\rm{ap}},\left[ {{{\rm{E}}_1} - {{\rm{E}}_2}} \right]}} = 4\pi D_1^2(z){F_{{\rm{ap}},\left[ {{{\rm{E}}_1} - {{\rm{E}}_2}} \right]}}{K_{\left[ {{{\rm{E}}_1} - {{\rm{E}}_2}} \right]}}(T,z)$](/articles/aa/full_html/2024/08/aa49427-24/aa49427-24-eq17.png) (2)
(2)
where Dl is the luminosity distance. The quantity ![${K_{\left[ {{{\rm{E}}_1} - {{\rm{E}}_2}} \right]}}$](/articles/aa/full_html/2024/08/aa49427-24/aa49427-24-eq18.png) (T, z) depends on the temperature, T, and redshift, z, and can be computed from plasma emission models. Starting from the flux allows us to propagate the redshift updates in a rigorous way. Indeed, it is because of the K(z, T) correction that the luminosity in the source catalogue cannot simply be rescaled by the change in luminosity distance owing to the change in redshift.
(T, z) depends on the temperature, T, and redshift, z, and can be computed from plasma emission models. Starting from the flux allows us to propagate the redshift updates in a rigorous way. Indeed, it is because of the K(z, T) correction that the luminosity in the source catalogue cannot simply be rescaled by the change in luminosity distance owing to the change in redshift.
If the input flux is given in an energy band different from the reference [0.1–2.4] keV band, we further need to convert luminosities. We define KL as the ratio of the luminosity in a given energy band, [E1 − E2], to the luminosity in another energy band ![$\left[ {E_1^\prime - E_2^\prime } \right]$](/articles/aa/full_html/2024/08/aa49427-24/aa49427-24-eq19.png) . This ratio depends on the considered energy band and on the temperature:
. This ratio depends on the considered energy band and on the temperature:
![${L_{{\rm{ap}},[0.1 - 2.4]}} = {K_{{\rm{L}},\left[ {{{\rm{E}}_1} - {{\rm{E}}_2}} \right]}}(T){L_{{\rm{ap}},\left[ {{{\rm{E}}_1} - {{\rm{E}}_2}} \right]}}.$](/articles/aa/full_html/2024/08/aa49427-24/aa49427-24-eq20.png) (3)
(3)
The last step is to convert the luminosity measured in a given aperture to L500. As in Piffaretti et al. (2011), we assumed a universal density profile such that:
![${L_{500,[0.1 - 2.4]}} = {f_{{\rm{ap}}}}\left( {{R_{{\rm{ap}}}}/{R_{500}}} \right){L_{{\rm{ap}},[0.1 - 2.4]}}$](/articles/aa/full_html/2024/08/aa49427-24/aa49427-24-eq21.png) (4)
(4)
where ƒap(Rap/R500) depends on the shape of the universal density profile, ρgas(r/R500) (see Appendix B.2).
To estimate the temperature and R500 appearing in the above equations, we used the L500−M500 and L500−T relations:
![${A_{\rm{T}}}{\left( {{T \over {5{\rm{keV}}}}} \right)^{{\alpha _{\rm{T}}}}} = E{(z)^{{\beta _{\rm{T}}}}}\left( {{{{L_{500,[0.1 - 2.4]}}} \over {{{10}^{44}}{\rm{erg}}\,\,{{\rm{s}}^{ - 1}}}}} \right)$](/articles/aa/full_html/2024/08/aa49427-24/aa49427-24-eq22.png) (5)
(5)
![${A_{\rm{M}}}{\left( {{{{M_{500}}} \over {3 \times {{10}^{14}}{M_ \odot }}}} \right)^{{\alpha _{\rm{M}}}}} = E{(z)^{{\beta _{\rm{M}}}}}\left( {{{{L_{500,[0.1 - 2.4]}}} \over {{{10}^{44}}{\rm{erg}}\,\,{{\rm{s}}^{ - 1}}}}} \right),$](/articles/aa/full_html/2024/08/aa49427-24/aa49427-24-eq23.png) (6)
(6)
together with the relation between R500 and M500
 (7)
(7)
where ρrc(z) is the critical density of the Universe at the cluster redshift.
For a given input flux, the unknown parameters T, L500 and M500, must simultaneously solve the three equations given in Eqs. (4)–(6). In practice this is achieved through a double iteration:
For a given temperature T, Lap[0.1−2.4] is derived from Eq. (2), combined with Eq. (3) if necessary.
The corresponding luminosity, L500, and mass M500 are then derived iteratively using Eqs. (4) and (6). The first guess M500 is derived from Eq. (6), setting L500 to Lap, then a new L500 is derived from Eq. (4) with R500 from Eq. (7). The process continues until it converges.
A new temperature T can be derived from Eq. (5), and the procedure restarted from step 1, until convergence. We used a starting temperature of 3 keV for the iteration procedure. The median number of iterations, niter, necessary to reach a convergence of ∆(T)/T < 10−5 is three, with niter between two and four for 95% of the cases. This rapid convergence, which is insensitive to the starting T value, is due to the nature of the corresponding implicit equation on T. This is further discussed in Appendix B.3.
This method allows for a fully consistent computation of the uncertainties on L500 and M500 for each cluster directly from the flux errors. The upper and lower limits on L500 and M500 are readily obtained by re-running the procedure with the upper and lower limits on the flux.
4.2 Standardised input fluxes
Table 7 gives a synthetic overview of the flux standardisation for each input catalogue. The aperture flux, Fap, and corresponding radius, Rap, are directly available in the REFLEX and NORAS catalogues. For NEP, Henry et al. (2006) provide Rap (denoted Rcirc) and Fap was recovered from the published total fluxes and size correction, S C. For SHARC, Romer et al. (2000) chose an aperture R80 that would contain 80% of the flux for a model cluster. In this case, Rap = R80 and Fap is equal to 0.8 times the published total flux. For BCS, the detection was based on the VTP (Voronoi tesselation and percolation) technique (Ebeling et al. 1998), and the source radius was expressed as RVTP the equivalent radius of the source detected by VTP. We assumed Rap = RVTP and retrieved the corresponding flux from the total flux multiplied by the ratio between the total and VTP count rates. For RXGCC, Xu et al. (2022) provide Rap (denoted RSIG), which was defined from a growth curve analysis, and the corresponding count rate, CRSIG. The aperture flux was retrieved from their published flux within R500 (estimated iteratively) multiplied by the ratio of count rates within RSIG and R500. For the other catalogues, only the total flux is available. For these, we used a fixed size correction, as explained in the next section.
Errors on the flux were scaled from the relative statistical errors on the observed count rates, when available. Those are therefore as close as possible to purely statistical errors. For SHARC-SOUTH, we removed quadratically the 5% systematic uncertainty that Burke et al. (2003) added to their count rate errors. No flux errors are available for WARPs clusters. Errors are further discussed in Sect. 6.2.
Summary of the flux measurements and standardisation method.
4.3 Input models
The K and KL corrections were computed from an apec model with a fixed abundance of 0.3 relative to solar. Figure 4 shows the variation with redshift of the K-correction for the two energy bands of interest for ROSAT catalogues. The correction is always less than 25%.
The KL-correction, plotted in Fig. 5 as a function of luminosity, is almost constant in the cluster regime (M500 > 1014 M⊙ or L500 ≳ 4 × 1043 erg s−1) with less than 1.6% variation. It decreases in the group regime, by 10% at L500 ~ 7.5 × 1042 erg s−1 (M500 ~ 1013 M⊙). For lower luminosity/temperature systems, the KL-correction increases again and becomes extremely sensitive to the temperature, due to the increasing contribution of emission lines to the flux. However, there are only six MCXC-II objects with L500 < 1041 erg s−1, most likely galaxy halos, for which the KL-correction is more than 10% larger than the mean.
The KL differs from that computed by Piffaretti et al. (2011) for low temperature (low luminosity) clusters. Piffaretti et al. (2011) used a correction from a tabulated MeKaL model which was extrapolated below T = 1 keV, thus with a weaker temperature dependence. The difference is less than 0.5% in the cluster regime, and does not exceed ±10% between 0.3 and 1 keV; however, it reaches a factor of two at kT = 0.2 keV.
The aperture correction is the same as that used for constructing MCXC-I, which was based on the REXCESS density profile (see Piffaretti et al. 2011, Sect. 3.4.1.) and is detailed in Appendix B.2. If only the total flux was provided in the input catalogue, L500 was calculated from Ltot multiplied by a factor of 0.91385, corresponding to the ratio between the integral of the profile within R500 and the integral within a very large radius. In this case, step 2 is trivial, and the procedure only requires the temperature iteration to estimate L500, with M500 computed at the end with Eq. (6).
We used the non-core-excised L500-T relation in the [0.1-2.4] keV band obtained by Pratt et al. (2009) from REXCESS data. Piffaretti et al. (2011) used this same relation for the computation of the temperature needed for the KL conversion factor.
We used a re-calibration of L500–M500 relation of Piffaretti et al. (2011), using an evolution factor E(z)−2, appropriate for luminosities in the soft energy band, instead of E(z)−7/3 assumed by Arnaud et al. (2010), whose relation was used for MCXC-I. This local re-calibration was based on REXCESS data as in Arnaud et al. (2010). The parameters of Eqs. (5) and (6) are then:
 (8)
(8)
 (9)
(9)
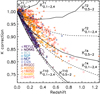 |
Fig. 4 K-correction as a function of redshiſt. Lines: Correction computed with an apec model for two energy bands of the ROSAT input flux, [0.5–2.] keV and [0.1–2.4] keV, and four different temperatures (1, 2, 4, and 10 keV). Each curve is labelled accordingly, with the information in the index and exponent, respectively. For instance: |

4.4 Comparison between original catalogue luminosity and recomputed luminosity
In Fig. 6, we compare the aperture luminosity that we computed from the flux using the iterative process described in Sect. 4.1, to that published in the input catalogues. We obviously considered only clusters with unchanged redshifts, and compared the Lap value in the energy band of the input flux measurement. In principle, the two estimates should only differ as a result of the K-correction, that is, on the assumed temperature.
The ratio of the two estimates exhibits a large scatter, which increases at lower luminosities, Lap ≲ 1043 ergs−1. This is not expected as it concerns low temperature (T < 2 keV), mainly low z, objects for which the K-correction is very small (Fig. 4). For the clusters with Lap ≲ 1043 erg s−1, the K-correction we estimated is indeed less than ±2%. We found that the difference with the published luminosities is in fact due to truncation errors when the luminosity value has only one significant digit.
For Lap > 1043 erg s−1, the differences between the published and the re-estimated Lap is less than 0.7% on average, with a standard deviation of 1.8%, and a maximum difference of 9%. However, for the 400SD catalogue (orange triangles in Fig. 6), the ratio of the two quantities systematically increases with luminosity. This is due to the impact of different K-corrections: the value estimated by Burenin et al. (2007), recovered from the flux to published luminosity ratio, decreases more steeply with z than our K-correction and therefore yields higher luminosities. We verified that this different behavior of the K-correction is in turn essentially due to a different slope of the assumed L500–T relation. Burenin et al. (2007) estimated the temperature from the L500–T relation of Markevitch (1998), which has a shallower slope than that from REXCESS (αT ~ 2 compared to αT ~ 3), and which therefore yields higher temperatures at high luminosities.
Finally, there are two prominent unexplained outliers, MCXCJ0458.9-0029 (z = 0.015) and MCXC J1329.4+1143 (z = 0.023), corresponding to two 400SD clusters with Lap ~ 1043 erg s−1. We found that the published luminosity and flux measurements for these objects are inconsistent, and correspond to a K-corrections of K = 0.47 and K = 0.77, respectively. At these nearby redshifts the K-correction should be very close to unity.
The above (mostly minor) differences contribute to the difference between MCXC-I and MCXC-II L500 luminosities, which is discussed in detail in Sect. 6.1.
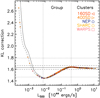 |
Fig. 5 KL-correction factor, the ratio of the luminosity in [0.1–2.4] keV energy band to that in the [0.5–2.] keV band. The theoretical variation with luminosity, for z = 0 and z = 0.5 are shown with solid and dashed lines, respectively. Here the dependence on temperature KL(T) has been translated to a variation with luminosity via the L500–T relation. The redshiſt dependence is a small translation in the L500KL plane via the E(z) factor. The horizontal lines show the value for a 1044 erg s–1 cluster at z = 0 (solid), ±2% (dashed) or ±10% (dotted), respectively. The points show the KL-correction (Eq. (3)) applied to the 400SD, 160SD, NEP, SHARC, and WARPS clusters (for which the catalogue flux is given in the [0.5–2.] keV band). Each point corresponds to a cluster from these samples; the temperature being estimated from the iterative procedure described in Sect. 4.1. |
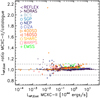 |
Fig. 6 Aperture luminosity estimated from the flux using the iterative procedure described in Sect. 4.1 compared to the luminosity published in the corresponding input catalogue. Only objects in the original MCXC-I input catalogues with unchanged redshiſt are shown. |
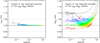 |
Fig. 7 Impact of the change in the evolution factor of the L500–M500 relation (Sect. 4.5). The L500 and M500 values were estimated using the iterative procedure described in Sect. 4.1. Left: Ratio of L500 estimated with the recalibrated L500–M500 relation evolving as E(z)−2 (Eq. (9)) to the value obtained with REXCESS relation (E(z)−7/3 evolution). Ratios are colour-coded according to cluster luminosity and plotted as a function of redshifts. Right: Same for the mass, M500. The curves show the theoretical ratio for different luminosity ratios (see Sect. 4.5). |
4.5 Effect of the correction of the evolution factor in the L500–M500 relation
Following the full iterative process described in Sect. 4.1, we computed the L500 and M500 values from the flux for the new L500–M500 relation. For comparison, we reran the process for the REXCESS relation used in the construction of the original MCXC-I:
 (10)
(10)
These results are denoted  and
and  , respectively.
We expect a only small effect on L500 as the change in evolution factor only affects the aperture correction, via the value of R500 which scales as  . Indeed the effect is less than 2% on L500, and negligible above z > 0.1. The counter-intuitive increase of the difference at low redshift (Fig. 7, left panel) is due to the larger aperture correction at these redshifts, where objects have smaller Rap/R500 on average.
The effect on M500 is therefore expected to be a direct consequence of the change in the parameters of the L500–M500 relation. The right-hand panel of Fig. 7 shows the ratio of the M500 values as a function of redshift. Cluster points are colour-coded by luminosity. The Figure also shows the theoretical variation of the ratio for different values of the luminosity. From Eq. (6), with parameters from Eqs. (9) and (10), the effect is expected to be small:
 (11)
(11)
At high z, the mass is affected by the weaker evolution factor. However, the mass is also affected by the corresponding re-calibration of the local mass slope (the normalisation at the pivot is changed by less than 0.2%). This is illustrated Fig. 7. Below z ~ 0.1 the mass evolution is negligible, but higher/lower luminosities correspond to lower/higher masses due to the (slightly) shallower mass slope. With decreasing z the median mass of the MCXC-II catalogue decreases (towards the group regime), and the slightly shallower mass slope yields a higher M500 on average. Above z ~ 0.1, a given luminosity corresponds to higher masses, an effect that increases with z due to the weaker evolution.
In summary, the effect of the change in the evolution factor is small: the median change in M500 is 1 .4%. In catalogue terms, 58% of the cluster masses are affected by less than 2%, 31% between 2% and 5%, and the maximum effect is only 15% (11% at z < 1).
4.6 Specific treatment of MACS clusters
Measurement of the X-ray luminosity of MACS clusters from RASS data alone is more uncertain than for other catalogues, because most of the objects are not resolved by construction. Following Piffaretti et al. (2011), we used the Chandra information, when available, as published in the catalogues (Ebeling et al. 2007; Mantz et al. 2010) or in follow-up work (Maughan et al. 2008; Mantz et al. 2010). However, for ten MACS_DR3 clusters, only RASS luminosities are available.
The published Chandra luminosities were derived from the flux and a K-correction estimated from measured temperatures, and can directly be used as input. After performing the energy band conversion when necessary, Piffaretti et al. (2011) relied directly on the published Chandra L500 values, and also used the corresponding M500 published in Maughan et al. (2008) and Mantz et al. (2010). The latter were based on mass proxies measured with Chandra YX and the gas mass, respectively. They may therefore differ from the R500 and M500 estimated from the L500–M500 relation we used in this work.
For consistency, we chose to derive L500 and M500 following the procedure used for other catalogues, as described in Sect. 4.1.
As in Piffaretti et al. (2011), we converted the bolometric luminosities from Maughan et al. (2008) into [0.1–2.4] keV band luminosities using the Chandra temperature and an apec plasme emission model. All other published MACS luminosities are in the [0.1–2.4] keV band.
-
We then performed the following aperture correction:
We considered the L500 and R500 values published by Maughan et al. (2008) and Mantz et al. (2010) as Lap and Rap values, and re-estimated L500 with our standard aperture correction procedure when the aperture was known (Eq. (4)). This correction is in practice very small, with a ratio of new to original L500 values of 1.00 ± 0.02 for Maughan et al. (2008) and 0.99 ± 0.02 for Mantz et al. (2010), respectively.
When the aperture was not known, we applied a constant conversion factor based on the REXCESS profile shape, as described in Sect. 4.1. The RASS-selected total luminosities from Mann & Ebeling (2012) were converted to L500 by applying a conversion factor of 0.96. Similarly, the Chandra luminosity within R200 from Ebeling et al. (2007) was converted to L500 using a fixed conversion factor of 0.914, as the R200 value was not published. No correction was applied to the L500 published by Repp & Ebeling (2018), as R500 was not published.
Finally, the M500 values were estimated from the L500–M500 relation (Eq. (6)).
Statistical errors were propagated from the errors on the input luminosities, except for the RASS luminosities (Mann & Ebeling 2012) for which no uncertainties were published.
The resulting Chandra-based L500 for clusters in common between the various publications are in excellent agreement. Not surprisingly, the ratio between the L500 derived by Repp & Ebeling (2018) and that estimated by Mantz et al. (2010) is 1.01 ± 0.08, if we exclude the MACS J2243.3-0935 outlier. The independent study of Maughan et al. (2008) also agrees well with that of Mantz et al. (2010), with a derived L500 ratio of 0.97 and a standard deviation of 0.07. There is a slight offset with the values derived from Ebeling et al. (2007) for the six distant MACS_DR1 clusters in common, with a mean ratio of 0.85 and a standard deviation of 0.06.
As described in Sect. 2.4, some objects appear in several of the MACS studies, notably for the MACS_DR3 sample. For the choice of the final L500 and M500 to be included in MCXC-II, we gave higher priority to Chandra measurements than those derived from RASS, then to Chandra data with published aperture values and finally considered the size of the sample. This yields to the following sources of information for the MACS_DR2, DR3 or MISC sub-samples, in priority order: Mantz et al. (2010), Maughan et al. (2008), Ebeling et al. 2007, Repp & Ebeling (2018) and Mann & Ebeling (2012). This is summarised in Table 8, which also gives the number of clusters retained from each study.
The luminosity L500 of MACS clusters in MCXC-I and MCXC-II are in excellent agreement, with an error-weighted mean ratio of 1.017 ± 0.005 and a standard deviation consistent with the errors. This follows the agreement between various publications and the present standardisation. However, the MCXC-II M500 values differ significantly from those in MCXC-I, which were based on the published Chandra mass estimates. The sub-catalogue with the largest difference is that of Mantz et al. (2010), where the published mass estimates were obtained with the gas mass Mg as a mass proxy, assuming a constant gas mass fraction ƒg = 0.115. In contrast, the REXCESS data used to determine the M500 − YX relation used in the present work show a mass-dependent gas mass fraction with ƒg ∝ (M500 /2.5 × 1014 M⊙)0.21 (Pratt et al. 2009, see also Pratt et al. 2022). Taking into account that the gas mass integrated to R500 depends on the mass as  , one expects that the total mass depends on the assumed ƒg,500 relation as:
 (12)
(12)
and, thus, for the gas mass fraction, we have:
 (13)
(13)
Along with (second-order) aperture corrections, the above fully explains the difference in mass estimates between the two studies.
References for the input luminosity data for the different MACS sub-catalogues.
4.7 Specific treatment of EMSS clusters
As discussed by Piffaretti et al. (2011), the Einstein data reported by Gioia & Luppino (1994) does not allow for the estimation of aperture luminosity and we used their estimated total flux in the [0.3-3.5] keV band as input. When available, we relied, as in Piffaretti et al. (2011), on the more reliable ASCA measurements of Henry (2004). In that case, we used the total luminosity in the [0.5–2] keV band, after correction for the different cosmologies. The conversion to the [0.1–2.4] keV luminosity was done with the measured ASCA temperature. The derived values are ~ 1.61 higher than the MCXC values. This corresponds to the KL-correction, which was apparently missed for this one catalogue in the MCXC-I publication.
 |
Fig. 8 Pie chart representation of the catalogues and sub-catalogues contained in MCXC-II. RASS-based catalogues are depicted with ‘cold’ colours, while serendipitous catalogues are shown with ‘warm’ colours. The overall contribution of each (sub-)catalogue to MCXC-II is given by the percentage in the inner annulus. The exact number of objects represented by each percentage is given in Table 5. |
5 The MCXC-II catalogue
5.1 MCXC-II global characteristics
After completing the catalogue with new entries as discussed in Sect. 2, updating the redshift information as described in Sect. 3, and re-estimating the X-ray quantities as described in Sect. 4, we constructed MCXC-II, the revised version of the MCXC-I catalogue. The differences with MCXC-I are discussed in Sect. 6.1.
MCXC-II comprises a total of 2221 clusters. The catalogue provides 45 parameters for each cluster and the catalogue field names, units, and descriptions are given in Appendix D. The main information includes the cluster position and updated red-shift, L500 and M500 values, together with statistical errors on these quantities (which were not provided in MCXC-I).
The fractional contribution of each X-ray survey to MCXC-II is shown graphically in the pie-chart form in Fig. 8. Of the 2221 objects in the final MCXC-II catalogue, more than 76% were detected in the RASS-based surveys, with REFLEX and NORAS clusters making up 42% of the sample. The remaining clusters are from RXGCC and the serendipitous surveys.
In Fig. 9, we show the distribution on the sky of the MCXC-II catalogue in Galactic coordinates. The distribution of the clusters in the L500-z plane is shown in Fig. 10, which is a revised version of Fig. 4 of Piffaretti et al. (2011). We also show the corresponding distribution in the M500-z plane (right panel). Here, and in the following figures, the different input surveys are identified by different colours or symbols. When a cluster appears in several catalogues, the symbol refers to the catalogue that was used to derive the physical parameters for the object in question.
5.2 Redshift, luminosity and mass distribution
The distribution of the MCXC-II in the L500-z plane (Fig. 10), and consequently its distribution in the M500-z plane, illustrate the well-known effect of the X-ray selection. For essentially flux-limited surveys, the lowest detectable luminosity increases with increasing redshift, following the variation of the luminosity distance. On the other hand, the number of high mass/luminosity clusters decreases due to the evolution of the mass function, an effect amplified by limited sky coverage.
The MCXC-II cluster distribution reflects the different depth and sky coverage of the RASS and serendipitous survey, respectively. Based on deeper, pointed observations, serendipitous surveys detect lower flux/mass objects at all redshifts and use lower flux-cut selections. On the other hand, the limited sky coverage of the serendipitous surveys does not allow for the detection of the rarest most massive clusters, which are detected in a wide-area survey such as RASS (e.g. REFLEX/NORAS clusters). This effect is also apparent in the MCXC-II sky distribution plot for the different mass bins shown in Fig. 9.
The MACS catalogue, based on systematic follow-up of detections in the RASS Bright Source Catalogue (including unresolved), extends an all-sky coverage to a deeper depth, detecting high mass clusters up to higher z. This survey is the main contributor to the MCXC-II in the high mass range (M500 > 4 × 10¹⁴ M⊙) at z > 0.3 (39 MACS only clusters out of 49 X-ray detected clusters in total).
The MCXC-II redshift histogram is shown in Fig. 11. Most (92%) of the clusters are z < 0.4 redshift systems, with a small fraction reaching up to z = 1. The redshift distribution of the RASS catalogues is dominated by low-z systems, with a median at z = 0.11, and the most significant fraction in the z = 0.05 bin. In contrast, the serendipitous surveys have a flatter red-shift distribution, scattered over all z, with a slight excess in the middle-z range [0.1–0.3]. This redshift difference between RASS and serendipitous surveys is again due to the greater depth of the serendipitous surveys.
As shown in the right-hand panel of Fig. 10, the MCXC-II covers a three-decade mass range. The twenty objects with M500 ≤ 1013 M⊙ correspond to very nearby massive galaxy-scale systems. A total of 602 objects (27%) are group-scale systems with 1013 < M500 < 1014 M⊙, while the remaining 1599 entries are cluster-scale systems with M500 ≥ 1014 M⊙.
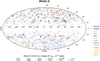 |
Fig. 9 Sky distribution of the MCXC-II clusters. |
 |
Fig. 10 Luminosity, L500, in the energy band [0.1-2.4] keV (left) and mass M500 (right) of the 2221 MCXC-II clusters, plotted as a function of redshiſt. Source catalogues are identified by different symbols and colors as labelled in the figure. The horizontal lines roughly delimit the group and cluster mass regimes. |
5.3 Uncertainties on L500
Figure 12 shows the relative statistical uncertainty on L500,  , plotted as a function of redshift16. The histograms of the errors for each are shown on the right panel of Fig. 1217. The median uncertainty values for each survey are given in Table 9. Errors are typically about ±20%.
The median errors range from 10% to 25%, with no systematic difference between RASS and serendipitous surveys. This is likely due to the fact that survey flux limits of RASS and serendipitous surveys are defined in a similar fashion, usually based on completeness or by setting a minimum signal-to-noise ratio (S/N) for the detection (the relative flux uncertainty).
The exception is the error for MACS and EMSS_2004 clusters  and 6.5%, respectively), as luminosities are mostly based on more precise Chandra or ASCA follow-up data (see Sects. 4.6 and 4.7).
The width of the  distribution reflects the luminosity range of each survey, as, above the flux limit,
  decreases with increasing L500. This is the largest for NORAS/REFLEX, which covers the full mass/luminosity range in the local (z < 0.1) Universe.
 |
Fig. 11 MCXC redshiſt distribution, with histograms coloured by source catalogue as given in the legend. |
Median statistical error on L500 of clusters from the different input catalogue.
5.4 Overlap
A total of 883 objects appear in more than one catalogue. For these clusters, we computed the luminosities L500 using the flux from each overlap catalogue (i.e. the overlap luminosity) as input, and using the same redshift and iterative method as described in Sect. 4.1. The resulting luminosities and their ratios are shown in Fig. 13.
Not surprisingly, we find the same trends as Piffaretti et al. (2011) who also compared the overlap luminosities to the MCXC-I value (their Figs. 7 and 8). There are no systematic differences in L500, with a median ratio of 1.00 ± 0.007 and a 68% standard deviation of [–0.07, +0.09] dex (~20%), excluding the new RXGCC data (676 points). The dispersion is slightly smaller than the 27% derived by Piffaretti et al. (2011), using input catalogue luminosities simply scaled by the distance-luminosity ratio when catalogue redshifts differed. Using the catalogue flux as input ensures more homogeneous L500 estimates, through the exact treatment of any redshift dependence and the use of the same K-correction models. Although the final effect is small, as discussed Sect. 6.1.3, this likely contributes to the decrease in scatter. When including the RXGCC overlap luminosities (1226 ratios), we find a median ratio of  and a slightly larger standard deviation of [–0.09, +0.10] dex (~24%).
We further quantified the differences between catalogues by making use of our estimate of the statistical errors. For the 883 objects with different luminosity estimates, we computed the weighted mean, L500,ovlp, and the difference in dex, of each measurement to the weighted mean Δlog(L500) = log(L500) – log(L500,ovlp)· This comparison is therefore fully independent of the exact choice of primary catalogue. We also considered Δlog(L500) normalised to the estimated statistical error, Δlog(L500)/σlog(L500). The 400SD is an extension of the extraction method developed for 160SD to all ROSAT pointings. As expected, the corresponding L500 for clusters in common are in excellent agreement, with a standard deviation of 4%. To avoid biasing the difference statistics, we only retain the 400SD value for these clusters, leaving us with 1926 luminosity estimates in total.
Figure 13 compares all the luminosities to the mean luminosity (left panel), while the differences are plotted on the right panel. The median value of Δlog(L500) is zero by construction. The overall 68% and 95% dispersion of Δlog(L500) are 0.05 and 0.18 dex, respectively. For purely statistical errors on independent measurements, Δlog(L500)/σlog(L500) should be well-represented by a Gaussian distribution with unit variance. Correlations between luminosities will decrease this scatter, and the presence of systematics will add to it. We do expect error covariance on luminosities derived from the same observations, as in the majority of cases (e.g. RASS data). The covariance depends in particular on exact data selection (e.g. choice of centre, point source excision, etc.) and it is impossible to estimate from the available published information in catalogues. Δlog(L500)/σlog(L500) therefore only provides an upper limit on systematics in units of statistical errors. The 68% and 95% dispersion of Δlog(L500)/σlog(L500) are [−0.8, +0.9] and [−3.1,+2.9], respectively. While the former is consistent with that of a Gaussian distribution, the latter is larger and may indicate a contribution from systematic errors in the tail of the distribution.
We did not find any trend of Δlog(L500) or Δlog(L500)/σlog(L500) with luminosity or redshift, or any marked difference between survey types. Only the EMSS values are more discrepant on average: there is a small and marginally significant underestimate of luminosities (median Δlog(L500)/σlog(L500) = −0.40 ± 0.3), with a 68% dispersion ([−1.8, +2.2]) that is twice as large.
There is some dependence on the aperture when this information is available. The ratio Δlog(L500)/σlog(L500) increases when the aperture differs significantly from R500, for Rap/R500 ≲ 0.5 (mostly for NEP clusters) or Rap/R500 ≳ 2 (mostly RXGCC clusters). For small apertures, the aperture correction is large and is sensitive to core properties, resulting in an overestimation of L500 for highly peaked cool-core clusters. For large aperture values, the aperture correction is small but increased point source contamination may be an issue.
In this connection, we also compared the luminosity measured from RASS and from deeper serendipitous (SER) catalogues, when both were available. Owing to higher resolution and generally deeper pointed observations, the SER luminosity estimates are expected to be less sensitive to point source contamination. For the 51 available pairs of values, we estimated the ratio of SER to RASS luminosities in log space, ∆log(L500) = log(L500, SER) − log(L500,RAss). There is a slight offset of the luminosity ratio of  dex, implying that SER values are 20% smaller on average, with a large 68% dispersion of [−0.24, +0.15] dex. The error on ∆log(L500), σ(∆log(L500)) was obtained from the quadratic sum of the RASS and SER luminosities, these measures being independent. Normalised by the statistical error, the median ratio offset is not very significant:
  .
.
As already noted by Piffaretti et al. (2011) for MCXC-I, there are several notable outliers. There are 30 cases of > 5σ deviation (see Fig. 13, bottom right). This includes four EMSS measurements, seven pairs of RASS estimates between RXGCC and REFLEX/NORAS or NEP values.
 |
Fig. 12 Relative statistical 1 σ error on the L500 luminosity. Input catalogues for each cluster are identified by different symbols and colours, as labelled in the figure. WARPS clusters are not shown since no uncertainties were published in the source catalogue. Left scatter plot of the relative uncertainty as a function of redshift. Right: Corresponding distribution of uncertainties for each input catalogue. The MACS catalogue includes a significant number of systems for which the luminosities come from Chandra follow-up observations, hence the smaller statistical uncertainties. |
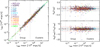 |
Fig. 13 Overlap luminosities. Left: comparison between the luminosity L500 for each detection of an MCXC-II cluster, computed from the primary or overlapping catalogue parameters, and their weighted mean value. Overlaps between 400SD and 160SD clusters have been excluded since the data are almost identical. Symbols and colours, as labelled in the figure, identify the input catalogue (primary or secondary). Right: difference in luminosity L500, in dex (top panel) and relative to the errors (bottom panel). Full horizontal line: median value; the dashed, dotted and dash-dotted horizontal lines marked the 68%, 90% and 95% dispersion around the median, respectively. |
Synthetic comparison table listing differences between MCXC-II and MCXC-I.
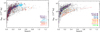 |
Fig. 14 Clusters in MCXC-II shown in the ɀ–M500 plane. Left panel: new objects marked in colour, which include new REFLEX-II clusters, new MACS clusters above ɀ = 0.3, and new RXGCC clusters, as well as NORAS, 400SD, and SGP clusters that were previously without redshift. Right panel: objects with revised redshifts (see Table. 6) are marked in colour, as labelled in the figure. The revised position (filled circle) is connected to the MCXC-I position (open circle). |
6 Discussion
6.1 Comparison with MCXC-I (Piffaretti et al. 2011)
A summary overview of the differences between MCXC-I and MCXC-II content and methods is given in Table 10.
6.1.1 Cluster content and redshift distribution
The MCXC-II cluster content and new redshift information is detailed in Sect. 2 and summarised in Fig. 2. MCXC-II includes 486 new clusters compared to MCXC-I: 22 from REFLEX-II, 24 from new MACS releases, 393 from RXGCC, and 47 from MCXC-I input catalogues (45 previously without redshift and two previously without luminosity). Figure 14 shows the distribution of the new clusters in the ɀ–M500 plane. Clusters with newly-available redshifts lie primarily at or near the flux limits of the corresponding catalogues. Inclusion of the RXGCC catalogue increases the number of clusters at low mass and low redshift: the new RXGCC clusters are at a median redshift ofz = 0.080, with a median mass of 1.1 × 10¹⁴ M⊙ (see also Fig. 11). On the other hand, the new MACS and REFLEX clusters significantly improve the coverage of the sparsely-represented high ɀ, high mass region.
One also notes the eight very massive new RXGCC clusters with M500 > 7.5 × 10¹⁴ M⊙ at ɀ > 0.25. One of these (MCXCJ0600.1–2007, RXGCC 229) coincides with an already known cluster detected by Planck (PSZ2G225.93-19.99), SPT (SPT-CLJ0600-2007), and Com-PRASS (PSZRX G225.95–20.01), and with a source from the ROSAT Bright Source Catalogue which is not included in the MACS catalogue. The remaining seven do not coincide with any sources from the Bright Source Catalogue, so they cannot be MACS clusters. However, they all have a very large aperture radius in RXGCC (Rsi𝑔/R500 > 3). It is therefore possible that the RXGCC flux (and mass) may have been overestimated due to the inclusion of additional sources in the aperture under consideration. For example, MCXC J1320.0 – 3556 (RXGCC 496, Rsi𝑔/R500 = 4.8) may have some contamination from the nearby cluster Abell S 729 (ɀ = 0.0499), as mentioned on the RXGCC catalogue website. Also, three of these seven objects coincide with known clusters from other catalogues, in which their estimated mass is lower than that derived by RXGCC. This is the case for MCXC J0957.4+6048 (RXGCC 333, Rsig/R500 = 7.5), MCXC J1249.6+4952 (RXGCC 466, Rsig/R500 = 5.9), and MCXC J1508.0+4033 (RXGCC 590, Rsig/R500=3.1), for which the mass derived from the RXGCC detection is higher than that derived from the ComPRASS or Planck detections: 14.45 vs 3.51 (ComPRASS); 7.83 vs 4.38 (Planck) and 3.44 (ComPRASS); and 7.59 vs 5.34 (ComPRASS), respectively, in 1014 M⊙ units.
We have systematically revised the cluster redshifts, which in MCXC-I were simply taken from the input catalogues. Using the NED and Simbad databases, in addition to new optical catalogues from large galaxy surveys, MCXC-II includes 39 revised redshifts, located across the full ɀ–M500 plane, as shown in Fig. 14. An interesting case is MCXC J1415.1+3612, previously estimated at ɀ ~ 0.7 in the WARPS catalogue, which now has a spectroscopic redshift of ɀ = 1.026.
The MCXC-II redshift revisions can also be compared to those adopted in the recent study by Migkas et al. (2020), which focussed on the subsample of 313 clusters in common between MCXC-I and their sample. Their critical review of the MCXC-I values was undertaken using spectroscopic red-shifts from various galaxy surveys available in NED, or redshifts from X-ray spectroscopic analysis (denoted ɀX in the following). They found generally good agreement between safe optical and independent X–ray redshifts (see Fig. 2 in Migkas et al. 2020). They decided to adopt ɀX for 41 clusters (with 0.03 < ɀ < 0.3) where there was insufficient optical spectroscopic data. The MCXC-II values for these clusters are in excellent agreement with ɀX. Taking into account statistical errors on ɀX kindly provided by K. Migkas (private communication) and potential intrinsic scatter, a BCES orthogonal power-law fit gives a slope of 1.01 ± 0.04 and a normalization of 1.005 ± 0.014 at a pivot of ɀ = 0.1. The intrinsic scatter is 5%. Two of the clusters with revised MCXC-II values, MCXC J1359.2+2758 (Abell 1831) and MCXC J1520.9+4840 (Abell 2064), with new redshifts z = 0.0751 and z = 0.0740, respectively, are now in good agreement with the X-ray values (ɀX = 0.078 ± 0.010 and 0.065 ± 0.006, respectively); the MCXC-I values, ɀMCXC = 0.061 and ɀMCxC = 0.108 were significantly different. There are eight other clusters of the Migkas et al. (2020) sample with updated MCXC-II values (two revised values and six consolidated), but the changes are small and remain in good agreement with the values chosen by Migkas et al. (2020).
Most of the redshift revisions have a large impact on the L500 and M500 estimates (see Fig. 15). However, the redshift revision affects only a small fraction, ~2%, of the MCXC-I clusters, illustrating the robustness of the original catalogue values. There is a caveat though: the revision is largely supported by mostly
Northern SDSS data, and the revision might be incomplete in the South (in particular for REFLEX clusters).
MCXC-II further provides information on the nature of the redshift (photometric, spectroscopic, estimated…) through Z_TYPE and the bibliographic reference for the redshift through Z_REF.
6.1.2 L500 and M500 derivation
A major difference between MCXC-II and MCXC-I is the procedure to derive homogenized L500 and M500 values. Rather than starting from published X-ray luminosities, we used the catalogue flux information and a fully consistent iterative procedure, with the use of the same L500–T and L500–M500 relations at all steps18. This approach allows us to include new redshifts and to propagate the statistical errors on directly measured quantities, therefore providing errors on L500 and M500. More importantly, the major advantage of this new approach is its flexibility. Red-shift updates or change of underlying models and scaling laws can be easily undertaken, in a fully consistent way. The method, including the corresponding equations, is detailed in Sect. 4.1. In the MCXC-II catalogue, we provide the standardised input flux and its uncertainty, together with related information necessary for the L500 estimates (e.g. energy band, aperture).
For instance, the user interested in updating the L500–M500 relation or the cluster density profile (or to study their impact) can start from the flux information given in MCXC-II and derive new L500 and M500, using Eq. (4) (combined with Eqs. (2) and (3) if the flux energy band is different from [0.1–2.4] keV), Eqs. (5) and (6). This requires a double iteration, as described at the end of the section. The K and KL-correction can be computed with standard software such as XSPEC and the aperture correction from the equations given in Appendix B.2. For convenience, tabulated values of K and KL, for the energy bands used in the MCXC-II, and the aperture correction for the REXCESS density profile, are given in Appendix B.
6.1.3 L500 and M500 values
In Fig. 15, we compare the MCXC-II L500 and M500 estimates to the MCXC-I values (excluding the MACS and EMSS_1994 clusters for the reasons discussed above).
The main differences arise from redshift changes, as clearly visible at the top of both panels. The residual differences are shown in the middle and bottom panels, where we have excluded clusters with redshift changed by more than 5%. These differences in L500 and M500 for these systems reflect the cumulative effects of the model changes (Sect. 4.1).
The differences in L500 arise essentially from the estimate of the aperture luminosity:
The increasing scatter at low luminosity (L500 ≲ 1043 erg s−1) reflects the scatter in the ratio between the aperture luminosity computed from the flux (used in MCXC-II) to the luminosity value given in the input catalogues (used in MCXC-I). This is essentially due to truncation errors in the published values at low luminosities (Sect. 4.4 and Fig. 6). In addition, the effect of the more accurate KL-correction at low luminosities is also apparent for input catalogues with flux measured in the [0.5–2.] keV energy band (compare for example the ratio shape for 400SD clusters to that of Fig. 5).
At higher luminosities and in the cluster regime, the scatter in the MCXC-II to MCXC-I L500 ratio again reflects the ratio of computed to published Lap luminosities, but with the systematic differences now being due to the details of the K-correction. It is most prominent for the 400SD sub-catalogue (see Sect. 4.4).
The other model change, the L500–M500 relation, has a negligible effect on L500 as shown in Sect. 4.5.
Overall the effects of these changes are small, making up less than 10% in the cluster regime and across the majority of the group regime. They are nearly always smaller than the statistical errors (bottom panels), with only seven clusters showing a difference larger than 2σ, including the two strong 400SD outliers mentioned in Sect. 4.4.
The mass M500 differences first reflect the differences in L500. The new L500–M500 only slightly affects the differences, as its general impact is small (Fig. 7). At low mass (low redshift) the small increase in mass due to the new L500–M500 relation transfers the effect of the updated KL-correction onto L500. At high mass, high redshift, the mass increase amplifies the luminosity increase, when present.
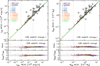 |
Fig. 15 Left: comparison between the MCXC L500 luminosities and the updated luminosities. Source catalogues are identified by different symbols and colours as labelled in the figure. MACS and EMSS_1994 clusters are not shown (see Sects. 4.6 and 4.7 for a description of specific treatment and comparison with MCXC-I). Clusters with redshift changed by more than 5% are marked by a box. Middle panel: ratio of luminosities for clusters with redshift changed by less than 5%. Bottom panel: same for the relative difference in terms of statistical error. The WARPS clusters without errors are not shown. Left: Same for the mass M500. |
6.2 Systematic uncertainties
The generic approach to homogenisation described above in Sect. 4.1 has notably allowed us to include uncertainties on the L500 estimates. These were derived from the fractional count rate or flux errors given in the original catalogues. In most cases, these represent purely statistical (Poisson) uncertainties. Exceptions are REFLEX/NORAS, where count rate errors include some small additional systematic error linked to the uncertainty in the determination of the plateau in the growth curve analysis, and BCS, which includes an additional 5% systematic uncertainty on the count rate error.
However, additional systematic uncertainties may still be present, due to certain modeling assumptions. These include:
Estimation of the plasma temperature, which is needed for the K and KL -corrections (Sect. 4.1). This is defined by the choice of L500-T relation, for which different studies have found widely varying slopes. This is particularly important at low L500 or T, where the slope is most uncertain (see e.g. the review by Lovisari et al. 2021, and references therein);
The plasma metallicity, which is an issue below about 2 keV, where line emission starts to become significant with respect to the bremsstrahlung continuum. We have assumed a standard metallicity of 0.3 Z⊙ for our analysis, which is typical in the region outside the core for both clusters and groups (see e.g. the recent review by Gastaldello et al. 2021, and references therein). The low-temperature group regime is also where the plasma emission codes are known to evolve significantly, owing to the increasing refinement of our knowledge of the atomic lines over time (e.g. Lovisari et al. 2021);
The aperture correction, which depends on the choice of L500–M relation used to relate the luminosity to the mass, and thus define the R500 aperture, and the density profile model assumed for the emission. As argued in Piffaretti et al. (2011), the choice of L500–M relation, and the effect of intrinsic scatter about that relation, has a negligible impact on the final luminosity due to the steep drop of the density profile model with radius. However, the choice of luminosity profile model does have an impact, which is discussed at length in Appendix A of Piffaretti et al. (2011). Defined on a representative X-ray selected sample, the REXCESS profile is clearly more representative of the X-ray cluster population than the commonly adopted β model. Additional systematic uncertainties associated with the adopted profile model will become particularly important when the aperture correction is large, or when the object is at low luminosity;
A final issue is related to possible sources of contamination. This will depend on the ratio of the aperture radius to R500, and will be particularly problematic when the aperture is too large compared to R500 or when cluster angular size is large. The latter could be an issue for very nearby systems.
The comparison between luminosities derived in different sub-catalogues in Sect. 5.4 and the discussion of trends with input parameters (e.g. fluxes, energy bands, apertures) has allowed us to estimate the systematics on luminosities to some extent. The L500 measurement is found to be very robust on average, with a median of  , with a standard deviation of [−0.09, +0.10]. However, while our computation of L500 does not depend on the adopted L500 – M relation (see discussion above), the M500 obviously does. We have followed Piffaretti et al. (2011), using the REXCESS L500–M500 relation, and assuming that the Malmquist bias of the individual sub-samples used to construct the MCXC is the same as that of REXCESS on average. If needed, the computation of different total masses using an alternative L500 – M relation is straightforward.
7 Conclusions
We have presented the construction and properties of the MCXCII, the second release of the Meta-Catalogue of X-ray detected Clusters of galaxies. MCXC-II was constructed from publicly available RASS-based (NORAS, REFLEX, BCS, SGP, NEP, MACS, CIZA, and RXGCC) and serendipitous (160SD, 400SD, SHARC, WARPS, and EMSS) cluster catalogues (see Sect. 2). Clusters with newly available redshifts from the NORAS, SGP, WARPS, and 160SD surveys were included (47 systems), in addition to new objects from the REFLEX II, MACS, and RXGCC catalogues (439 systems). MCXC-II additionally contains a complete sub-catalogue of all published MACS objects (Sect. 2.4.2). Duplicates and overlaps were exhaustively identified, leading to a final total entry count of 2221 objects. As in the first release, the information from these input catalogues was standardised and homogenised using a self-consistent approach that takes advantage of our knowledge of the structural and scaling properties of the cluster population (Sect. 4).
In this second release, we have significantly changed the homogenisation procedure. While in MCXC-I the published luminosities were homogenised, for MCXC-II, we have used when possible the original flux measurements to calculate a new luminosity for each object in the catalogue. This approach allows for more flexibility when adding new sub-catalogues or when redshift changes are introduced, and allows for the same input models to be used for the luminosity calculation. A comparison of our newly derived luminosities to those in the original catalogues shows an excellent agreement (Fig. 6), with any variations essentially attributable to differences in the choice of input models. We would encourage future publications to systematically include flux measurements, errors, and associated radii in their catalogue tables, as this is essential for the recalculation of luminosities.
Two significant extensions compared to MCXC-I are the inclusion of additional redshift information (and redshift updates when deemed necessary), and uncertainties on the luminosity values. The additional redshift information includes: Z_TYPE (spectroscopic, photometric, etc.), Z_REF (the reference for the redshift value), and Z_FLAG (indicating whether the redshift has changed from the value published in the original sub-catalogue). The luminosity uncertainties (Fig. 12) were computed from the flux errors in the input catalogues. A summary of the differences between MCXC-I and MCXC-II can be found in Table 10. For each object, MCXC-II now contains 46 catalogue fields, which are listed in Appendix D. MCXC-II will be accessible electronically at the M2C database19 and at the CDS.
MCXC-I has already been widely used by the community. MCXC-II now comprises essentially all ROSAT-based cluster catalogues where the cluster detection is based on measurements of X-ray source flux and extent. As an all-sky metacatalogue, it should therefore be useful for a better understanding of system-atics and survey selection when compared to other X-ray (e.g. eROSITA, for which the first catalogue was recently released in Bulbul et al. 2024), SZ, and optical catalogues. In this connection, we are currently working on a companion meta-catalogue of SZ-detected clusters, the MCSZ, which will shortly be made available.
Acknowledgements
We acknowledge funding from the European Research Council under the European Union’s Seventh Framework Programme (FP72007–2013) ERC grant agreement no. 340519, and from the French space agency, CNES. We thank E. Silva and D. Chapon for their contributions to the M2C database, and H. Ebeling for useful discussions. We thank K. Migkas for providing unpublished errors on the X-ray redshift errors, and for additional useful discussions. This research has made use of the SIMBAD and VizieR databases, operated at the Centre de Données astronomiques de Strasbourg (CDS20), Strasbourg, France, and the NASA/IPAC Extragalactic Database (NED21), operated by the Jet Propulsion Laboratory, California Institute of Technology. We made extensive use of data and software provided by the High Energy Astrophysics Science Archive Research Center (HEASARC22) which is a service of the Astrophysics Science Division at NASA/GSFC, data from the XMM-Newton Science Archive23, the Chandra Data Archive24 provided by the Chandra X-ray Center (CXC), the SWIFT Data Archive25, and the ROSAT all-sky Data Archive26 at HEASARC. We acknowledge the use of the ‘Aladin sky atlas’ developed at CDS (Bonnarel et al. 2000), Strasbourg Observatory, France and of the NASA’s SkyView facility27, and the TOPCAT28 software package (Taylor et al. 2005; Taylor 2022). We acknowledge the use of the RXGCC catalogue website29 and the X-CLASS website 30. This research has made use of data from the Sloan Digital Sky Survey (SDSS31), which is funded by the Alfred P. Sloan Foundation, the Heising-Simons Foundation, the National Science Foundation, and the Participating Institutions. SDSS is managed by the Astrophysical Research Consortium for the Participating Institutions of the SDSS Collaboration. It has also made use of data from 2dF32, and 6dF33 surveys, The results reported in this article are partly based on data obtained from the XMM-Newton observatory, an ESA science mission with instruments and contributions directly funded by ESA Member States and NASA.
Appendix A Note on individual clusters
Objects with names starting with WHL, WHY and RM are from the optical cluster catalogues of Wen & Han (2015); Wen et al. (2018); Rykoff et al. (2016) respectively and their quoted redshifts are the spectroscopic values from these sources. The richness of WHL and WHY objects, RL,500, are taken from the respective catalogues. For WHL objects, the richness is defined from the total r-band luminosity within R500 (Wen & Han 2015, eq. 16). The richness of WHY objects are estimated consistently within R500, using the total r-band luminosity within 1 Mpc, with a calibration from WH data (Wen et al. 2018, Eq. 6).
Clusters with names starting with X-CLASS and RXGCC are from the X-ray cluster catalogues of Koulouridis et al. (2021) and Xu et al. (2022). Their latest redshift values were retrieved from the corresponding databases 34. For better readability, we do not repeat the reference(s) in each section.
A.1 New clusters from MCXC source catalogues
Below are individual notes on NORAS or SGP clusters included in MCXC-II, for which the distance to the counterpart used for redshift estimates is large. In all cases, the association is supporting by converging evidence and/or a physical explanation of the offset.
A.1.1 NORAS clusters
MCXC J0909.3+5133: This source is associated with PSZ2G166.62+42.13. The separation distance, 2′, is typical of the Planck resolution. Fig. A.1.
MCXC J1016.2+4108: We associated this source with the SDSS cluster WHL J101620.6+410545 or RM J101620.6+410544.7 (ɀspec = 0.2782 from BCG) at a distance of D = 2.63′ = 0.55 θ500. The cross-identification with Abell 0958 in the NORAS catalogue might be incorrect in view of its distance (8.4′). WHL J101620.6+410545 is a rich cluster with RL,500 = 69. The SWIFT image and SDSS overlay confirm the association (see Fig.A.2).
MCXC J1310.4+2151: We cross-identified this source with RM J131022.2+215005.6 at a distance D = 1.97′ = 0.5θ500. It also matches the Planck cluster PSZ2G343.33+83.19. The XMM-Newton image shows that the cluster has an offset centre morphology, with a peak at the optical position. This, in combination with the RASS resolution, explains the positional offset of ~2′ .See Fig. A.3.
MCXC J1320.6+3746: This system is identified with Abell 1715 in the NORAS catalogue at a distance of 2.3′. It also coincides with RMJ132028.2+374623.3 (also known as WHL J132028.2+374623, with ɀspec = 0.2381 from the BCG) at a distance of 2.4′ = 0.56 θ500. The SWIFT image shows a very diffuse morphology with no clear peak, which may explain the offset.
MCXC J1331.5+0451: This source is identified with Abell 1715, at 1 .82′ separation in the NORAS catalogue. We also cross-identified MCXC J1331.5+0451 with the rich SDSS cluster RMJ133141.3+045315.5, or WHL J133141.3+045316 (ɀspec = 0.1710 from five galaxies) and the SZ cluster ACT-CL J1331.6+0452 at the same redshift (ɀ = 0.1723), at a distance of 2.4′ = 0.46 θ500. There is no XMM-Newton, Chandra, or SWIFT archival image.
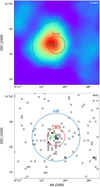 |
Fig. A.1 Planck MMF3 (top) and RASS (bottom) images centred on the MCXC J0909.3+5133 position. A green cross indicates the position of PSZ2 G166.62+42.13. The cluster apertures Rap = 9.5′, for the flux extraction, and R500 = 3.5′, are indicated in blue and red, respectively. The offset between the X-ray position and the SZ counterpart is due to the limited resolution of Planck. |
 |
Fig. A.2 Image cutouts centred on the position oſ MCXC J1016.2+4108 from RASS (left), Swift (centre), and SDSS9-i (right). The cluster apertures Rap = 5.5′ and R500 = 5′ are indicated in blue and red, respectively. We identified this NORAS cluster, previously without redshift, with the SDSS cluster WHL J101620.6+410545 (WH) or RMJ 101620.6+410544.7 (RM) at ɀspec = 0.2782. The offset between the X–ray peak (blue cross) and the optical centre (white circle, in the right image), D = 2.63′, is due to contamination by AGN emission from a cluster galaxy member, the QSO FBQS J101616.8+410812. The X-ray emission is peaked on this QSO, while diffuse emission extends mainly to the South (resolved in the Swift image), coincident with the concentration of the WHL spectroscopic redshiſts of cluster members (blue octagons). |
 |
Fig. A.3 Image cutouts centred at the position of MCXC J1310.4+2151 from RASS (top), XMM-Newton (centre), and SDSS9-i (bottom). The cluster apertures Rap = 7′ and R500 = 4′ are indicated in blue and red, respectively. The contours from the wavelet filtered XMM-Newton image are shown in green. We identified this NORAS cluster with the SDSS cluster RM J131022.2+215005.6 (RM) or WHL J131022.2+215006 (WH) at ɀspec = 0.2730. The distance between the optical position (white circle labelled WH, RM, in the right image) and the NORAS position (blue cross), D = 1.97′ = 0.5R500, is due to the cluster morphology, which is unresolved in RASS. The cluster has an offset-centre, possibly bimodal, morphology which is well resolved with XMM-Newton. The main peak is at the position of the optically-identified cluster. There is a secondary peak at the position of the cluster WHY J131028.6+215304 (white circle labelled WHY), located at a very similar redshift of ɀspec = 0.2691. The cluster may be in a pre- or post-merger state. The Abell 0958 cluster lies at 3.9′ to the East from the MCXC position. |
A.1.2 SGP clusters
MCXC J0012.9-0853: This source is matched to ACT-CL J0012.8-0855. The RASS position is likely biased (and the flux probably contaminated) by a point source to the North, which is well resolved in the SWIFT image, see Fig. A.4.
MCXC J0229.9-1316: We cross-identified this source with the [DZ2015] 408 group, from the catalogue of compact groups extracted by Díaz-Giménez & Zandivarez (2015) from the 2MASS catalogue of galaxies with spectra. The distance between the X-ray and optical position is D = 3.97′ = 0.42 θ500. As shown in Fig. A.5, the RASS image displays extended diffuse emission with all group galaxies inside θ500 or the virial group radius Rvir = 13′, estimated by Díaz-Giménez & Zandivarez (2015). This confirms the association.
MCXC J2355.1-2834: This source was identified with Abell 4054 in the NORAS catalogue. The redshift is ɀ = 0.1866 from De Propris et al. (2002), and the separation distance D = 2.2′ = 0.48 θ500. The cluster also matches WHY J235510.1-283212 (ɀ = 0.1884), a very rich cluster with RL,500 = 95.3. The offset, although large in terms of θ500, is likely explained by the RASS resolution.
MCXC J2356.0-0129: The source was identified with the [DZ2015] 540 group at ɀ = 0.038 (Díaz-Giménez & Zandivarez 2015), which has a virial radius estimated to Rvir = 33′. One of the galaxy members is the AGN MCG +00-01-003 at ɀ = 0.0370, located at D = 8.8′ from the group centre. The RASS image shows diffuse emission, centred on the AGN, which dominates the emission. This explains the offset of D = 8.82′ = 0.726θ500· See Fig. A.6.
 |
Fig. A.4 Image cutouts centred at the position of MCXC J0012.9-0853, from RASS (left), Swift (centre), and SDSS9-i (right). We identified this SGP cluster, previously without redshift, with the SZ cluster ACT-CL J0012.8-0855 at ɀspec = 0.3377 (ACT, magenta circle). This is a case of a complex structure with SZ clusters (PSZ2/ACT, green cross and magenta circles), and optical clusters (white circles) at very close redshifts, just South of the SGP position. In addition, there is bright QSO (WISEA J001247.92-084700.6 at ɀ = 0.22 from NED, cyan circle in the right panel) well resolved in RASS (as 1RXS J001248.7-084705), to the North, slightly beyond the R500 aperture (red circle). The contour of the wavelet-filtered image shows extended emission toward the cluster counterpart(s), with the SGP position likely biased North by the emission from the QSO. This would explain the offset. The SDSS image further illustrates the complexity of the cluster structure(s). In the right-hand panel, the galaxies with spectroscopic redshift from SDSS around ɀspec = 0.338 are marked with blue circles, as well as the ACT cluster (magenta circles), the PSZ2 detection (green cross) and the optical clusters (white circles). The richest optical cluster is WHL J001248.9-085535 (WH, ɀspec = 0.3356, RL,500 = 118.2, likely corresponding to WHY J001250.9-085537 (WHY1) at ɀphot = 0.3791, located slightly North of the position of ACT-CL J0012.8-0855, with a consistent redshift. Another ACT cluster, ACT-CL J0012.9-0857 (ɀspec = 0.3520), slightly less massive, coincides with the redMaPPer cluster, RM J001240.4-085628.3 (RM2), which lies at ɀspec = 0.3370 from the BCG. Both components likely contribute to the X-ray emission, and also to the Planck source PSZ2 G094.46-69.65 (ɀphot = 0.3521). The PSZ2 redshift comes from cross-identification with the second redMaPPer cluster, RM J001257.7-085829.5 (RM1) in the West. In addition, there is a fourth optical cluster, WHY J001306.5-085308 (WHY2) at ɀphot = 0.3655 lying to the East. All components likely contribute to the SGP cluster detection. For MCXC-II, the redshift is taken from that of the most massive component. |
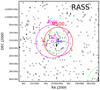 |
Fig. A.5 RASS image centred on the position of MCXC J0229.9-1316, an SGP cluster, previously without redshift. The green lines are the iso-contours from the wavelet-filtered RASS image, showing that the emission is extended. We identified this cluster with the [DZ2015] 408 group at ɀ = 0.0565 (Díaz-Giménez & Zandivarez 2015). Group spec-troscopic members are marked by magenta plusses and the group virial radius (Rrmvir = 13′) by a magenta circle. The group members are concentrated within R500 (red circle). The relatively large offset between the optical and X–ray centre of D = 3.97′ = 0.42R500 is due to the large angular size of the group, which lies at a very low redshift. |
 |
Fig. A.6 RASS image centred on MCXC J2356.0-0129 position, an SGP cluster previously without redshift. The X-ray emission is peaked on the AGN MCG+00-01-003 at ɀspec = 0.0370, a member of the [DZ2015] 540 group at ɀ = 0.038 (Díaz-Giménez & Zandivarez 2015). Other group members are marked by magenta plusses and the half-virial radius by a magenta circle. The contours from the wavelet filtered RASS image (green lines) show that the emission is extended, in the direction of the group centre, D = 8.8′ from the MCG galaxy member. We identified MCXC J2356.0-0129 with the [DZ2015] 540 group, noting that the emission is likely highly contaminated by a non-central AGN group member, which explains the offset between the X–ray and optical positions. |
 |
Fig. A.7 MCXC J0034.2-0204, a complex structure with three components at two different redshifts. We have associated the two MCXC-I clusters and the RXGCC cluster because all of them cover the whole system. The left and right panels show the RASS and XMM-Newton images, respectively. The positions of the MCXC-I clusters MCXC J0034.2-0204 (ɀ = 0.0822, SGP) and MCXC J0034.6-0208 (ɀ = 0.0812, REFLEX) are marked with a light and dark blue cross, respectively. The position of RXGCC 27 (ɀ = 0.056) is marked with a small red circle. The corresponding solid and dashed circles represent the size θ500 of the clusters and the aperture radius of the detection (RAP in MCXC, RSIG in RXGCC). The green, orange, and magenta pluses represent the position of the NW, E, and SW components studied in Ramos-Ceja et al. 2019. |
A.2 Duplicates in MCXC
We discuss here duplicate cases for which the distance and/or the redshift or luminosity difference between the two clusters is large.
MCXC J0034.2-0204: Complex system with three components: E and SW at ɀ ~ 0.056, and NW (the most massive) at z ~ 0.082 (see Fig. A.7 and discussion on the XMM-Newton observation of this cluster in Ramos-Ceja et al. 2019). MCXC-I included two different clusters around this position: MCXC J0034.2-0204 (ɀ = 0.0822, SGP) and MCXC J0034.6-0208 (ɀ = 0.0812, REFLEX). The two of them are merged in Simbad as cluster ZwCl 0031-0220. Both have a similar flux (~8 × 10¹² erg s−1), which corresponds approximately to the sum of the NW and SW components measured by XMM-Newton. The two clusters seem to be the same RASS detection covering the three components, with the only difference being the cluster position: in REFLEX the detection is centred on the centroid while in SGP it is centred on the NW peak. Therefore, we have decided to merge them in MCXC-II. We have chosen MCXC J0034.2-0204 (SGP) as the primary detection because it is well centred on the most massive component (NW). RXGCC also includes a detection that covers the three components of this system (RXGCC 27), which is centred in between the NW and SW components, and has an assigned redshift of ɀ = 0. 056, corresponding to the SW component. Despite the redshift difference, the detection covers the whole system, so we have decided to associate them.
MCXC J1010.2+5430: MCXC J1010.2+5429 (ɀ = 0.047, NORAS) and MCXC J1010.2+5430 (ɀ = 0.045, 400SD), are both associated with WARP J1010.1+5430 (ɀ = 0.047) in NED. The ROSAT pointing observation clearly shows that there is only one cluster, with the NORAS position only slightly offset, by 0.9′. The much higher NORAS luminosity (nearly a factor of 6), is likely due to point source contamination. There are several point sources, including one as bright at the cluster, with the 10′ NORAS aperture. They are not resolved in the RASS image. In this case, the 400SD catalogue is chosen as the source catalogue.
MCXC J1311.7+2201: We associated the cluster MCXC J1311.7+2201 (ɀ = 0.1716, NORAS) and MCXC J1311.5+2200 (ɀ = 0. 266, eBCS). The XMM-Newton image shows that there is a single cluster, centred at the NORAS position. The eBCS position is offset by ~ 0. 6 R500 but the aperture well encompasses the bulk of the cluster emission as seen on the XMM-Newton image. We cross-matched MCXC J1311.7+2201 with the SDSS cluster, WHL J131146.2+220137 at 0.7′ (ɀspec = 0.1704 from 7 galaxies) or RM J131146.2+220137.2 (ɀspec = 0.1715 from BCG). This confirms the NORAS redshift value.
MCXC J1652.9+4009: Both MCXC J1652.9+4009 (ɀ = 0.1492, NORAS) and MCXC J1652.6+4011 (ɀ = 0.1481, eBCS) are associated with the same optical cluster NSC J165252+400906 (ɀ = 0.1492) in NED. MCXC J1652.9+4009 can also be matched to the SDSS cluster WHL J165253.2+400913 or RMJ165253.2+400912.9 at 0.46′ (ɀspec = 0.1493 from BCG) and RXGCC 679. There is no XMM-Newton or SWIFT image and only incomplete coverage at the border of a Chandra pointing. A single extended source, with a bimodal morphology, is apparent in the RASS image. The NORAS source position is well centred at the maximum, whereas the eBCS (and RXGCC) coordinates better match the centroid position. This likely explains the large position offset of ~0.6θ500.
 |
Fig. A.8 MCXC J0056.0-3732, a case in which the RXGCC position has an offset with respect to the X-ray peak due to a nearby point source. We have associated the MCXC and RXGCC clusters because both detections come from the same X-ray emission, although the RXGCC catalogue has chosen an incorrect redshift (from the nearby cluster Abell S 102) and its flux may be contaminated. The left and right panels show the RASS and XMM-Newton images, respectively. The positions of MCXC J0056.0-3732 (z = 0.163) and RXGCC 42 (z = 0.056) are marked with a light blue cross and a small red circle, respectively. The corresponding solid and dashed circles represent the size θ500 of the clusters and their aperture radius. The magenta plus represents the position of Abell cluster Abell S 102 (z = 0.056). |
MCXC J2350.5+2929: MCXC J2350.5+2929 (z = 0.1498, NORAS) and MCXC J2350.5+2931 (z = 0.095, BCS), are both associated with ZwCl 2348.4+2908 (z = 0.15) in NED. The RASS image shows a regular extended emission, with a peak at the NORAS position, while the BCS position is slightly offset. However, there is a significant difference between the published MCXC redshifts. The NORAS value is confirmed by the cross-match with WHL J235035.1+292944 at 0.35' with zspec = 0.1526 from 15 galaxies or the recent study of Rines et al. (2016, z = 0.1542). The cluster is also identified with MS 2348+2913 and the BCS redshift is based on the EMSS reference. As discussed by Bottini (2001) this is the redshift of a foreground galaxy.
A.3 Cross-match between RXGCC and MCXC-II
MCXC J0056.0-3732: This cluster at z = 0.163 is close to another object at z = 0.056, Abell S 102 (see Fig. A.8). There is an RXGCC detection very close to MCXC J0056.0-373, slightly off-centred due to the presence of a nearby point source, and with an aperture radius that is large enough to also cover Abell S 102. Of the two redshift peaks found by RXGCC, the one assigned to the cluster (z = 0.056) corresponds to the galaxies situated around Abell S 102, not to those around MCXC J0056.0-3732. Due to the difference in redshifts, the RXGCC catalogue does not include the match with MCXC J0056.0-3732. However, taking into account that the X-ray emission producing the RXGCC detection is from MCXC J0056.0-3732, we have associated them. We note that the RXGCC redshift is not correct and that its mass estimation, even with the correct redshift, may still be inaccurate due to the large aperture radius that includes Abell S 102.
MCXC J0909.1+1059: There are two likely pre-merging clusters visible in the XMM-Newton image at very close redshifts: z ~ 0.175 (main contribution) and z ~ 0.165 (fainter). Two ACT clusters are approximately centred at the two X-ray peaks: ACT-CLJ0909.2+1058 (zspec = 0.1764) and ACT-CL J0908.8+1102 (zspec = 0.1636). NORAS, BSC, EMSS, and RXGCC all detect the system as a single object covering both clusters, so we have decided to associate all of these detections. However, RXGCC provides a redshift of z = 0.165, while the other catalogues give z = 0.175. We have taken NORAS as the primary detection, as its redshift corresponds to the main X-ray contribution. The RXGCC redshift is likely different due to its being photometric, and it may have contamination from the secondary cluster.
MCXCJ0956.4-1004: this is the supercluster Abell 0901-Abell0902, which has three components at z = 0.163: Abell 0901a (N-E), Abell0901b (N-W) and Abell0902 (S). It is detected by REFLEX and RXGCC. The REFLEX position is in between the three components, with an aperture radius that covers all the emission. The RXGCC position is centred on component Abell 0901a with a smaller aperture radius that does not cover all the emission. Since the morphology is different from an AB model, the derived L500 is not accurate. According to Gilmour et al. (2007), the main diffuse emission is around Abell 0901b, and there is also a fainter diffuse emission around Abell 0902. However, the emission in the region of Abell 0901a is a very bright point source rather than an extended emission. Therefore, the RXGCC detection seems to be driven by a point source and, for this reason, we have taken the REFLEX measurements as prime.
 |
Fig. A.9 MCXCJ1032.2+4015, a system with two components at different redshifts. We have associated the MCXC and RXGCC detections since both cover the whole system. The left and right panels show the RASS and XMM-Newton images, respectively. The positions of MCXCJ1032.2+4015 (z = 0.079) and RXGCC 363 (z = 0.068) are marked with a light blue cross and a small red circle, respectively. The corresponding solid and dashed circles represent the size θ500 of the clusters and their aperture radius. The orange and green pluses represent the position of two optical clusters: WHL J103214.0+401616, in the North with a spectroscopic redshift of z = 0.0745 (Wen & Han 2015), and WHL J103215.3+401012, in the South with a spectroscopic redshift of z = 0.0671 (Wen et al. 2009, 2010). The magenta plus shows the position of Abell cluster Abell1035. |
MCXCJ1032.2+4015: There are two nearby clusters visible in the XMM image (see Fig. A.9): a brighter cluster to the North, where SDSS shows many galaxies with zspec ~ 0.079, and a fainter cluster to the South, where SDSS shows many galaxies with zspec ~ 0.067. Both are detected as a single object by NORAS, eBCS, and RXGCC, so we have decided to associate all these detections. However, RXGCC provides a redshift of z = 0.068, while the other catalogues give z = 0.079. Since the main X-ray contribution is the cluster in the North, we have taken NORAS as the primary detection in this case.
MCXC J1601.3+5354: This is a line-of-sight superposition of two clusters at z = 0.065 and z = 0.107. They were detected as a single system by NORAS/eBCS and RXGCC, with different assigned redshifts (z = 0.1068 for NORAS, z = 0.065 for RXGCC). The GalWeight cluster catalog (Abdullah et al. 2020) finds both clusters and provides an estimation of their mass. Taking into account these masses and the luminosity distances, it seems that the most distant cluster would contribute more to the X-ray flux. Therefore, we have kept z = 0.1068 as the preferred redshift in MCXC-II.
MCXC J1659.6+6826: This detection is a collection of point sources dominated by two AGNs, which were classified as a cluster by NORAS and RXGCC with different assigned redshifts (z = 0.05 for NORAS and z = 0.037 for RXGCC). The two brightest point sources are a blazar at z = 0.05 at the NORAS/RXGCC position and NGC6289 at z = 0.036 at the position where RXGCC measured the redshifts of the galaxies. There may be a very poor group (three members) around NGC 6289 which is a potentially extended faint source (with a very small extension of 80″). The sum of the three brightest faint sources (from the ROSAT FSC) in the aperture radius agrees with the count rate of the NORAS cluster.
MCXC J1700.7+6412: This system at z = 0.225 is very close to another MCXC cluster, MCXC J1701.3+6414, at z = 0.45 (see Fig. A.10). The RXGCC detection is centred in between the two clusters and in extent it covers both of them plus a nearby point source. We have associated the RXGCC cluster (which has an assigned redshift of z = 0.239) to MCXC J1700.7+6412, because it is the stronger contributor to the X-ray emission. Since the RXGCC detection includes multiple sources, its flux and mass estimation may be inaccurate.
A.4 Revised redshift
We discuss below the rationale for the redshift revision of certain clusters, focussing on cases where the revision is particularly large (Sect. 3 and Table 6).
MCXCJ0016.3-3121: This is a SGP cluster identified with Abell 2571, located at 2.2′ from the X-ray centre (0.3R500). The catalogue redshift is based on the long-slit spectroscopic measurement of one galaxy close to the X-ray centre (1.9′) by Dalton et al. (1994). The study by De Propris et al. (2002) of known clusters within the 2dF Galaxy Redshift Survey gives a higher value, z = 0.106, based on 36 redshifts. We also cross-identified MCXCJ0016.3-3121 with WHY J001617.2-311938 (at 2.3′ offset) and RXGCC 16, both at consistent redshift, zspec = 0.1060 and z = 0.1065, respectively. In view of the redshift difference the original measurement is likely that of a foreground galaxy.
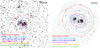 |
Fig. A.10 MCXC J1700.7+6412, a system with two components at different redshifts. MCXC detects the two components separately, while RXGCC detects the system as a whole. We have associated RXGCC to the MCXC with a stronger contribution to the X-ray emission. The left and right panels show the RASS and XMM-Newton images, respectively. The positions of MCXC J1700.7+6412 (z = 0.225) and MCXC J1701.3+6414 (z = 0.453) are marked with a light and dark blue cross, respectively. The position of RXGCC 687 (z = 0.239) is marked with a small red circle. The corresponding solid and dashed circles represent the size θ500 of the clusters and their aperture radius. The green and orange pluses represent the position of two optical clusters: WHL J170041.8+641259, with an spectroscopic redshift of z = 0.2350 (Wen & Han 2015), and WHLJ170123.5+641411, with an spectroscopic redshift of z = 0.4521 (Wen et al. 2009, 2010). The magenta plus shows the position of Abell cluster Abell 1035. |
MCXCJ0019.6+2517: The catalogue redshift z = 0.1353 is based on the dedicated NORAS follow-up (Böhringer et al. 2000). There are two WHL clusters very close to the X-ray centre: WHL J001941.3+251807 (z = 0.3657 from five galaxies) at 0.85′ (0.22θ500) and WHL J001939.4+251647 (z = 0.1336 from two galaxies) at 0.66' (0.22θ500). Their respective richnesses are RL,500 = 130 and RL,500 = 23. The XMM-Newton archive image shows a regular single cluster, with more than 21 DR17 galaxies at z ~ 0.36 within the X-ray contours, and two galaxies at z ~ 0.14. MCXCJ0019.6+2517 is clearly a superposition along the line of sight of a rich cluster at z = 0.365, and a more nearby group at z = 0.1353. MCXCJ0019.6+2517 is also detected at high S/N by Planck and is coincident at 0.85′ distance with RM J001941.3+251807.3 at zphot = 0.3709. We thus revised the redshift to z = 0.365, that of the likely main component.
MCXCJ0210.4-3929: MCXC J0210.4-3929 is a 160SD/WARPS cluster. It is a case of redshift mismatch listed by Piffaretti et al. (2011), who cross-identified WARPJ0210.4-3929 at z = 0.273 in the WARPS catalogue (Perlman et al. 2002) with RXJ J0210.4-3929 (VMF25) at z = 0.165 in the 160SD catalogue (Mullis et al. 2003). The close-by system MCXCJ0210.2-3932, located 4.1 distance to the South-West, is also a case of redshift mismatch between WARPJ0210.2-3932 (uncertain z = 0.19 ) and [VMF98] 024 (z = 0.168). Piffaretti et al. (2011) adopted the 160SD values: z = 0.168 (MCXC J0210.4-3929) and z = 0.165 (MCXC J0210.2-3932), while NED assigns MCXC J0210.4-3929 a redshift of z = 0.306 from cross-identification with the Ridl et al. (2017, X-CLASS catalogue).
The field was observed with XMM-Newton and both objects are in the X-CLASS catalogue: X-CLASS 2078 (MCXC J0210.4-3929) at z = 0.306 from eight galaxies and X-CLASS 2079 (MCXC J0210.2-3932) at z = 0.166 from three galaxies. Most of the redshifts are from the [MLF2006] catalogue (Mulchaey et al. 2006). An overlay of the position of the spectroscopic galaxies from the X-CLASS database onto the XMM-Newton image clearly confirms the respective redshifts of the two MCXC clusters. However, one of the [MLF2006] galaxies at z = 0.1655 (i.e. a MCXCJ0210.2-3932 member) is very close to the centre of MCXC J0210.4-3929. Therefore it is likely that the 160SD redshift was based on measurement of this foreground galaxy.
MCXCJ0507.7-0915: This is a REFLEX cluster cross-identified with Abell 0536, at Γ distance. The catalogue redshift, z = 0.0398, taken from Struble & Rood (1999), is based on one galaxy measurement(Valentijn &Casertano 1988). We cross-identified the cluster with WHY J050744.5-091526 (z = 0.14830) at 1′ distance and RXGCC 196 at a similarly consistent redshift (z = 0.1455). The redshift histogram in the RXGCC database shows a prominent peak at that redshift, with galaxies concentrated inside the X-ray contours. There is no galaxy peak around the REFLEX redshift value, which is likely that of a foreground galaxy.
MCXC J1011.4+5450: This is a 400SD cluster, matching the 160SD cluster, [VMF98] 086, at z = 0.294 from the dedicated 160SD follow-up (Mullis et al. 2003). It is also a WARPS cluster, WARPJ1011.5+5450, given at the same redshift (Horner et al. 2008).
This is one of the cases of mismatch between the MCXC redshift and redMaPPer photometric redshift (zphot = 0.3841 from Rozo et al. 2015) identified by Rozo & Rykoff (2014). The RM cluster, RM J101135.7+545005.3, corresponds to WHLJ101135.7+545005 with zspec = 0.3798 from one galaxy, confirming the photometric redshift. The ROSAT/PSPC image shows a bimodal structure, with a secondary, much fainter, peak at ~ 2.4′ to the West. The WARPS iso-contours (Horner et al. 2008, their Figure 2) and position correspond to that of the main peak, while the published 400SD position lies between the two peaks. The spectroscopic galaxy SDSS J101135.73+545005.0 (z = 0.3797 ± 0.0001 from the SDSS-DR17 release), the central galaxy of both the WHL and RM clusters in view of its position, is very close (0.21') to the X-ray maximum, further supporting the MCXC-SDSS cross-identification. The second closest SDSS spectroscopic galaxy is a brighter object at z = 0.2956, located at the western border of the secondary peak. This is likely the galaxy upon which the 400SD redshift is based, explaining the mismatch.
MCXC J1016.6+2448: MCXC J1016.6+2448 is a NORAS cluster cross-identified with Abell 0964, located at 0.5' distance. The catalogue redshift, z = 0.0811 is from dedicated follow-up but the number of galaxies is not specified. The cross-match with SDSS cluster catalogues gives WIIL J101636.5+244803, a rich cluster (RL,500 = 83.1) at 0.45′ distance with z = 0.1732 (from 21 galaxies), and RMJ101633.5+244843.9 at 0.63' distance with zspec = 0.1788 from BCG, obviously the SDSS detection of Abell 0964. The NORAS value is likely that of foreground galaxies.
MCXC J1017.5+5934: This is a NORAS cluster cross-identified with Abell 0959, located at 1 .3' from the X-ray detection. The catalogue redshift, z = 0.353 is based on two galaxy redshifts from Huchra et al. (1990b). This is one of the cases of mismatch between the MCXC redshift and redMaPPer photometric red-shift, identified by Rozo & Rykoff (2014) (zphot = 0.2891 from Rozo et al. (2015)). This lower value is confirmed by the dynamical analysis of Boschin et al. (2009) and the cross-identification with WHLJ101734.3+593340 at 0.37′, which lies at z = 0.2880 based on 14 galaxies (Wen & Han 2015).
MCXC J1159.2+4947: MCXCJ1159.2+4947 is a NORAS cluster identified with Abell 1430 (located at a distance a 1.85′ from the X-ray centre). Its redshift is zspec = 0.211, taken from Struble & Rood (1999), which refers to Kopylov et al. (1984). It is based on two galaxies. MCXC J1159.2+4947 is located 0.45′ away from RM J115914.9+494748.4 (zspec = 0.3501 from BCG) and 0.45′ away from WHL J115914.9+494748 (zspec = 0.3486 based on 13 galaxies, richness RL,500 = 138). An SDSS search within the X-ray contours yielded 29 spectroscopic redshifts including the BCG. RXGCC 437 is located at 0.94' distance and shows a clear redshift peak on the line-of-sight at z = 0.3435, with a second peak at z = 0.08. Three galaxies at z ~ 0.2, the NORAS catalogue value, are also visible. The original NORAS redshift is likely that of the two foreground galaxies. We adopted the redshift zspec = 0.3486 from Wen & Han (2015, WHL15).
MCXC J1340.9+3958: This 160SD/400SD cluster was cross-identified by Mullis et al. (2003) with Abell 1774, with a redshift z = 0.1690 from Kopylov et al. (1984). This publication is not available on ADS but Struble & Rood (1991), quoting this reference for Abell 1774, specifies that the redshift is based on two galaxies. However, Abell 1774 is located 3.5′ away from the X-ray peak, while WHL J134053.6+395755 is closer, at 0.56′, with z = 0.2772 from two galaxies. WHL J134053.6+395755 is also in the redMaPPer catalogue as RM134053.6+395754.8 at the same redshift. The ROSAT/PSPC and SWIFT images show a small cluster extent, with X-ray contours overlaid on the SDSS image supporting the cross-match with the RM and WHL cluster. There are more than ten galaxies with SDSS redshift z ~ 0.169 around the Abell 1774 position, confirming its redshift. Abell 1774 is a foreground object, but it remains unclear whether it can contaminate the 160SD cluster emission.
MCXC J1343.4+4053: This is a 160SD cluster with redshift zspec = 0.14 from Mullis et al. (2003) based on an unknown number of galaxies. MCXC J1343.4+4053 is located 0.13' from WHL J134325.6+405318 (zspec = 0.2546 based on two galaxies, richness RL,500 = 18.6) and 0.13′ from RM J134325.6+405317.7 (zspec = 0.2560 based on the central galaxy), on which the NED and Simbad preferred redshifts are based. We adopted the redshift zspec = 0.2560 from Rykoff et al. (2016, redMaPPer).
MCXC J1359.2+2758: This MCXC cluster corresponds to Abell 1831, in which Smith et al. (2004) identified two components (Abell 1831A and B) superposed along the line of sight. Abell 1831B seems to be richer with a higher velocity dispersion, and thus a priori Abell 1831B is more massive and likely to be the main contributor to the X-ray signal. We have updated its redshift to z = 0.07507 from Abdullah et al. (2020), the most recent reference, based on 75 galaxies.
MCXCJ1415.1+3612: The original redshift z = 0.7 is from Perlman et al. (2002) but mentioned by the authors as from noisy data, and the X-ray morphology indicates possible point-source contamination. The Simbad redshift is zspec = 1.027 from Koulouridis et al. (2021, X-CLASS) based on nine galaxies. We changed the redshift to zspec = 1 .026 from Huang et al. (2009) based on its determination from a larger number of galaxies, Nz = 25.
MCXC J1447.4+0827: This is a NORAS cluster with original redshift z = 0.1954 from dedicated follow-up (Böhringer et al. 2000). This object is now associated with a MACS DR3 cluster located 0.3′ away, lying at z = 0.38 based on optical data from SDSS (Mann & Ebeling 2012) . MCXC J1447.4+0827 can be matched to Planck, ACT, ComPRASS, Wen, and redMaPPer clusters. From Wen & Han (2015), the closest match is WHL 144726.0+082825 at 0.6′ (0.92′ from the MACS DR3 cluster) with zspec = 0.376 based on four spectra. The cluster is rich with RL,500 = 83.5700 and a number of galaxies N = 45. The ACT cluster has a redshift zspec = 0.375 based on redMaPPer, which is consistent with the redshift from the Wen et al. cluster. We changed the MCXC J1447.4+0827 redshift to zspec = 0.376 from Wen & Han (2015, WH15).
MCXC J1501.1+0141: The original redshift of this REFLEX cluster is z = 0.0050 (Böhringer et al. 2004), which is an average of two sources: Smith et al. (2000) at zspec ~ 0.00659 from spectroscopic data and NED information prior to 1992, without reference. The current NED redshift is z = 0.0065 from RXGCC 585 (Xu et al. 2022). Simbad associated the cluster with X-CLASS2301, with z = 0.005 (Koulouridis et al. 2021). This redshift is based on ~ 30 galaxies over a large region, ~ θ500 in radius with a biweight re-estimate of zspec = 0.00553 ± 0.00016. However, the XMM-Newton image shows that the emission is dominated by the NGC 5813 galaxy (located at 25″ from the X-ray peak) and its associated halo. All redshift references in NED and Simbad of NGC 5813 confirm z ~ 0.0065, with the latest being z = 0.00677 from Hamer et al. (2016). Since the X-ray emission is dominated by the NGC 5813 halo, we adopted the latter value.
MCXC J1520.9+4840: This is a NORAS cluster with an original redshift z = 0.1076. The catalogue redshift references are Struble & Rood (1987) (based on two galaxies) and J.P. Huchra (2000, private communication). The NED redshift is z = 0.0736 from RXGCC 602 Xu et al. (2022) consistent with the Simbad spectroscopic redshift z = 0.0738 from Rines & Diaferio (2006). We adopted the more recent and well-matched spectroscopic measurement zspec = 0.074 from von der Linden et al. (2007, based on Nz = 38 galaxies) The cluster also matches the GalWCat cluster #103 at z = 0.0735 from 24 galaxies.
MCXC J1544.0+5346: This is a 160SD cluster with an original redshift zspec = 0.112 from Mullis et al. (2003). Takey et al. (2011) associated this object with an extended source (35 arcsec extent) from the 2XMM catalogue and with WHLJ154407.3+534657 at zspec = 0.4970. In Simbad, MCXC J1544.0+5346 is also associated with X-CLASS 638 at zspec = 0.50 from SPIDERS spectroscopy (Koulouridis et al. 2021, four galaxies). There is an AGN (SDSS J154407.18+534559.6, 2XMMJ154407.2+534600) at z = 0.10911 (Nisbet & Best 2016) very close to the 160SD cluster centre, and a few galaxies around that redshift in the image. Presumably, the 160SD follow-up identified this galaxy as the cluster BCG, hence the incorrect redshift. One can also note that the original zphot from Vikhlinin et al. (1998) was zphot = 0.33. We adopted the redshift zspec = 0.50 from Koulouridis et al. (2021).
MCXC J1730.4+7422: The redshift of zspec = 0.110 (Böhringer et al. 2000) is from a dedicated follow-up and is thus a priori better than the previous redshift z = 0.041 from Appenzeller et al. (1998). However the cluster can be associated with RXGCC 724 (Xu et al. 2022) at 1.12' distance, with z = 0.0470. The histogram of redshifts from RXGCC shows only one galaxy at z = 0.1 and ~ 5 galaxies around z = 0.0470 located near the centre of the X-ray contours. The NGC 6414 galaxy at z = 0.054 is located 0.5' from the MCXC object and is an optical AGN (Zaw et al. 2019). The cluster was also imaged by XMM-Newton. The emission is dominated by this 'BCG' galaxy and it may be possible that the NORAS follow-up includes background objects. We changed to redshift to z = 0.047 based on Xu et al. (2022).
MCXC J2032.1-5627: This is a REFLEX cluster with original redshift zspec = 0.138 in Piffaretti et al. (2011). From the dedicated spectroscopic follow-up programme for the REFLEX clusters, there are in fact three different cluster redshifts for the given cluster position (Guzzo et al. 2009): (i) zspec = 0.08025, the redshift obtained from a low-S/N spectrum; (ii) zspec = 0.138 is an average of five galaxy redshifts; (iii) zspec = 0.285 is an average of six galaxy redshifts. The cluster is matched to SPT-CL J2032-5627 at the robust redshift zspec = 0.284 obtained from 32 cluster member spectra, as reported by Song et al. (2012). The authors describe it as a superposition of structures along the same line of sight. More details can be found in the paper’s appendix. Given the above, we have adopted zspec = 0.284 from Song et al. (2012).
MCXC J2135.2+0125: This is a REFLEX cluster cross-identified with Abell 2355, located at 2.7' separation. The original redshift z = 0.1244, with reference Struble & Rood (1999), is based on two galaxies. This is one of the cases of mismatch identified by Rozo & Rykoff (2014), between the MCXC redshift and redMaPPer photometric redshift (zphot = 0.234). The RM cluster, RM J213518.8+012527.0, corresponds to WHL J101135.7+545005, both located at 0.6'from the X-ray position, at zspec = 0.2301. This value is consistent with the redshift of the BCG of the RM cluster (zspec = 0.2306). MCXC J2135.2+0125 is also in the Planck and ACT catalogues and matches RXGCC 853 (z = 0.2324). The redshift histogram of RXGCC 853 shows two clear peaks, one at z = 0.1187 (the galaxies are mostly in the south, but one galaxy is very close to the Abell position) and the other at z = 0.2324 with galaxies centred on the X-ray cluster.
The REFLEX redshift is likely that of foreground galaxies. The WHL redshift is based on two galaxies. More redshifts are now available from SDSS-DR17, and we, therefore, re-estimated the cluster redshift to be z = 0.229 ± 0.004 from ten spectro-scopic galaxies.
MCXC J2306.5-1319: This is a REFLEX cluster with an original redshift z = 0.0659 based on two galaxies, estimated from the dedicated ESO Key Project follow-up. MCXC J2306.5-1319 also matches RXGCC 913 at a consistent z = 0.0683. We identified a potential counterpart, WHY J230621.3-131552, at 4.9' but at a discrepant redshift of z = 0.1095. WHY J230621.3-131552 matches Abell 2529, at z = 0.11 from Struble & Rood (1999). MCXC J2306.5-1319 is also close to the SGP cluster, MCXC J2306.8-1324, south-east of MCXC J2306.5-1319, at z = 0.0659. This redshift is based on two galaxies with a reference given as H. Boehringer & L. Guzzo, 1999, ESO Key Project, private communication, i.e. likely the same data as that used for MCXC J2306.5-1319.
The XMM-Newton observation, together with the information in the RXGCC database allows us to disentangle this case. There are two clusters, clearly separated in the XMM-Newton image, WHY J230621.3-131552 (A2529) in the north at z = 0.1095, and the SGP cluster in the south-east. The XMM-Newton emission of the latter is much fainter than that of the former. The position of the REFLEX cluster is in between, closer to WHY J230621.3-131552, with an extraction aperture encompassing both clusters. The RXGCC 913 ROSAT image does not resolve the two clusters either, but the maximum is at the WHY cluster location. The redshift histogram shows two peaks. A main peak is at z ~ 0.0683 with galaxies located in the south, consistent with the SGP redshift. There is a second peak at z = 0.1077, with galaxies concentrated in the north, around the WHY cluster position. In conclusion, this confirms the position and redshift of the SGP cluster, MCXC J2306.8-1324, which may be however contaminated by the more massive cluster in the North. The REFLEX (and RXGCC) detection is a confusion between the two objects at different redshifts but is dominated by the brighter component in the north. We thus changed the redshift to z = 0.1095.
MCXCJ2334.0+0704: This is a NORAS cluster initially associated with Abell 2620. The redshift is z = 0.099 from Struble & Rood (1999) with reference Fetisova et al. (1993). We note that the Abell position is about 9.7' away from the NORAS position, so the initial association is probably not correct. We found 20 galaxy redshifts from SDSS at z ~ 0.29 matching with the X-ray contours within 6' and more than half of these within 3'of the X-ray peak. The average z = 0.295 (0.2952±0.0022) based on these 20 galaxy redshifts was adopted for MCXC J2334.0+0704.
MCXC J2341.1+0018: This is a NORAS cluster with z = 0.11 from dedicated follow-up, with reference Katgert et al. (1998). The number of galaxies is not specified. We cross-identified the cluster with WHL J234106.9+001833 at 0.36'separation, lying at z = 0.2768 from four galaxies (RL = 41). This object also corresponds to a rich cluster in the RM catalogue, RMJ234105.4+001815.2 at consistent zphot = 0.2928. From the latest SDSS data, there are 18 spectroscopic redshifts including the BCG within the X-ray contours, with an average z = 0.2757 ± 0.0031, in agreement with the WHL value. The NORAS z estimate was likely based on foreground objects.
Appendix B K, KL and aperture corrections
B.1 K-correction factors
Table B.1 Details the K-correction as a function of redshift and temperature for the [0.1 - 2.4] and [0.5 - 2] keV energy bands. Table B.2 gives the KL-correction factor, the ratio of the luminosity in [0.1–2.4] keV energy band to that in the [0.5–2.] keV band, as a function of the temperature.
K-correction as a function of redshift for four different temperatures (1,2,4 and 10 keV) and for two energy bands of the ROSAT input flux, [0.5-2.] keV and [0.1-2.4] keV.
KL-correction factor, the ratio of the luminosity in [0.1 -2. 4] keV energy band to that in the [0.5-2.] keV band, as a function of the temperature, T, in keV.
A.2 B.2. Aperture correction
The luminosity within a given radius R scales as
 (B.1)
(B.1)
 (B.2)
(B.2)
where ρgas is the gas density profile and Rmax is the cluster radial extent. We adopted Rmax = 5R500. For a universal gas profile:
 (B.3)
(B.3)


The aperture correction is:
 (B.6)
(B.6)
 (B.7)
(B.7)
The numerical values for the REXCESS profile:
![${\rho _{gas}} \propto {\left( {{x \over {{x_c}}}} \right)^{ - \alpha }} \times {\left[ {1 + {{\left( {{x \over {{x_c}}}} \right)}^2}} \right]^{ - 3\beta /2 + \alpha /2}},$](/articles/aa/full_html/2024/08/aa49427-24/aa49427-24-eq52.png) (B.8)
(B.8)
with xc = 0.303, α = 0.525, and β = 0.768 are given in the Table B.3.
Aperture correction factor, the ratio of the luminosity within the aperture radius, Rap, to that within R500, as a function of the ratio Rap/R500.
B.3 Iteration convergence
We discuss here the convergence of the iterative process described in Sect. 4.1, which is used to determine the temperature, mass and luminosity. The convergence stems from the properties of the implicit equation that must verify the temperature. Combining the Eqs. 2, 3, 4, which provide the estimated luminosity from the input flux, and the L500-T relation (Eq. 5), the implicit equation on the temperature is of the form ƒ1 (T) = ƒ2(T) with:
 (B.9)
(B.9)
![${f_2}(T) = {K_{{\rm{L}},\left[ {{{\rm{E}}_1} - {{\rm{E}}_2}} \right]}}(T){K_{\left[ {{{\rm{E}}_1} - {{\rm{E}}_2}} \right]}}(T,z){f_{{\rm{ap }}}}\left( {{R_{{\rm{ap }}}}/{R_{500}}} \right)$](/articles/aa/full_html/2024/08/aa49427-24/aa49427-24-eq54.png) (B.10)
(B.10)
where ![${K_{{\rm{L}},\left[ {{{\rm{E}}_1} - {{\rm{E}}_2}} \right]}}(T)$](/articles/aa/full_html/2024/08/aa49427-24/aa49427-24-eq55.png) can be omitted if the input flux is given in the [0.1–2.4] keV energy band. The normalisation factor A of ƒ1 (T) is a constant for a given cluster, determined by its flux and redshift:
can be omitted if the input flux is given in the [0.1–2.4] keV energy band. The normalisation factor A of ƒ1 (T) is a constant for a given cluster, determined by its flux and redshift: ![$\left. {A = {A_{\rm{T}}}E{{(z)}^{ - {\beta _{\rm{T}}}}}/\left( {4\pi D_1^2(z){F_{{\rm{ap}},\left[ {{{\rm{E}}_1} - {{\rm{E}}_2}} \right]}}} \right)} \right)$](/articles/aa/full_html/2024/08/aa49427-24/aa49427-24-eq56.png) .
.
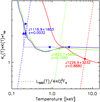 |
Fig. B.1 Illustration of the determination of the temperature for three 400SD clusters. The dashed line is the ƒ1(T) function, the luminosity corresponding to the temperature, T, given the L500-T relation, divided by the luminosity |

The left-hand side of the equation, ƒ1(T), is simply a power law with a slope of αT = 3, which is a very steeply increasing function of the temperature. The right hand function is slightly more complex:
For a fixed aperture correction, ƒ2(T) is essentially a decreasing function of T, except via the KL factor in the ~ [0.5– 2] keV band. Here KL increases mildly with T but much less steeply than the ƒ1(T) function (see Fig. B.1). In the typical cluster temperature range, 0.1–15 keV, there is only one intersection between the steeply increasing ƒ1 (T) and the mostly decreasing ƒ2(T) function, spanning a smaller range of variation. In other words, the T solution is unique. Furthermore, the convergence is rapid and the starting T0 point is not critical. After the first iteration, the temperature, T1 is where ƒ1(T) ∝ T3 is equal to ƒ2(T0), already close to the final value. The next iterations simply refine the T value, due to the milder variations of ƒ2(T) as compared to ƒ1 (T). This is illustrated in Fig. B.1, where we plot the ƒ1(T) and ƒ2(T) functions for three 400SD clusters, at very low red-shift, median redshift and high redshift. For this catalogue, the aperture correction is fixed but we have to apply a KL correction.
-
For cases of available aperture flux, the aperture correction, ƒap(Rap/R500) = L500/Lap in ƒ2(T) is itself determined iteratively and depends on the temperature of the iteration step in question. This dependence is via the computation of the current Lap, which appears in the corresponding implicit equation that has to be solved for R500. Combining Eq. 2 and Eq. 3, which determines Lap from the input flux, and the scaling relation in Eqs. 6 and 7, we must solve:
 (B.11)
where B is a constant for a given cluster. The solution always exists due to the restricted range of the aperture variation (see Table B.3) as compared to that of the right-hand power law. It is unique as the left hand and right hand functions in the equation increase monotonically with increasing R500. Generally, their intersection moves to the right in the log-log plane (that is, to higher R500 and aperture correction) for a higher iteration step temperature, as the normalisation of the power law increases (lower K corrections). The convergence is again rapid and is only weakly dependent on the starting point due to the steepness of the right hand power law. Note that this is this second iteration on R500 which in practice fixes the next iteration step temperature via the L500-M500 and L500–T scaling relations with the corresponding M500.
Appendix C OBSID of XMM-Newton observations
Table C.1 gives the XXMM-Newton OBSIDs that were used in catalogue validation.
List of XMM-Newton observations used in this work. Col. 1: MCXC-II cluster; Col. 2: Name of the target of the observations; Col. 3: OBSID.
Appendix D Catalogue content
Table D.1 gives an overview of the 46 fields contained in the MCXC-II catalogue.
We added an individual formatted note for 59 clusters that are displayed in the column NOTES. Each note comprises three components: 1) a simplified category code; 2) if the object is discussed in the paper, the corresponding Section location; and 3) a text note providing information concerning the cluster category code.
The category code covers eight different cases: (PLc) -Point-Like contamination: cluster emission contaminated by AGN (no AGN redshift available); (PLc_intra) - Point-Like contamination intra: cluster emission contaminated by AGN inside the cluster; (PLc_extra) – Point-Like contamination extra: cluster emission contaminated by foreground/background AGN; (complexStr) – Complex X-ray structure: cluster with sub-structures and/or close-by clusters on the plane of the sky; (Dupl) – Duplicate: two different objects in MCXC-I identified as one single object in MCXC-II; (losStr) – line-of-sight structure: structure on the line of sight; (XOoff) - Offset between the X-ray and Optical-counterparts as discussed in the paper; and (Other) - Any other useful information identified during the construction of MCXC-II.
Summary overview of catalogue fields.
References
- Abdullah, M. H., Wilson, G., Klypin, A., et al. 2020, ApJS, 246, 2 [Google Scholar]
- Abell, G. O. 1958, ApJS, 3, 211 [NASA ADS] [CrossRef] [Google Scholar]
- Abell, G. O., Corwin, Jr., H. G., & Olowin, R. P. 1989, ApJS, 70, 1 [NASA ADS] [CrossRef] [Google Scholar]
- Appenzeller, I., Thiering, I., Zickgraf, F.-J., et al. 1998, ApJS, 117, 319 [NASA ADS] [CrossRef] [Google Scholar]
- Arnaud, M., Pratt, G. W., Piffaretti, R., et al. 2010, A&A, 517, A92 [CrossRef] [EDP Sciences] [Google Scholar]
- Balestra, I., Mercurio, A., Sartoris, B., et al. 2016, ApJS, 224, 33 [Google Scholar]
- Beers, T. C., Flynn, K., & Gebhardt, K. 1990, AJ, 100, 32 [Google Scholar]
- Bleem, L. E., Stalder, B., de Haan, T., et al. 2015, ApJS, 216, 27 [Google Scholar]
- Böhringer, H., Voges, W., Huchra, J. P., et al. 2000, ApJS, 129, 435 [Google Scholar]
- Böhringer, H., Schuecker, P., Guzzo, L., et al. 2004, A&A, 425, 367 [NASA ADS] [CrossRef] [EDP Sciences] [Google Scholar]
- Böhringer, H., Chon, G., Collins, C. A., et al. 2013, A&A, 555, A30 [Google Scholar]
- Bonnarel, F., Fernique, P., Bienaymé, O., et al. 2000, A&AS, 143, 33 [NASA ADS] [CrossRef] [EDP Sciences] [Google Scholar]
- Boschin, W., Barrena, R., & Girardi, M. 2009, A&A, 495, 15 [NASA ADS] [CrossRef] [EDP Sciences] [Google Scholar]
- Bottini, D. 2001, AJ, 121, 1294 [CrossRef] [Google Scholar]
- Bulbul, E., Liu, A., Kluge, M., et al. 2024, A&A, 685, A106 [NASA ADS] [CrossRef] [EDP Sciences] [Google Scholar]
- Burenin, R. A., Vikhlinin, A., Hornstrup, A., et al. 2007, ApJS, 172, 561 [Google Scholar]
- Burke, D. J., Collins, C. A., Sharples, R. M., Romer, A. K., & Nichol, R. C. 2003, MNRAS, 341, 1093 [NASA ADS] [CrossRef] [Google Scholar]
- Campusano, L. E., Marinello, G., Clowes, R. G., et al. 2018, ApJ, 869, 145 [NASA ADS] [CrossRef] [Google Scholar]
- Caretta, C. A., Maia, M. A. G., Kawasaki, W., & Willmer, C. N. A. 2002, AJ, 123, 1200 [CrossRef] [Google Scholar]
- Chon, G., & Böhringer, H. 2012, A&A, 538, A35 [NASA ADS] [CrossRef] [EDP Sciences] [Google Scholar]
- Coziol, R., Andernach, H., Caretta, C. A., Alamo-Martínez, K. A., & Tago, E. 2009, AJ, 137, 4795 [NASA ADS] [CrossRef] [Google Scholar]
- Crawford, C. S., Allen, S. W., Ebeling, H., Edge, A. C., & Fabian, A. C. 1999, MNRAS, 306, 857 [CrossRef] [Google Scholar]
- Cruddace, R., Voges, W., Böhringer, H., et al. 2002, ApJS, 140, 239 [NASA ADS] [CrossRef] [Google Scholar]
- Cruddace, R., Voges, W., Böhringer, H., et al. 2003, ApJS, 144, 299 [NASA ADS] [CrossRef] [Google Scholar]
- Dalton, G. B., Efstathiou, G., Maddox, S. J., & Sutherland, W. J. 1994, MNRAS, 269, 151 [NASA ADS] [CrossRef] [Google Scholar]
- David, L. P., Forman, W., & Jones, C. 1999, ApJ, 519, 533 [NASA ADS] [CrossRef] [Google Scholar]
- De Propris, R., Couch, W. J., Colless, M., et al. 2002, MNRAS, 329, 87 [NASA ADS] [CrossRef] [Google Scholar]
- de Vaucouleurs, G., de Vaucouleurs, A., Corwin, H. G. Jr., et al. 1991, Third Reference Catalogue of Bright Galaxies (New York, NY (USA): Springer) [Google Scholar]
- Díaz-Giménez, E., & Zandivarez, A. 2015, A&A, 578, A61 [NASA ADS] [CrossRef] [EDP Sciences] [Google Scholar]
- Ebeling, H., Edge, A. C., Bohringer, H., et al. 1998, MNRAS, 301, 881 [Google Scholar]
- Ebeling, H., Edge, A. C., Allen, S. W., et al. 2000, MNRAS, 318, 333 [Google Scholar]
- Ebeling, H., Edge, A. C., & Henry, J. P. 2001, ApJ, 553, 668 [Google Scholar]
- Ebeling, H., Mullis, C. R., & Tully, R. B. 2002, ApJ, 580, 774 [Google Scholar]
- Ebeling, H., Barrett, E., Donovan, D., et al. 2007, ApJ, 661, L33 [Google Scholar]
- Ebeling, H., Edge, A. C., Mantz, A., et al. 2010, MNRAS, 407, 83 [NASA ADS] [CrossRef] [Google Scholar]
- Fetisova, T. S., Kuznetsov, D. Y., Lipovetskij, V. A., Starobinskij, A. A., & Olowin, R. P. 1993, Astron. Lett., 19, 198 [Google Scholar]
- Finoguenov, A., Rykoff, E., Clerc, N., et al. 2020, A&A, 638, A114 [NASA ADS] [CrossRef] [EDP Sciences] [Google Scholar]
- Gastaldello, F., Simionescu, A., Mernier, F., et al. 2021, Universe, 7, 208 [NASA ADS] [CrossRef] [Google Scholar]
- Gilmour, R., Gray, M. E., Almaini, O., et al. 2007, MNRAS, 380, 1467 [Google Scholar]
- Gioia, I. M., & Luppino, G. A. 1994, ApJS, 94, 583 [NASA ADS] [CrossRef] [Google Scholar]
- Gioia, I. M., Maccacaro, T., Schild, R. E., et al. 1990, ApJS, 72, 567 [NASA ADS] [CrossRef] [Google Scholar]
- Gioia, I. M., Henry, J. P., Mullis, C. R., et al. 2003, ApJS, 149, 29 [NASA ADS] [CrossRef] [Google Scholar]
- Guzzo, L., Schuecker, P., Böhringer, H., et al. 2009, A&A, 499, 357 [NASA ADS] [CrossRef] [EDP Sciences] [Google Scholar]
- Hamer, S. L., Edge, A. C., Swinbank, A. M., et al. 2016, MNRAS, 460, 1758 [Google Scholar]
- Henry, J. P. 2004, ApJ, 609, 603 [NASA ADS] [CrossRef] [Google Scholar]
- Henry, J. P., Mullis, C. R., Voges, W., et al. 2006, ApJS, 162, 304 [NASA ADS] [CrossRef] [Google Scholar]
- Hilton, M., Sifón, C., Naess, S., et al. 2021, ApJS, 253, 3 [Google Scholar]
- Holden, B. P., Nichol, R. C., Romer, A. K., et al. 1999, AJ, 118, 2002 [CrossRef] [Google Scholar]
- Horner, D. J., Perlman, E. S., Ebeling, H., et al. 2008, ApJS, 176, 374 [NASA ADS] [CrossRef] [Google Scholar]
- Huang, X., Morokuma, T., Fakhouri, H. K., et al. 2009, ApJ, 707, L12 [CrossRef] [Google Scholar]
- Huchra, J., et al. 1992, Z. Catalog. [Google Scholar]
- Huchra, J. P., Geller, M. J., de Lapparent, V., & Corwin, Harold G., J. 1990a, ApJS, 72, 433 [NASA ADS] [CrossRef] [Google Scholar]
- Huchra, J. P., Henry, J. P., Postman, M., & Geller, J., M. 1990b, ApJ, 365, 66 [CrossRef] [Google Scholar]
- Katgert, P., Mazure, A., den Hartog, R., et al. 1998, A&AS, 129, 399 [NASA ADS] [CrossRef] [EDP Sciences] [Google Scholar]
- Klein, M., Grandis, S., Mohr, J. J., et al. 2019, MNRAS, 488, 739 [Google Scholar]
- Klein, M., Hernández-Lang, D., Mohr, J. J., Bocquet, S., & Singh, A. 2023, MNRAS, 526, 3757 [NASA ADS] [CrossRef] [Google Scholar]
- Kocevski, D. D., Ebeling, H., Mullis, C. R., & Tully, R. B. 2007, ApJ, 662, 224 [Google Scholar]
- Kopylov, A. I., Fetisova, T. S., & Shvartsman, V. F. 1984, Astronom. Tsirkulyar, 1344, 1 [NASA ADS] [Google Scholar]
- Koulouridis, E., Clerc, N., Sadibekova, T., et al. 2021, A&A, 652, A12 [NASA ADS] [CrossRef] [EDP Sciences] [Google Scholar]
- Lauberts, A., & Valentijn, E. A. 1989, The surface photometry catalogue of the ESO-Uppsala galaxies (Garching: European Southern Observatory) [Google Scholar]
- Lovisari, L., Ettori, S., Gaspari, M., & Giles, P. A. 2021, Universe, 7, 139 [NASA ADS] [CrossRef] [Google Scholar]
- Mann, A. W., & Ebeling, H. 2012, MNRAS, 420, 2120 [NASA ADS] [CrossRef] [Google Scholar]
- Mantz, A., Allen, S. W., Ebeling, H., Rapetti, D., & Drlica-Wagner, A. 2010, MNRAS, 406, 1773 [NASA ADS] [Google Scholar]
- Markevitch, M. 1998, ApJ, 504, 27 [Google Scholar]
- Maughan, B. J., Jones, C., Forman, W., & Van Speybroeck, L. 2008, ApJS, 174, 117 [NASA ADS] [CrossRef] [Google Scholar]
- Migkas, K., Schellenberger, G., Reiprich, T. H., et al. 2020, A&A, 636, A15 [NASA ADS] [CrossRef] [EDP Sciences] [Google Scholar]
- Monteiro-Oliveira, R., Morell, D. F., Sampaio, V. M., Ribeiro, A. L. B., & de Carvalho, R. R. 2022, MNRAS, 509, 3470 [Google Scholar]
- Mulchaey, J. S., Lubin, L. M., Fassnacht, C., Rosati, P., & Jeltema, T. E. 2006, ApJ, 646, 133 [NASA ADS] [CrossRef] [Google Scholar]
- Mullis, C. R., McNamara, B. R., Quintana, H., et al. 2003, ApJ, 594, 154 [NASA ADS] [CrossRef] [Google Scholar]
- Nisbet, D. M., & Best, P. N. 2016, MNRAS, 455, 2551 [NASA ADS] [CrossRef] [Google Scholar]
- Orlowski-Scherer, J., Di Mascolo, L., Bhandarkar, T., et al. 2021, A&A, 653, A135 [NASA ADS] [CrossRef] [EDP Sciences] [Google Scholar]
- Perlman, E. S., Horner, D. J., Jones, L. R., et al. 2002, ApJS, 140, 265 [NASA ADS] [CrossRef] [Google Scholar]
- Piffaretti, R., Arnaud, M., Pratt, G. W., Pointecouteau, E., & Melin, J.-B. 2011, A&A, 534, A109 [NASA ADS] [CrossRef] [EDP Sciences] [Google Scholar]
- Planck Collaboration XXXII. 2015, A&A, 581, A14 [NASA ADS] [CrossRef] [EDP Sciences] [Google Scholar]
- Planck Collaboration XXVII 2016, A&A, 594, A27 [NASA ADS] [CrossRef] [EDP Sciences] [Google Scholar]
- Pratt, G. W., Croston, J. H., Arnaud, M., & Böhringer, H. 2009, A&A, 498, 361 [NASA ADS] [CrossRef] [EDP Sciences] [Google Scholar]
- Pratt, G. W., Arnaud, M., Maughan, B. J., & Melin, J. B. 2022, A&A, 665, A24 [NASA ADS] [CrossRef] [EDP Sciences] [Google Scholar]
- Quintana, H., & Ramirez, A. 1995, ApJS, 96, 343 [NASA ADS] [CrossRef] [Google Scholar]
- Ramos-Ceja, M. E., Pacaud, F., Reiprich, T. H., et al. 2019, A&A, 626, A48 [NASA ADS] [CrossRef] [EDP Sciences] [Google Scholar]
- Repp, A., & Ebeling, H. 2018, MNRAS, 479, 844 [NASA ADS] [Google Scholar]
- Ridl, J., Clerc, N., Sadibekova, T., et al. 2017, MNRAS, 468, 662 [NASA ADS] [CrossRef] [Google Scholar]
- Rines, K., & Diaferio, A. 2006, AJ, 132, 1275 [Google Scholar]
- Rines, K., Geller, M. J., Diaferio, A., & Kurtz, M. J. 2013, ApJ, 767, 15 [NASA ADS] [CrossRef] [Google Scholar]
- Rines, K. J., Geller, M. J., Diaferio, A., & Hwang, H. S. 2016, ApJ, 819, 63 [NASA ADS] [CrossRef] [Google Scholar]
- Romer, A. K., Nichol, R. C., Holden, B. P., et al. 2000, ApJS, 126, 209 [NASA ADS] [CrossRef] [Google Scholar]
- Rozo, E., & Rykoff, E. S. 2014, ApJ, 783, 80 [NASA ADS] [CrossRef] [Google Scholar]
- Rozo, E., Rykoff, E. S., Becker, M., Reddick, R. M., & Wechsler, R. H. 2015, MNRAS, 453, 38 [NASA ADS] [CrossRef] [Google Scholar]
- Rykoff, E. S., Rozo, E., Hollowood, D., et al. 2016, ApJS, 224, 1 [NASA ADS] [CrossRef] [Google Scholar]
- Shakouri, S., Johnston-Hollitt, M., & Dehghan, S. 2016, MNRAS, 458, 3083 [Google Scholar]
- Smith, R. J., Lucey, J. R., Hudson, M. J., Schlegel, D. J., & Davies, R. L. 2000, MNRAS, 313, 469 [NASA ADS] [CrossRef] [Google Scholar]
- Smith, R. J., Hudson, M. J., Nelan, J. E., et al. 2004, AJ, 128, 1558 [NASA ADS] [CrossRef] [Google Scholar]
- Sohn, J., Chon, G., Böhringer, H., et al. 2018, ApJ, 855, 100 [NASA ADS] [CrossRef] [Google Scholar]
- Song, J., Zenteno, A., Stalder, B., et al. 2012, ApJ, 761, 22 [NASA ADS] [CrossRef] [Google Scholar]
- Stocke, J. T., Morris, S. L., Gioia, I. M., et al. 1991, ApJS, 76, 813 [Google Scholar]
- Streblyanska, A., Barrena, R., Rubiño-Martín, J. A., et al. 2018, A&A, 617, A71 [NASA ADS] [CrossRef] [EDP Sciences] [Google Scholar]
- Struble, M. F., & Rood, H. J. 1987, ApJS, 63, 543 [NASA ADS] [CrossRef] [Google Scholar]
- Struble, M. F., & Rood, H. J. 1991, ApJS, 77, 363 [Google Scholar]
- Struble, M. F., & Rood, H. J. 1999, ApJS, 125, 35 [Google Scholar]
- Takey, A., Schwope, A., & Lamer, G. 2011, A&A, 534, A120 [NASA ADS] [CrossRef] [EDP Sciences] [Google Scholar]
- Tarrío, P., Melin, J. B., & Arnaud, M. 2019, A&A, 626, A7 [NASA ADS] [CrossRef] [EDP Sciences] [Google Scholar]
- Taylor, M. 2022, arXiv e-prints [arXiv:2211.16913] [Google Scholar]
- Taylor, M., Shopbell, P., Britton, M., & Ebert, R. 2005, in ASP Conf. Ser., 347, Astron. Soc. Pac. San Francisco, 29 [NASA ADS] [Google Scholar]
- Valentijn, E. A., & Casertano, S. 1988, A&A, 206, 27 [NASA ADS] [Google Scholar]
- Vikhlinin, A., McNamara, B. R., Forman, W., et al. 1998, ApJ, 502, 558 [Google Scholar]
- von der Linden, A., Best, P. N., Kauffmann, G., & White, S. D. M. 2007, MNRAS, 379, 867 [NASA ADS] [CrossRef] [Google Scholar]
- Wegner, G., Colless, M., Saglia, R. P., et al. 1999, MNRAS, 305, 259 [NASA ADS] [CrossRef] [Google Scholar]
- Wen, Z. L., & Han, J. L. 2015, ApJ, 807, 178 [Google Scholar]
- Wen, Z. L., Han, J. L., & Liu, F. S. 2009, ApJS, 183, 197 [NASA ADS] [CrossRef] [Google Scholar]
- Wen, Z. L., Han, J. L., & Liu, F. S. 2010, ApJS, 187, 272 [NASA ADS] [CrossRef] [Google Scholar]
- Wen, Z. L., Han, J. L., & Liu, F. S. 2012, ApJS, 199, 34 [Google Scholar]
- Wen, Z. L., Han, J. L., & Yang, F. 2018, MNRAS, 475, 343 [Google Scholar]
- Wetzell, V., Jeltema, T. E., Hegland, B., et al. 2022, MNRAS, 514, 4696 [NASA ADS] [CrossRef] [Google Scholar]
- Xu, W., Ramos-Ceja, M. E., Pacaud, F., Reiprich, T. H., & Erben, T. 2022, A&A, 658, A59 [NASA ADS] [CrossRef] [EDP Sciences] [Google Scholar]
- Zaw, I., Chen, Y.-P., & Farrar, G. R. 2019, ApJ, 872, 134 [NASA ADS] [CrossRef] [Google Scholar]
- Zaznobin, I. A., Burenin, R. A., Bikmaev, I. F., et al. 2019, Astron. Lett., 45, 49 [CrossRef] [Google Scholar]
A first revised version, including REFLEX-II and new MACS clusters published in 2012, was used in the validation of the Planck catalogue (Planck Collaboration XXXII 2015). An intermediate revised version, with updated content and revised redshifts, was put online in 2021 in the framework of the ERC M2C project: https://www.galaxyclusterdb.eu/m2c/
There is also some confusion between [VMF98] 168 and [VMF] 169, in the discussion of the corresponding MCXC-I clusters by Sohn et al. (2018). This is likely due to an inversion of the redshift of the two 160SD clusters in the original catalogue (Vikhlinin et al. 1998), which was subsequently corrected by Mullis et al. (2003). The MCXC-I positions and redshift are correct.
We note that NED lists the source RX J0857.7+2747 ([VMF98] 065) as a 𝓏 = 0.5 cluster. This source was invalidated by Mullis et al. (2003) and the XMM-Newton image confirms that it is indeed a superposition of point sources.
A first revision was performed in 2017–2019, which was used for the cross-identification of ComPRASS objects (Tarrío et al. 2019) and is the version available in the M2C Cluster Data Base opened in 2021. The new catalogues and/or the NED/Simbad information essentially confirm the redshifts in this previous revision, with the addition of new revision cases. A table of differences will be put on the M2C database page.
Used databases: https://xmm-xclass.in2p3.fr (Koulouridis et al. 2021) and https://github.com/wwxu/rxgcc.github.io/tree/master/ (Xu et al. 2022)
All Tables
Summary of new MCXC-II clusters from the NORAS and SGP catalogues, with newly identified redshifts.
Summary of new MCXC-II clusters from the 160SD catalogue (Vikhlinin et al. 1998; Mullis et al. 2003), previously classified as likely false.
MCXC-I cluster pairs at a separation distance of less than θ500, that are considered as the same object in MCXC-II.
Summary of the MCXC-II catalogues and sub-catalogues, the revised version of Table 1 from Piffaretti et al. (2011).
K-correction as a function of redshift for four different temperatures (1,2,4 and 10 keV) and for two energy bands of the ROSAT input flux, [0.5-2.] keV and [0.1-2.4] keV.
KL-correction factor, the ratio of the luminosity in [0.1 -2. 4] keV energy band to that in the [0.5-2.] keV band, as a function of the temperature, T, in keV.
Aperture correction factor, the ratio of the luminosity within the aperture radius, Rap, to that within R500, as a function of the ratio Rap/R500.
List of XMM-Newton observations used in this work. Col. 1: MCXC-II cluster; Col. 2: Name of the target of the observations; Col. 3: OBSID.
All Figures
|
Fig. 1 Separation distance d between each RXGCC candidate and its closest MCXC-II cluster is plotted against their relative separation distance in terms of the angular size of the MCXC-II cluster |
| In the text | |
|
Fig. 2 MCXC-II catalogue update summary diagram. Top panel: revision of catalogue content, from left to right: 1) removal of one false cluster and seven duplicates (Sect. 2.3) in the original MCXC-I catalogue (Piffaretti et al. 2011); 2) entries from new ROSAT-based catalogues (Sect. 2.4); 3) new entries from source catalogues not previously considered owing to a lack of redshift or luminosity information (Sect. 2.2). Bottom panel: redshift revision of MCXC-II redshift (Sect. 3) and new redshift sources (Sect. 2.2). |
| In the text | |
|
Fig. 3 Comparison between MCXC-II redshifts and spectroscopic redshift values from SDSS-based catalogues. The revised values discussed in Sect. 3 are marked in red, and connected to the MCXC-I values by a red line. Left panel: comparison with the closest potential counterpart from the Wen & Han (2015, WH) catalogue (see text). MCXC J0019.6+2517, labelled in the figure, is a line-of-sight structure where the main component is identified with the richest second-closest WH cluster. Right panel: same for redMaPPer clusters from the updated version of the catalogue of Rozo et al. (2015), published by Rykoff et al. (2016). |
| In the text | |
|
Fig. 4 K-correction as a function of redshiſt. Lines: Correction computed with an apec model for two energy bands of the ROSAT input flux, [0.5–2.] keV and [0.1–2.4] keV, and four different temperatures (1, 2, 4, and 10 keV). Each curve is labelled accordingly, with the information in the index and exponent, respectively. For instance: |
| In the text | |
|
Fig. 5 KL-correction factor, the ratio of the luminosity in [0.1–2.4] keV energy band to that in the [0.5–2.] keV band. The theoretical variation with luminosity, for z = 0 and z = 0.5 are shown with solid and dashed lines, respectively. Here the dependence on temperature KL(T) has been translated to a variation with luminosity via the L500–T relation. The redshiſt dependence is a small translation in the L500KL plane via the E(z) factor. The horizontal lines show the value for a 1044 erg s–1 cluster at z = 0 (solid), ±2% (dashed) or ±10% (dotted), respectively. The points show the KL-correction (Eq. (3)) applied to the 400SD, 160SD, NEP, SHARC, and WARPS clusters (for which the catalogue flux is given in the [0.5–2.] keV band). Each point corresponds to a cluster from these samples; the temperature being estimated from the iterative procedure described in Sect. 4.1. |
| In the text | |
|
Fig. 6 Aperture luminosity estimated from the flux using the iterative procedure described in Sect. 4.1 compared to the luminosity published in the corresponding input catalogue. Only objects in the original MCXC-I input catalogues with unchanged redshiſt are shown. |
| In the text | |
|
Fig. 7 Impact of the change in the evolution factor of the L500–M500 relation (Sect. 4.5). The L500 and M500 values were estimated using the iterative procedure described in Sect. 4.1. Left: Ratio of L500 estimated with the recalibrated L500–M500 relation evolving as E(z)−2 (Eq. (9)) to the value obtained with REXCESS relation (E(z)−7/3 evolution). Ratios are colour-coded according to cluster luminosity and plotted as a function of redshifts. Right: Same for the mass, M500. The curves show the theoretical ratio for different luminosity ratios (see Sect. 4.5). |
| In the text | |
|
Fig. 8 Pie chart representation of the catalogues and sub-catalogues contained in MCXC-II. RASS-based catalogues are depicted with ‘cold’ colours, while serendipitous catalogues are shown with ‘warm’ colours. The overall contribution of each (sub-)catalogue to MCXC-II is given by the percentage in the inner annulus. The exact number of objects represented by each percentage is given in Table 5. |
| In the text | |
|
Fig. 9 Sky distribution of the MCXC-II clusters. |
| In the text | |
|
Fig. 10 Luminosity, L500, in the energy band [0.1-2.4] keV (left) and mass M500 (right) of the 2221 MCXC-II clusters, plotted as a function of redshiſt. Source catalogues are identified by different symbols and colors as labelled in the figure. The horizontal lines roughly delimit the group and cluster mass regimes. |
| In the text | |
|
Fig. 11 MCXC redshiſt distribution, with histograms coloured by source catalogue as given in the legend. |
| In the text | |
|
Fig. 12 Relative statistical 1 σ error on the L500 luminosity. Input catalogues for each cluster are identified by different symbols and colours, as labelled in the figure. WARPS clusters are not shown since no uncertainties were published in the source catalogue. Left scatter plot of the relative uncertainty as a function of redshift. Right: Corresponding distribution of uncertainties for each input catalogue. The MACS catalogue includes a significant number of systems for which the luminosities come from Chandra follow-up observations, hence the smaller statistical uncertainties. |
| In the text | |
|
Fig. 13 Overlap luminosities. Left: comparison between the luminosity L500 for each detection of an MCXC-II cluster, computed from the primary or overlapping catalogue parameters, and their weighted mean value. Overlaps between 400SD and 160SD clusters have been excluded since the data are almost identical. Symbols and colours, as labelled in the figure, identify the input catalogue (primary or secondary). Right: difference in luminosity L500, in dex (top panel) and relative to the errors (bottom panel). Full horizontal line: median value; the dashed, dotted and dash-dotted horizontal lines marked the 68%, 90% and 95% dispersion around the median, respectively. |
| In the text | |
|
Fig. 14 Clusters in MCXC-II shown in the ɀ–M500 plane. Left panel: new objects marked in colour, which include new REFLEX-II clusters, new MACS clusters above ɀ = 0.3, and new RXGCC clusters, as well as NORAS, 400SD, and SGP clusters that were previously without redshift. Right panel: objects with revised redshifts (see Table. 6) are marked in colour, as labelled in the figure. The revised position (filled circle) is connected to the MCXC-I position (open circle). |
| In the text | |
|
Fig. 15 Left: comparison between the MCXC L500 luminosities and the updated luminosities. Source catalogues are identified by different symbols and colours as labelled in the figure. MACS and EMSS_1994 clusters are not shown (see Sects. 4.6 and 4.7 for a description of specific treatment and comparison with MCXC-I). Clusters with redshift changed by more than 5% are marked by a box. Middle panel: ratio of luminosities for clusters with redshift changed by less than 5%. Bottom panel: same for the relative difference in terms of statistical error. The WARPS clusters without errors are not shown. Left: Same for the mass M500. |
| In the text | |
|
Fig. A.1 Planck MMF3 (top) and RASS (bottom) images centred on the MCXC J0909.3+5133 position. A green cross indicates the position of PSZ2 G166.62+42.13. The cluster apertures Rap = 9.5′, for the flux extraction, and R500 = 3.5′, are indicated in blue and red, respectively. The offset between the X-ray position and the SZ counterpart is due to the limited resolution of Planck. |
| In the text | |
|
Fig. A.2 Image cutouts centred on the position oſ MCXC J1016.2+4108 from RASS (left), Swift (centre), and SDSS9-i (right). The cluster apertures Rap = 5.5′ and R500 = 5′ are indicated in blue and red, respectively. We identified this NORAS cluster, previously without redshift, with the SDSS cluster WHL J101620.6+410545 (WH) or RMJ 101620.6+410544.7 (RM) at ɀspec = 0.2782. The offset between the X–ray peak (blue cross) and the optical centre (white circle, in the right image), D = 2.63′, is due to contamination by AGN emission from a cluster galaxy member, the QSO FBQS J101616.8+410812. The X-ray emission is peaked on this QSO, while diffuse emission extends mainly to the South (resolved in the Swift image), coincident with the concentration of the WHL spectroscopic redshiſts of cluster members (blue octagons). |
| In the text | |
|
Fig. A.3 Image cutouts centred at the position of MCXC J1310.4+2151 from RASS (top), XMM-Newton (centre), and SDSS9-i (bottom). The cluster apertures Rap = 7′ and R500 = 4′ are indicated in blue and red, respectively. The contours from the wavelet filtered XMM-Newton image are shown in green. We identified this NORAS cluster with the SDSS cluster RM J131022.2+215005.6 (RM) or WHL J131022.2+215006 (WH) at ɀspec = 0.2730. The distance between the optical position (white circle labelled WH, RM, in the right image) and the NORAS position (blue cross), D = 1.97′ = 0.5R500, is due to the cluster morphology, which is unresolved in RASS. The cluster has an offset-centre, possibly bimodal, morphology which is well resolved with XMM-Newton. The main peak is at the position of the optically-identified cluster. There is a secondary peak at the position of the cluster WHY J131028.6+215304 (white circle labelled WHY), located at a very similar redshift of ɀspec = 0.2691. The cluster may be in a pre- or post-merger state. The Abell 0958 cluster lies at 3.9′ to the East from the MCXC position. |
| In the text | |
|
Fig. A.4 Image cutouts centred at the position of MCXC J0012.9-0853, from RASS (left), Swift (centre), and SDSS9-i (right). We identified this SGP cluster, previously without redshift, with the SZ cluster ACT-CL J0012.8-0855 at ɀspec = 0.3377 (ACT, magenta circle). This is a case of a complex structure with SZ clusters (PSZ2/ACT, green cross and magenta circles), and optical clusters (white circles) at very close redshifts, just South of the SGP position. In addition, there is bright QSO (WISEA J001247.92-084700.6 at ɀ = 0.22 from NED, cyan circle in the right panel) well resolved in RASS (as 1RXS J001248.7-084705), to the North, slightly beyond the R500 aperture (red circle). The contour of the wavelet-filtered image shows extended emission toward the cluster counterpart(s), with the SGP position likely biased North by the emission from the QSO. This would explain the offset. The SDSS image further illustrates the complexity of the cluster structure(s). In the right-hand panel, the galaxies with spectroscopic redshift from SDSS around ɀspec = 0.338 are marked with blue circles, as well as the ACT cluster (magenta circles), the PSZ2 detection (green cross) and the optical clusters (white circles). The richest optical cluster is WHL J001248.9-085535 (WH, ɀspec = 0.3356, RL,500 = 118.2, likely corresponding to WHY J001250.9-085537 (WHY1) at ɀphot = 0.3791, located slightly North of the position of ACT-CL J0012.8-0855, with a consistent redshift. Another ACT cluster, ACT-CL J0012.9-0857 (ɀspec = 0.3520), slightly less massive, coincides with the redMaPPer cluster, RM J001240.4-085628.3 (RM2), which lies at ɀspec = 0.3370 from the BCG. Both components likely contribute to the X-ray emission, and also to the Planck source PSZ2 G094.46-69.65 (ɀphot = 0.3521). The PSZ2 redshift comes from cross-identification with the second redMaPPer cluster, RM J001257.7-085829.5 (RM1) in the West. In addition, there is a fourth optical cluster, WHY J001306.5-085308 (WHY2) at ɀphot = 0.3655 lying to the East. All components likely contribute to the SGP cluster detection. For MCXC-II, the redshift is taken from that of the most massive component. |
| In the text | |
|
Fig. A.5 RASS image centred on the position of MCXC J0229.9-1316, an SGP cluster, previously without redshift. The green lines are the iso-contours from the wavelet-filtered RASS image, showing that the emission is extended. We identified this cluster with the [DZ2015] 408 group at ɀ = 0.0565 (Díaz-Giménez & Zandivarez 2015). Group spec-troscopic members are marked by magenta plusses and the group virial radius (Rrmvir = 13′) by a magenta circle. The group members are concentrated within R500 (red circle). The relatively large offset between the optical and X–ray centre of D = 3.97′ = 0.42R500 is due to the large angular size of the group, which lies at a very low redshift. |
| In the text | |
|
Fig. A.6 RASS image centred on MCXC J2356.0-0129 position, an SGP cluster previously without redshift. The X-ray emission is peaked on the AGN MCG+00-01-003 at ɀspec = 0.0370, a member of the [DZ2015] 540 group at ɀ = 0.038 (Díaz-Giménez & Zandivarez 2015). Other group members are marked by magenta plusses and the half-virial radius by a magenta circle. The contours from the wavelet filtered RASS image (green lines) show that the emission is extended, in the direction of the group centre, D = 8.8′ from the MCG galaxy member. We identified MCXC J2356.0-0129 with the [DZ2015] 540 group, noting that the emission is likely highly contaminated by a non-central AGN group member, which explains the offset between the X–ray and optical positions. |
| In the text | |
|
Fig. A.7 MCXC J0034.2-0204, a complex structure with three components at two different redshifts. We have associated the two MCXC-I clusters and the RXGCC cluster because all of them cover the whole system. The left and right panels show the RASS and XMM-Newton images, respectively. The positions of the MCXC-I clusters MCXC J0034.2-0204 (ɀ = 0.0822, SGP) and MCXC J0034.6-0208 (ɀ = 0.0812, REFLEX) are marked with a light and dark blue cross, respectively. The position of RXGCC 27 (ɀ = 0.056) is marked with a small red circle. The corresponding solid and dashed circles represent the size θ500 of the clusters and the aperture radius of the detection (RAP in MCXC, RSIG in RXGCC). The green, orange, and magenta pluses represent the position of the NW, E, and SW components studied in Ramos-Ceja et al. 2019. |
| In the text | |
|
Fig. A.8 MCXC J0056.0-3732, a case in which the RXGCC position has an offset with respect to the X-ray peak due to a nearby point source. We have associated the MCXC and RXGCC clusters because both detections come from the same X-ray emission, although the RXGCC catalogue has chosen an incorrect redshift (from the nearby cluster Abell S 102) and its flux may be contaminated. The left and right panels show the RASS and XMM-Newton images, respectively. The positions of MCXC J0056.0-3732 (z = 0.163) and RXGCC 42 (z = 0.056) are marked with a light blue cross and a small red circle, respectively. The corresponding solid and dashed circles represent the size θ500 of the clusters and their aperture radius. The magenta plus represents the position of Abell cluster Abell S 102 (z = 0.056). |
| In the text | |
|
Fig. A.9 MCXCJ1032.2+4015, a system with two components at different redshifts. We have associated the MCXC and RXGCC detections since both cover the whole system. The left and right panels show the RASS and XMM-Newton images, respectively. The positions of MCXCJ1032.2+4015 (z = 0.079) and RXGCC 363 (z = 0.068) are marked with a light blue cross and a small red circle, respectively. The corresponding solid and dashed circles represent the size θ500 of the clusters and their aperture radius. The orange and green pluses represent the position of two optical clusters: WHL J103214.0+401616, in the North with a spectroscopic redshift of z = 0.0745 (Wen & Han 2015), and WHL J103215.3+401012, in the South with a spectroscopic redshift of z = 0.0671 (Wen et al. 2009, 2010). The magenta plus shows the position of Abell cluster Abell1035. |
| In the text | |
|
Fig. A.10 MCXC J1700.7+6412, a system with two components at different redshifts. MCXC detects the two components separately, while RXGCC detects the system as a whole. We have associated RXGCC to the MCXC with a stronger contribution to the X-ray emission. The left and right panels show the RASS and XMM-Newton images, respectively. The positions of MCXC J1700.7+6412 (z = 0.225) and MCXC J1701.3+6414 (z = 0.453) are marked with a light and dark blue cross, respectively. The position of RXGCC 687 (z = 0.239) is marked with a small red circle. The corresponding solid and dashed circles represent the size θ500 of the clusters and their aperture radius. The green and orange pluses represent the position of two optical clusters: WHL J170041.8+641259, with an spectroscopic redshift of z = 0.2350 (Wen & Han 2015), and WHLJ170123.5+641411, with an spectroscopic redshift of z = 0.4521 (Wen et al. 2009, 2010). The magenta plus shows the position of Abell cluster Abell 1035. |
| In the text | |
|
Fig. B.1 Illustration of the determination of the temperature for three 400SD clusters. The dashed line is the ƒ1(T) function, the luminosity corresponding to the temperature, T, given the L500-T relation, divided by the luminosity |
| In the text | |
Current usage metrics show cumulative count of Article Views (full-text article views including HTML views, PDF and ePub downloads, according to the available data) and Abstracts Views on Vision4Press platform.
Data correspond to usage on the plateform after 2015. The current usage metrics is available 48-96 hours after online publication and is updated daily on week days.
Initial download of the metrics may take a while.