Open Access
Fig. 10
Download original image
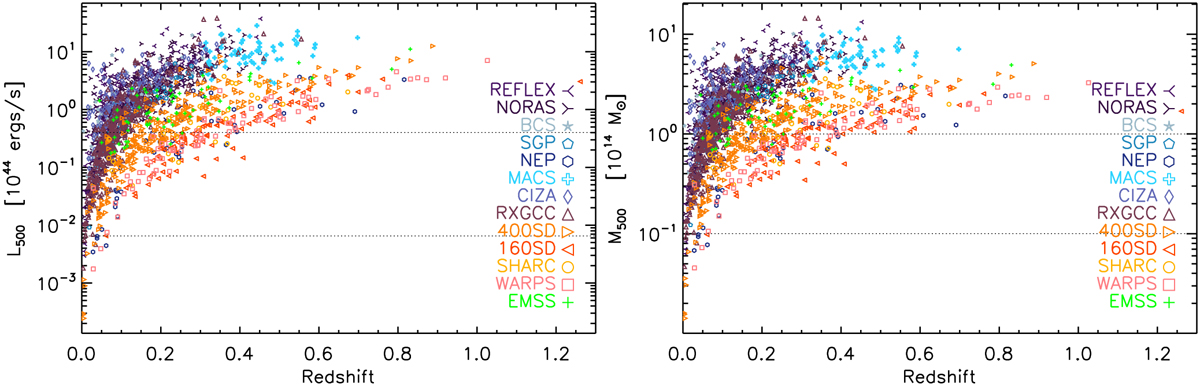
Luminosity, L500, in the energy band [0.1-2.4] keV (left) and mass M500 (right) of the 2221 MCXC-II clusters, plotted as a function of redshiſt. Source catalogues are identified by different symbols and colors as labelled in the figure. The horizontal lines roughly delimit the group and cluster mass regimes.
Current usage metrics show cumulative count of Article Views (full-text article views including HTML views, PDF and ePub downloads, according to the available data) and Abstracts Views on Vision4Press platform.
Data correspond to usage on the plateform after 2015. The current usage metrics is available 48-96 hours after online publication and is updated daily on week days.
Initial download of the metrics may take a while.