Fig. 4
Download original image
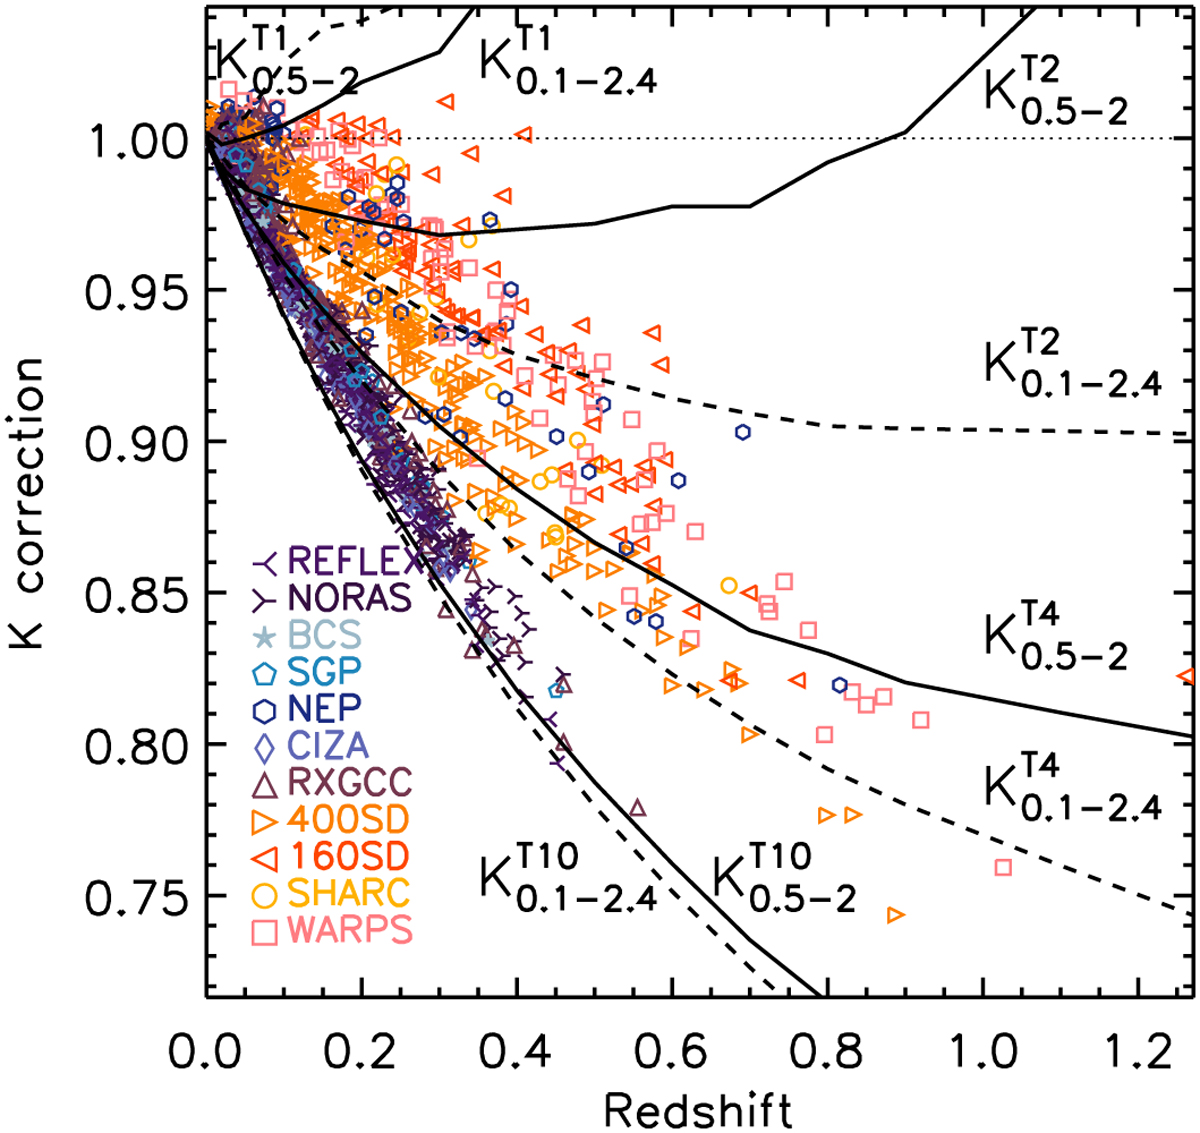
K-correction as a function of redshiſt. Lines: Correction computed with an apec model for two energy bands of the ROSAT input flux, [0.5–2.] keV and [0.1–2.4] keV, and four different temperatures (1, 2, 4, and 10 keV). Each curve is labelled accordingly, with the information in the index and exponent, respectively. For instance: ![]() is the K-correction for the flux in the energy band [0.1–2.4] keV and a cluster temperature of 10 keV. Points: K-correction for each object in the ROSAT catalogues with a measured flux; the temperature being estimated from the iterative procedure described in Sect. 4.1.
is the K-correction for the flux in the energy band [0.1–2.4] keV and a cluster temperature of 10 keV. Points: K-correction for each object in the ROSAT catalogues with a measured flux; the temperature being estimated from the iterative procedure described in Sect. 4.1.
Current usage metrics show cumulative count of Article Views (full-text article views including HTML views, PDF and ePub downloads, according to the available data) and Abstracts Views on Vision4Press platform.
Data correspond to usage on the plateform after 2015. The current usage metrics is available 48-96 hours after online publication and is updated daily on week days.
Initial download of the metrics may take a while.