Fig. 13
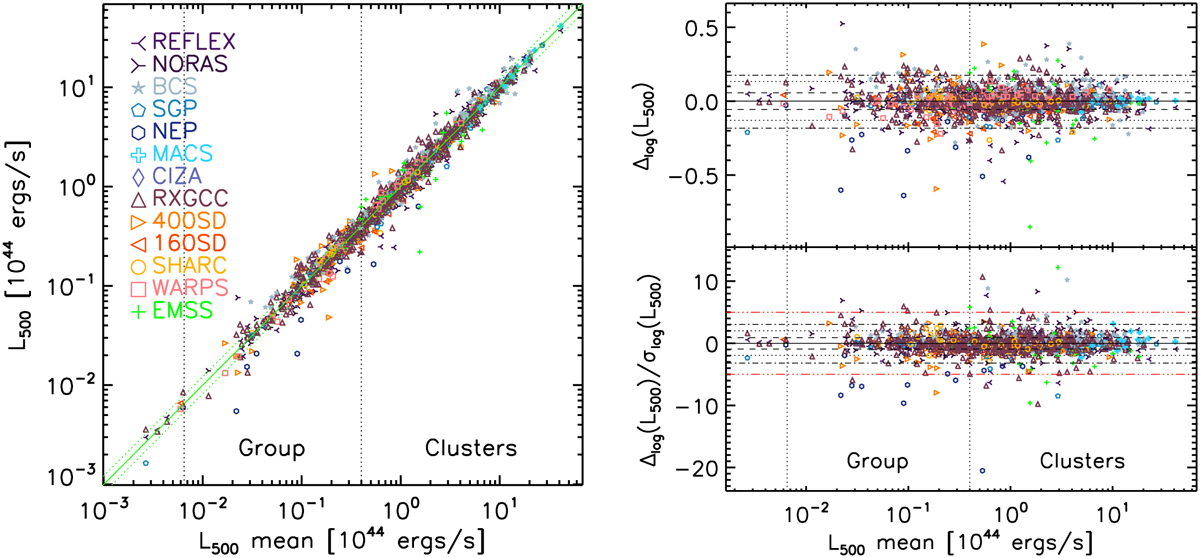
Download original image
Overlap luminosities. Left: comparison between the luminosity L500 for each detection of an MCXC-II cluster, computed from the primary or overlapping catalogue parameters, and their weighted mean value. Overlaps between 400SD and 160SD clusters have been excluded since the data are almost identical. Symbols and colours, as labelled in the figure, identify the input catalogue (primary or secondary). Right: difference in luminosity L500, in dex (top panel) and relative to the errors (bottom panel). Full horizontal line: median value; the dashed, dotted and dash-dotted horizontal lines marked the 68%, 90% and 95% dispersion around the median, respectively.
Current usage metrics show cumulative count of Article Views (full-text article views including HTML views, PDF and ePub downloads, according to the available data) and Abstracts Views on Vision4Press platform.
Data correspond to usage on the plateform after 2015. The current usage metrics is available 48-96 hours after online publication and is updated daily on week days.
Initial download of the metrics may take a while.