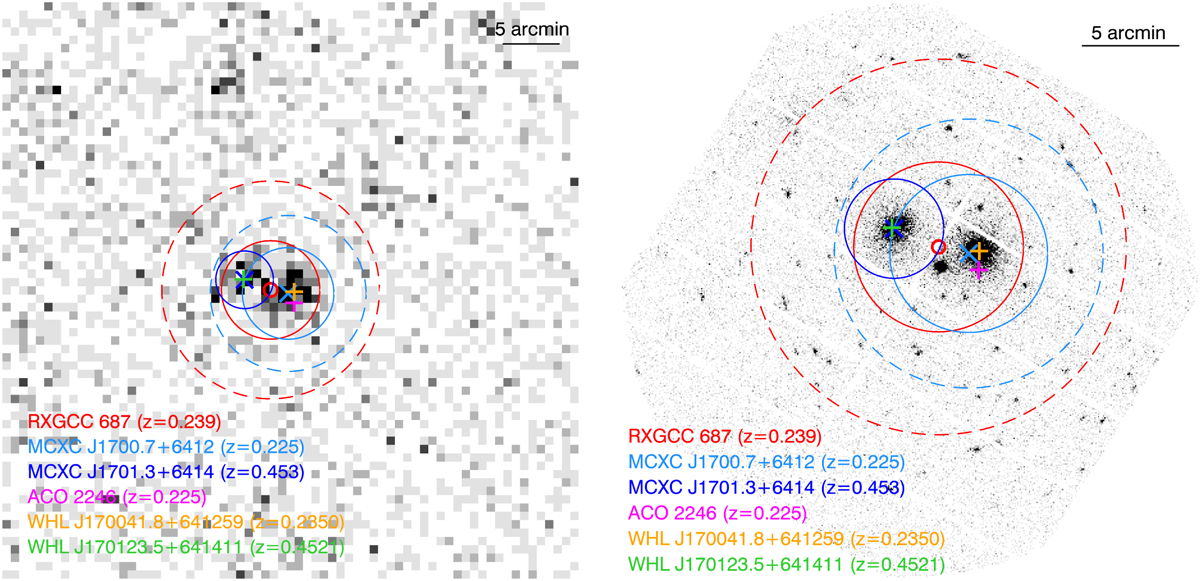
Fig. A.10
Download original image
MCXC J1700.7+6412, a system with two components at different redshifts. MCXC detects the two components separately, while RXGCC detects the system as a whole. We have associated RXGCC to the MCXC with a stronger contribution to the X-ray emission. The left and right panels show the RASS and XMM-Newton images, respectively. The positions of MCXC J1700.7+6412 (z = 0.225) and MCXC J1701.3+6414 (z = 0.453) are marked with a light and dark blue cross, respectively. The position of RXGCC 687 (z = 0.239) is marked with a small red circle. The corresponding solid and dashed circles represent the size θ500 of the clusters and their aperture radius. The green and orange pluses represent the position of two optical clusters: WHL J170041.8+641259, with an spectroscopic redshift of z = 0.2350 (Wen & Han 2015), and WHLJ170123.5+641411, with an spectroscopic redshift of z = 0.4521 (Wen et al. 2009, 2010). The magenta plus shows the position of Abell cluster Abell 1035.
Current usage metrics show cumulative count of Article Views (full-text article views including HTML views, PDF and ePub downloads, according to the available data) and Abstracts Views on Vision4Press platform.
Data correspond to usage on the plateform after 2015. The current usage metrics is available 48-96 hours after online publication and is updated daily on week days.
Initial download of the metrics may take a while.