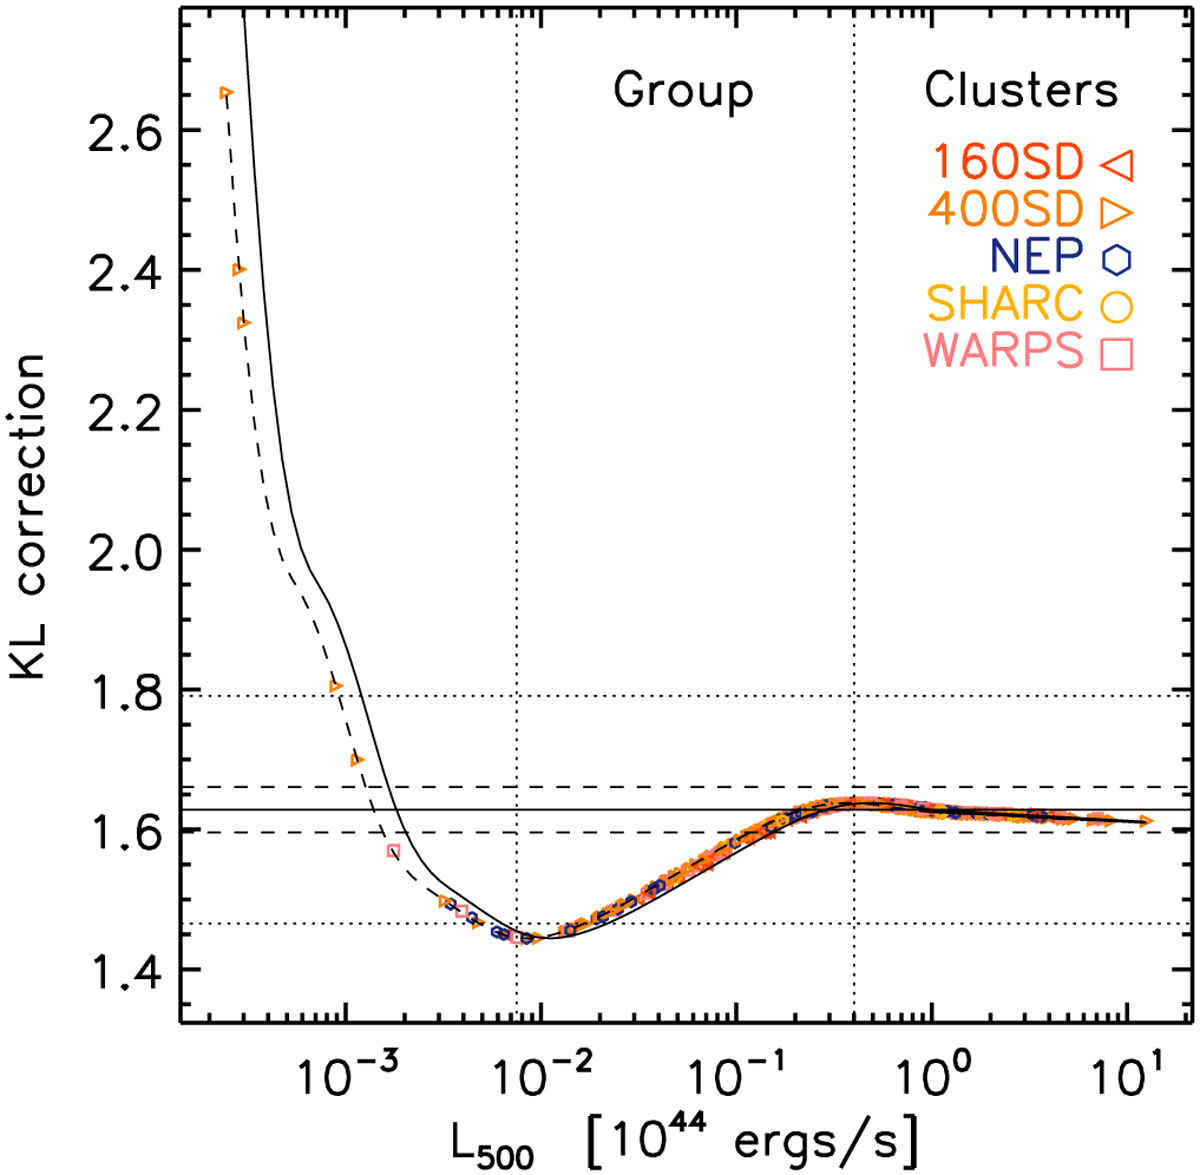
Fig. 5
Download original image
KL-correction factor, the ratio of the luminosity in [0.1–2.4] keV energy band to that in the [0.5–2.] keV band. The theoretical variation with luminosity, for z = 0 and z = 0.5 are shown with solid and dashed lines, respectively. Here the dependence on temperature KL(T) has been translated to a variation with luminosity via the L500–T relation. The redshiſt dependence is a small translation in the L500KL plane via the E(z) factor. The horizontal lines show the value for a 1044 erg s–1 cluster at z = 0 (solid), ±2% (dashed) or ±10% (dotted), respectively. The points show the KL-correction (Eq. (3)) applied to the 400SD, 160SD, NEP, SHARC, and WARPS clusters (for which the catalogue flux is given in the [0.5–2.] keV band). Each point corresponds to a cluster from these samples; the temperature being estimated from the iterative procedure described in Sect. 4.1.
Current usage metrics show cumulative count of Article Views (full-text article views including HTML views, PDF and ePub downloads, according to the available data) and Abstracts Views on Vision4Press platform.
Data correspond to usage on the plateform after 2015. The current usage metrics is available 48-96 hours after online publication and is updated daily on week days.
Initial download of the metrics may take a while.