Fig. 3
Download original image
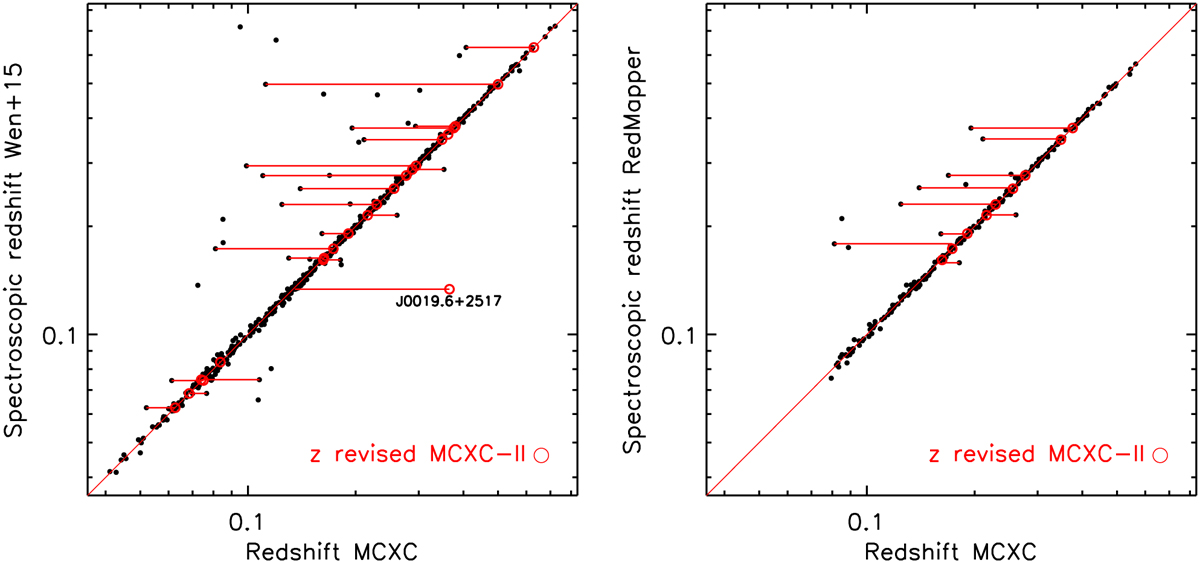
Comparison between MCXC-II redshifts and spectroscopic redshift values from SDSS-based catalogues. The revised values discussed in Sect. 3 are marked in red, and connected to the MCXC-I values by a red line. Left panel: comparison with the closest potential counterpart from the Wen & Han (2015, WH) catalogue (see text). MCXC J0019.6+2517, labelled in the figure, is a line-of-sight structure where the main component is identified with the richest second-closest WH cluster. Right panel: same for redMaPPer clusters from the updated version of the catalogue of Rozo et al. (2015), published by Rykoff et al. (2016).
Current usage metrics show cumulative count of Article Views (full-text article views including HTML views, PDF and ePub downloads, according to the available data) and Abstracts Views on Vision4Press platform.
Data correspond to usage on the plateform after 2015. The current usage metrics is available 48-96 hours after online publication and is updated daily on week days.
Initial download of the metrics may take a while.