Fig. 15
Download original image
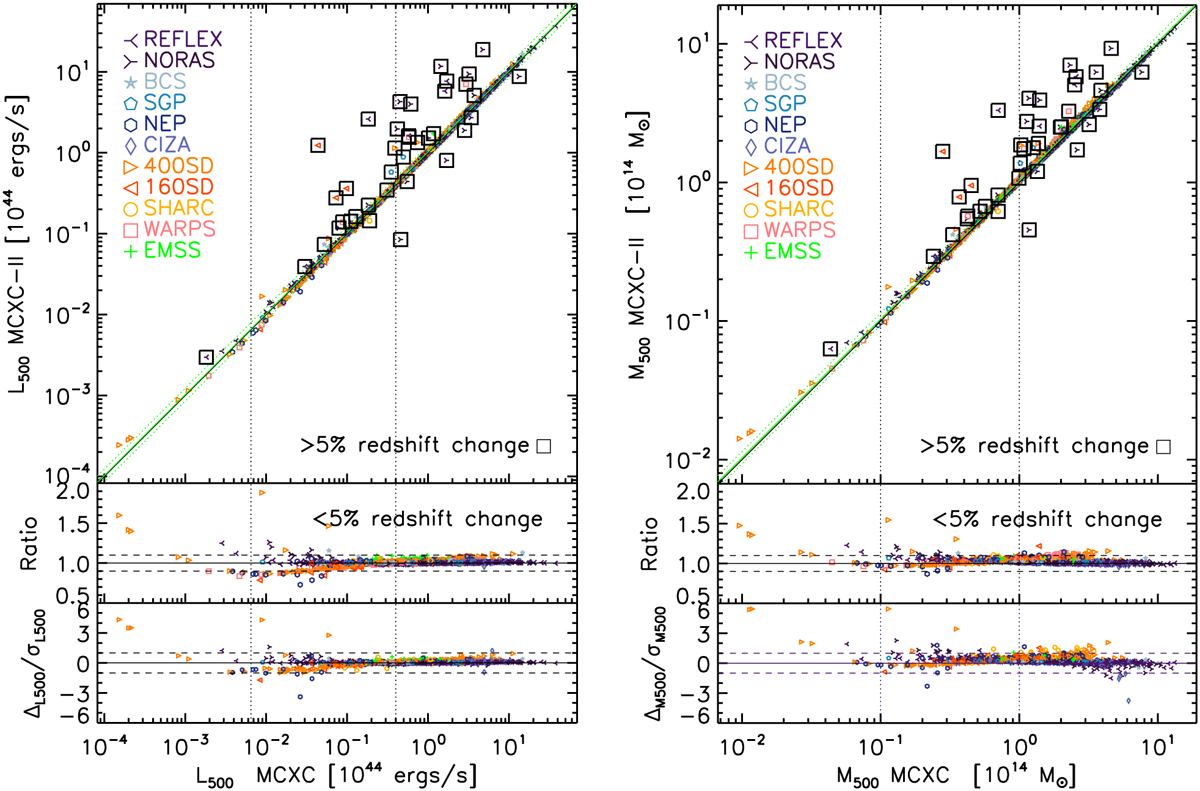
Left: comparison between the MCXC L500 luminosities and the updated luminosities. Source catalogues are identified by different symbols and colours as labelled in the figure. MACS and EMSS_1994 clusters are not shown (see Sects. 4.6 and 4.7 for a description of specific treatment and comparison with MCXC-I). Clusters with redshift changed by more than 5% are marked by a box. Middle panel: ratio of luminosities for clusters with redshift changed by less than 5%. Bottom panel: same for the relative difference in terms of statistical error. The WARPS clusters without errors are not shown. Left: Same for the mass M500.
Current usage metrics show cumulative count of Article Views (full-text article views including HTML views, PDF and ePub downloads, according to the available data) and Abstracts Views on Vision4Press platform.
Data correspond to usage on the plateform after 2015. The current usage metrics is available 48-96 hours after online publication and is updated daily on week days.
Initial download of the metrics may take a while.