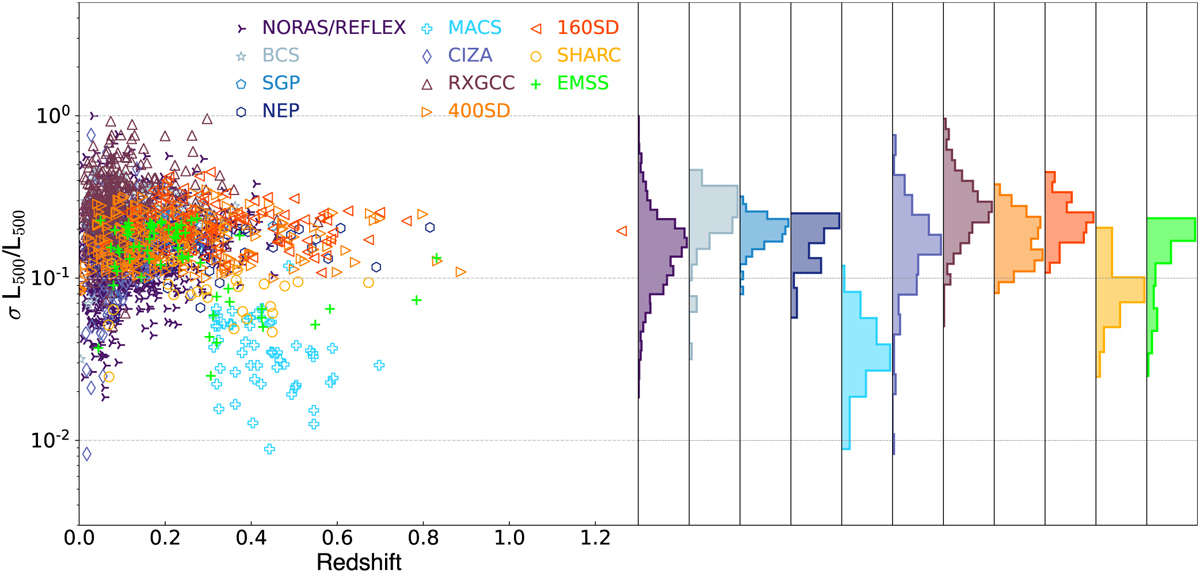
Fig. 12
Download original image
Relative statistical 1 σ error on the L500 luminosity. Input catalogues for each cluster are identified by different symbols and colours, as labelled in the figure. WARPS clusters are not shown since no uncertainties were published in the source catalogue. Left scatter plot of the relative uncertainty as a function of redshift. Right: Corresponding distribution of uncertainties for each input catalogue. The MACS catalogue includes a significant number of systems for which the luminosities come from Chandra follow-up observations, hence the smaller statistical uncertainties.
Current usage metrics show cumulative count of Article Views (full-text article views including HTML views, PDF and ePub downloads, according to the available data) and Abstracts Views on Vision4Press platform.
Data correspond to usage on the plateform after 2015. The current usage metrics is available 48-96 hours after online publication and is updated daily on week days.
Initial download of the metrics may take a while.