Fig. B.1
Download original image
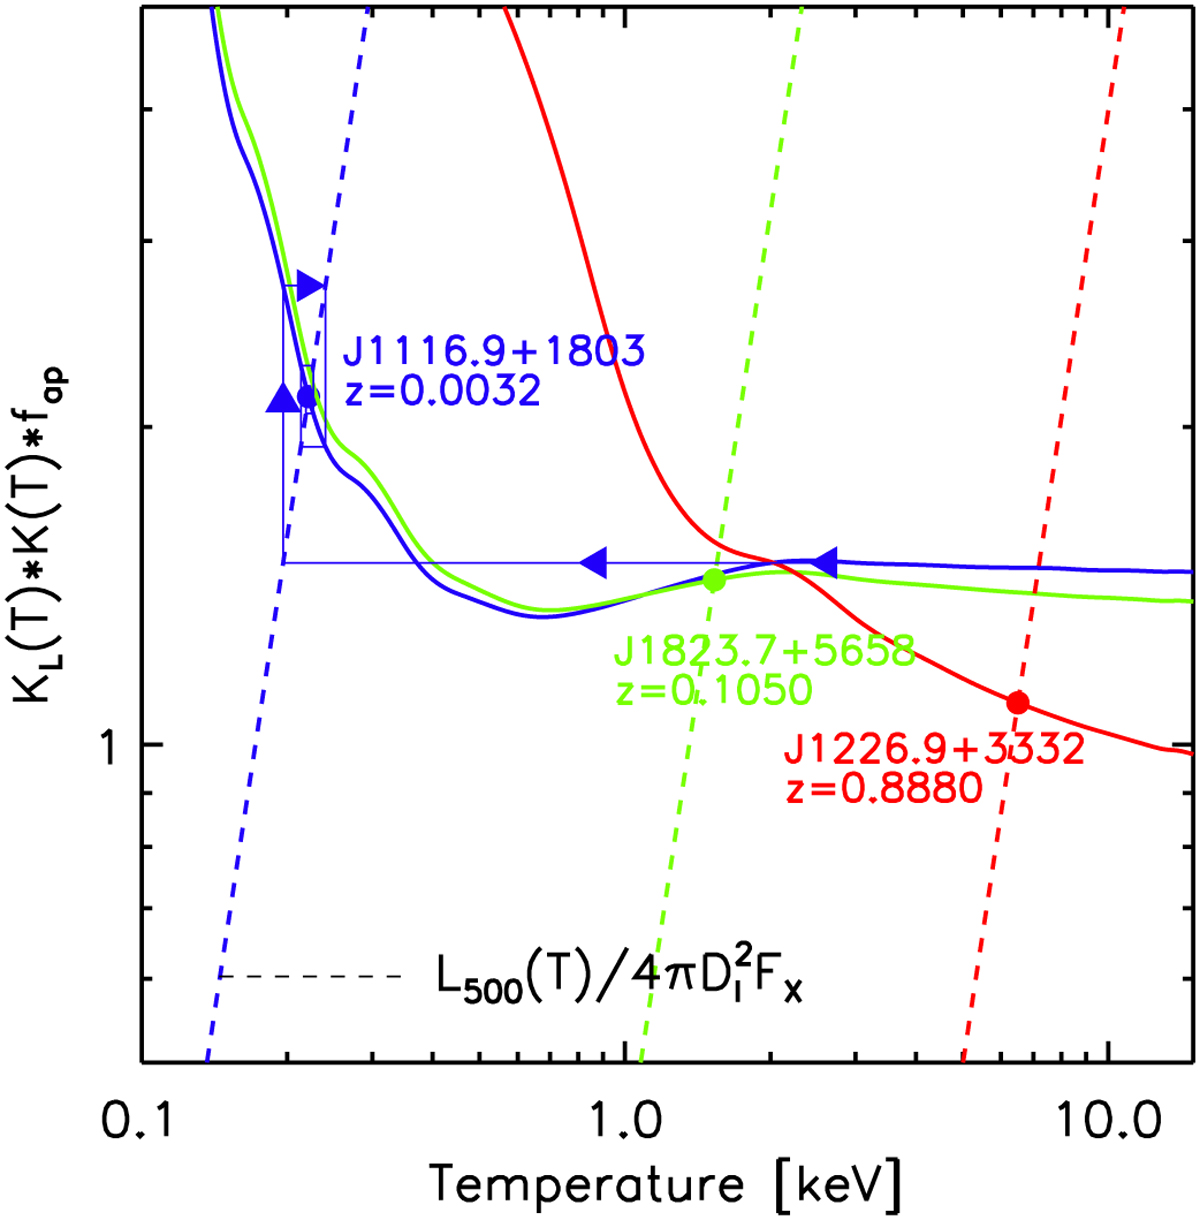
Illustration of the determination of the temperature for three 400SD clusters. The dashed line is the ƒ1(T) function, the luminosity corresponding to the temperature, T, given the L500-T relation, divided by the luminosity ![]() estimated from the input aperture flux without correction (Eq. B.9). The solid line is the correction function ƒ2(T) defined in Eq. B.10, the product of the K-correction, the KL correction factor used to convert the luminosity from the [0.5–2.] keV input band to [0.1-2.4] keV band and Fap is the aperture correction (fixed in that case). Both functions depend on cluster redshift. The curves are color-coded in blue, green and red for the MCXC J1116.9+1803 (z = 0.0032), MCXC J1823.7+5658 (z = 0.1050), and MCXC J1226.9+3332 (z = 0.888), respectively. The temperature is the intersection of the two curves (points). Starting from T = 3 keV, the iterative trajectory is shown in a thin blue line with arrows for the cluster MCXC J1116.9+1803 (z = 0.0032). We note the rapid convergence.
estimated from the input aperture flux without correction (Eq. B.9). The solid line is the correction function ƒ2(T) defined in Eq. B.10, the product of the K-correction, the KL correction factor used to convert the luminosity from the [0.5–2.] keV input band to [0.1-2.4] keV band and Fap is the aperture correction (fixed in that case). Both functions depend on cluster redshift. The curves are color-coded in blue, green and red for the MCXC J1116.9+1803 (z = 0.0032), MCXC J1823.7+5658 (z = 0.1050), and MCXC J1226.9+3332 (z = 0.888), respectively. The temperature is the intersection of the two curves (points). Starting from T = 3 keV, the iterative trajectory is shown in a thin blue line with arrows for the cluster MCXC J1116.9+1803 (z = 0.0032). We note the rapid convergence.
Current usage metrics show cumulative count of Article Views (full-text article views including HTML views, PDF and ePub downloads, according to the available data) and Abstracts Views on Vision4Press platform.
Data correspond to usage on the plateform after 2015. The current usage metrics is available 48-96 hours after online publication and is updated daily on week days.
Initial download of the metrics may take a while.