Fig. 8
Download original image
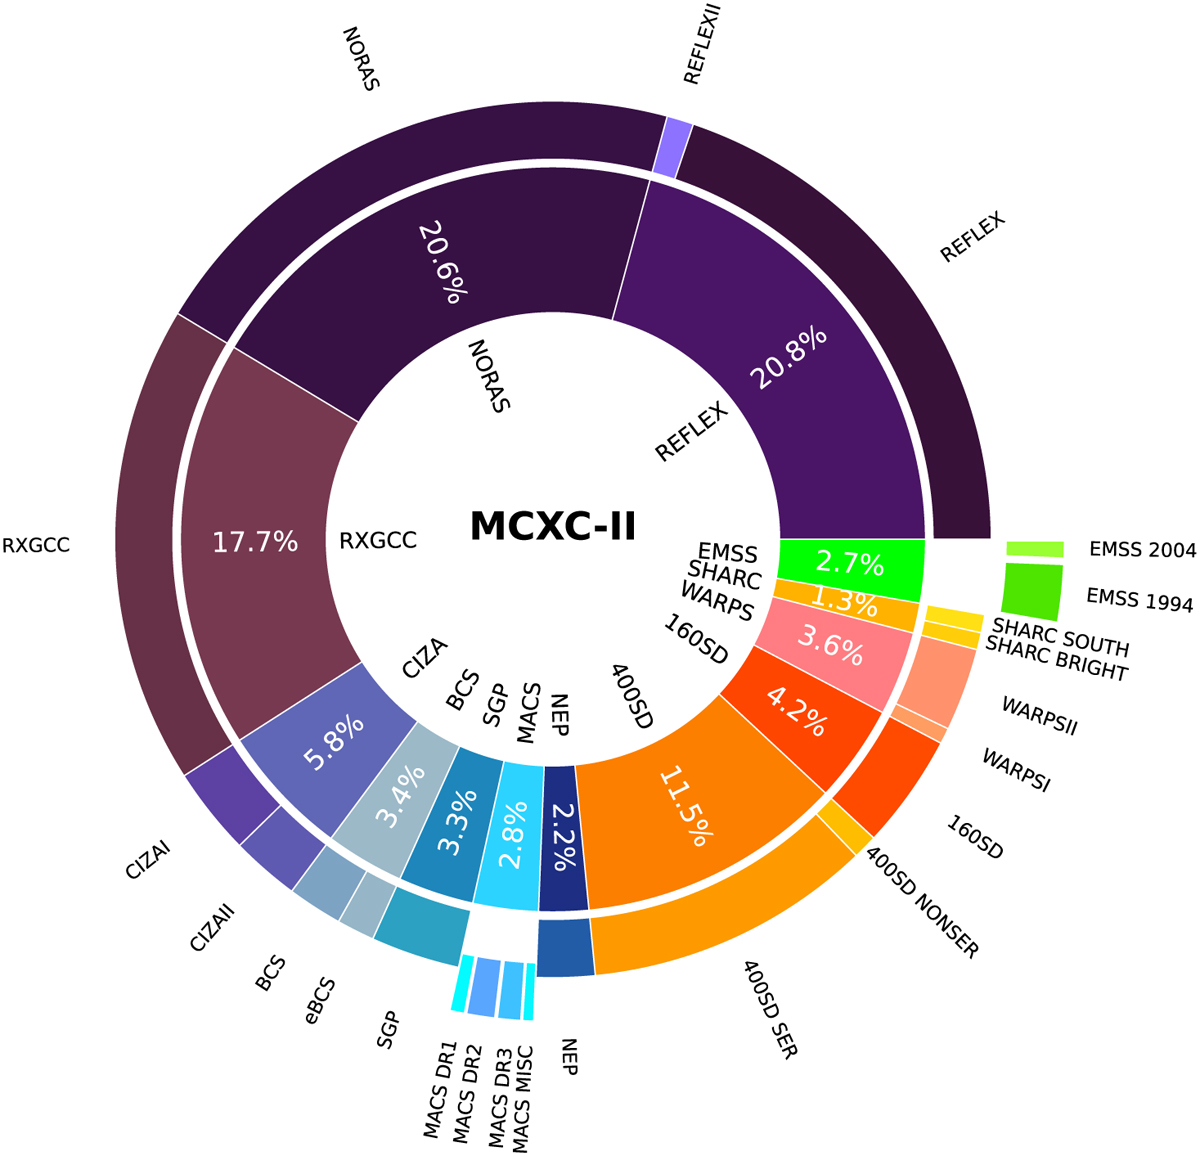
Pie chart representation of the catalogues and sub-catalogues contained in MCXC-II. RASS-based catalogues are depicted with ‘cold’ colours, while serendipitous catalogues are shown with ‘warm’ colours. The overall contribution of each (sub-)catalogue to MCXC-II is given by the percentage in the inner annulus. The exact number of objects represented by each percentage is given in Table 5.
Current usage metrics show cumulative count of Article Views (full-text article views including HTML views, PDF and ePub downloads, according to the available data) and Abstracts Views on Vision4Press platform.
Data correspond to usage on the plateform after 2015. The current usage metrics is available 48-96 hours after online publication and is updated daily on week days.
Initial download of the metrics may take a while.