Fig. 1
Download original image
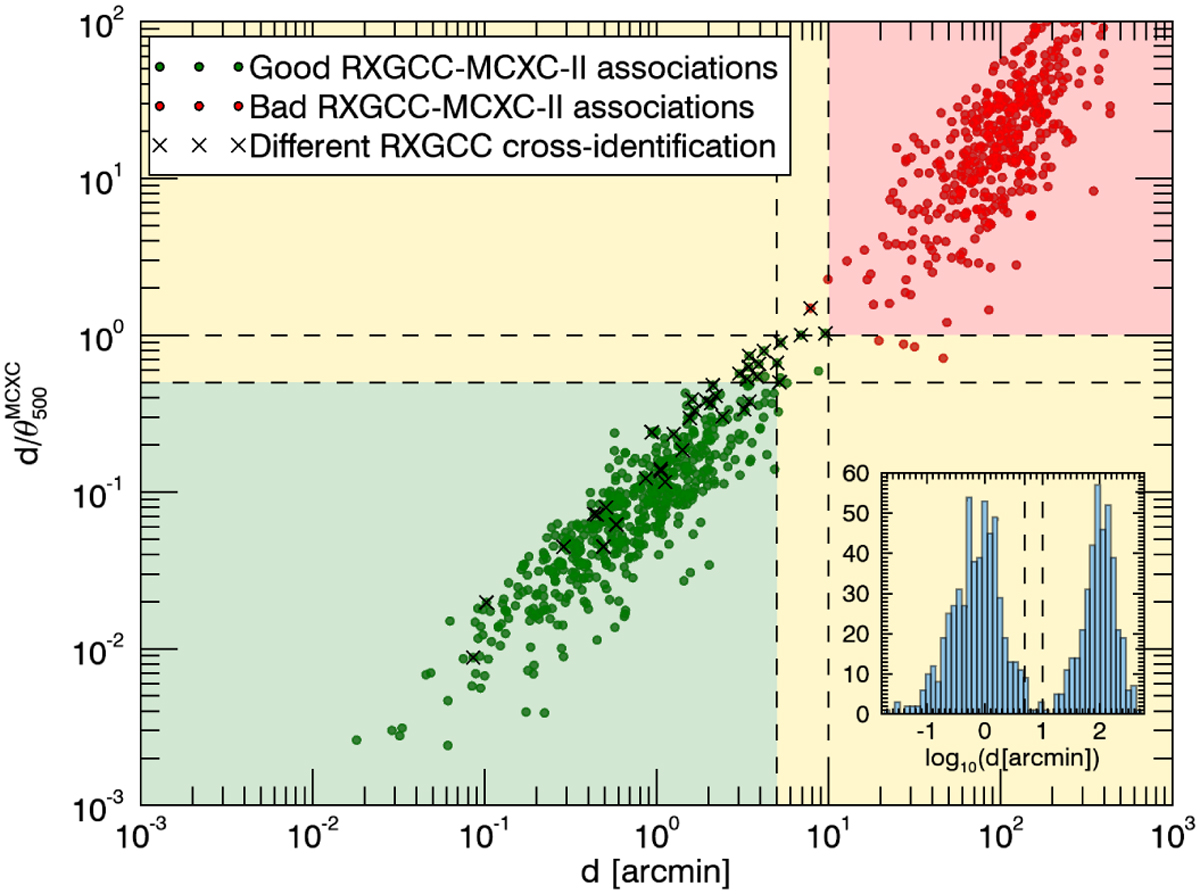
Separation distance d between each RXGCC candidate and its closest MCXC-II cluster is plotted against their relative separation distance in terms of the angular size of the MCXC-II cluster ![]() . Associations falling in the green/red coloured regions are considered to be good/bad, respectively. Associations falling in the intermediate yellow region were analysed individually. Green and red dots represent the final good and bad associations. The black crosses mark the associations for which there is a disagreement between our cross-identification and that undertaken by Xu et al. (2022; GCXSZ column). The subpanel on the lower-right corner shows the histogram of separation distances.
. Associations falling in the green/red coloured regions are considered to be good/bad, respectively. Associations falling in the intermediate yellow region were analysed individually. Green and red dots represent the final good and bad associations. The black crosses mark the associations for which there is a disagreement between our cross-identification and that undertaken by Xu et al. (2022; GCXSZ column). The subpanel on the lower-right corner shows the histogram of separation distances.
Current usage metrics show cumulative count of Article Views (full-text article views including HTML views, PDF and ePub downloads, according to the available data) and Abstracts Views on Vision4Press platform.
Data correspond to usage on the plateform after 2015. The current usage metrics is available 48-96 hours after online publication and is updated daily on week days.
Initial download of the metrics may take a while.