Fig. 7
Download original image
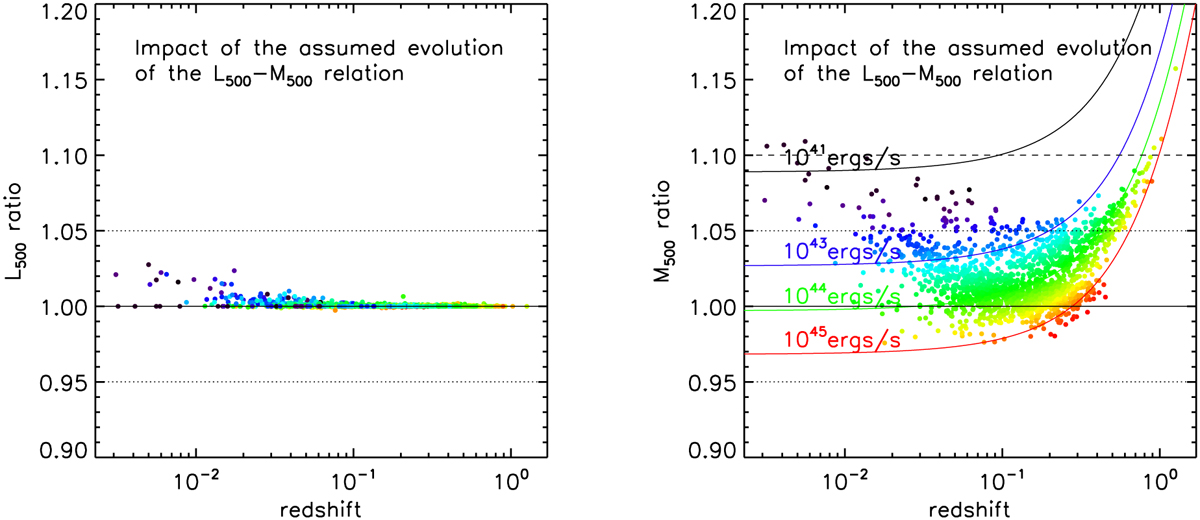
Impact of the change in the evolution factor of the L500–M500 relation (Sect. 4.5). The L500 and M500 values were estimated using the iterative procedure described in Sect. 4.1. Left: Ratio of L500 estimated with the recalibrated L500–M500 relation evolving as E(z)−2 (Eq. (9)) to the value obtained with REXCESS relation (E(z)−7/3 evolution). Ratios are colour-coded according to cluster luminosity and plotted as a function of redshifts. Right: Same for the mass, M500. The curves show the theoretical ratio for different luminosity ratios (see Sect. 4.5).
Current usage metrics show cumulative count of Article Views (full-text article views including HTML views, PDF and ePub downloads, according to the available data) and Abstracts Views on Vision4Press platform.
Data correspond to usage on the plateform after 2015. The current usage metrics is available 48-96 hours after online publication and is updated daily on week days.
Initial download of the metrics may take a while.