| Issue |
A&A
Volume 621, January 2019
|
|
|---|---|---|
| Article Number | A5 | |
| Number of page(s) | 36 | |
| Section | Interstellar and circumstellar matter | |
| DOI | https://doi.org/10.1051/0004-6361/201731596 | |
| Published online | 19 December 2018 | |
Measuring the filamentary structure of interstellar clouds through wavelets
1
I. Physikalisches Institut, Universität zu Köln,
Zülpicher Strasse 77,
D-50937 Köln,
Germany
e-mail: ossk@ph1.uni-koeln.de
2
Institute of Continuous Media Mechanics of the Russian Academy of Science,
Ak. Korolev Str. 1,
Perm
614013,
Russia
e-mail: rodion@icmm.ru
3
Perm National Research Polytechnic University,
Komsomolskii av. 29,
614990 Perm,
Russia
Received:
19
July
2017
Accepted:
2
November
2018
Context. The ubiquitous presence of filamentary structures in the interstellar medium asks for an unbiased characterization of their properties including a stability analysis.
Aims. We propose a novel technique to measure the spectrum of filaments in any two-dimensional data set. By comparing the power in isotropic and anisotropic structures we can measure the relative importance of spherical and cylindrical collapse modes.
Methods. Using anisotropic wavelets we can quantify and distinguish local and global anisotropies and measure the size distribution of filaments. The wavelet analysis does not require any assumptions on the alignment or shape of filaments in the maps, but directly measures their typical spatial dimensions. In a rigorous test program, we calibrate the scale dependence of the method and test the angular and spatial sensitivity. We apply the method to molecular line maps from magneto-hydrodynamic (MHD) simulations and observed column-density maps from Herschel observations.
Results. When applying the anisotropic wavelet analysis to the MHD data, we find that the observed filament sizes depend on the combination of magnetic-field-dominated density–velocity correlations and radiative transfer effects. This can be exploited by observing tracers with different optical depth to measure the transition from a globally ordered large-scale structure to small-scale filaments with entangled field lines. The unbiased view to Herschel column-density maps does not confirm a universal characteristic filament width. The map of the Polaris Flare shows an almost scale-free filamentary spectrum up to the size of the dominating filament of about 0.4 pc. For the Aquila molecular cloud the range of filament widths is limited to 0.05–0.2 pc. The filaments in Polaris show no preferential direction in contrast to the global alignment that we trace in Aquila.
Conclusions. By comparing the power in isotropic and anisotropic structures we can measure the relative importance of spherical and cylindrical collapse modes and their spatial distribution.
Key words: methods: data analysis / methods: statistical / magnetohydrodynamics (MHD) / ISM: structure / ISM: clouds
© ESO 2018
1 Introduction
Recent mapping observations of the interstellar medium (ISM) reveal more and more filamentary structures. In particular, Herschel1 continuum maps show a network of filamentary structures in many interstellar clouds (e.g., André et al. 2010; Schneider et al. 2010; Miville-Deschênes et al. 2010). They seem to dominate the structure both in star-forming and starless clouds. However, it is still unclear to what degree the filaments dominate the dynamical evolution of the clouds, whether there is a clear hierarchy of filaments, and even whether the filaments showing up in the column–density maps actually reflect true filaments in the underlying three-dimensional (3D) structure. In many models, “filaments” show up as projections of crossing sheets from interacting shocks or from a “stretch” induced by turbulence (e.g., Hennebelle 2013). In case of a global 3D isotropy, the projection effects have been estimated (e.g., Vázquez-Semadeni & García 2001; Burkhart & Lazarian 2012), but this assumption is obviously questionable when highly anisotropic structures such as filaments dominate the interstellar clouds. Therefore, a global statistical analysis of the anisotropy of the ISM is highly demanded. Here, we try to contribute towards this general goal.
As most prestellar cores are found within dense filaments the question arises as to whether the filaments channel the flow of material towards the cores and consequently towards star formation or whether the cores form from the direct fragmentation of filaments (Federrath 2016; André 2017). Estimates on the gravitational stability of the filaments indicate that many of them are unstable against fragmentation (e.g., Fischera & Martin 2012) but this requires an accurate determination of their physical properties. Measuring the width of the filaments in a network of structures including background emission is not trivial.
Frequently used methods for the identification of the filaments from the morphological structure in the maps, such as DisPerSe (Sousbie 2011), getFilaments (Men’shchikov et al. 2010), and FilFinder (Koch & Rosolowsky 2015) apply some map filtering and filament truncation that may affect the measured filament properties such as their typical length, width, and transversal column–density distribution (Panopoulou et al. 2017). The existence of a universal filament width across different clouds is highly debated (André 2017). We try to contribute to the discussion here by suggesting an unbiased method to measure the geometrical parameters of filaments from any astrophysical map.
The detection of characteristic scales describing length and width of filaments can be regarded as an analysis of the spectral properties of the maps. They are most directly measured by the power spectrum obtained from a discrete Fourier transform. However, the power spectrum does not retain any information on the localization of individual structures in normal space, describing global properties only. To overcome this problem, Gabor (1946) already introduced a combination of the Fourier transform with a windowing technique that allowed him to localize individual frequency components in a signal. This was extended by Grossman & Morlet (1984) to a theory of wavelet transforms using constant shape wavelets that fulfil an “admissibility condition” allowing for an isometric representation of any data in combined frequency-localization space. Wavelets are quadratically integrable in normal and Fourier space and have a zero mean. This asks for smoothly tapered oscillatory functions. Walker (2008) provides a comprehensive introduction. A first application to astronomical maps was presented by Gill & Henriksen (1990), and Robitaille et al. (2014) present a broader overview on the application of wavelet analyses for interstellar-cloud maps.
We propose a novel technique to quantify the general structure of anisotropic structures in clouds allowing to trace the degree of anisotropy as a function of spatial scale. We use the anisotropic wavelet transform to characterize the spectral energy distribution (SED) depending on scale and orientation of cloud structures (see e.g., Patrikeev et al. 2006; Frick et al. 2016). This allows us to detect scales and directions of anisotropies in the observed structure in any 2D map. Extension to full 3D structures isplanned. Compared to existing techniques, it does not only characterize the global anisotropy, but also quantifies local anisotropies that trace structures with changing directions and warps, produced, for example, by entangled magnetic fields. We can also use it to quantify the dominant modes of gravitational collapse in molecular clouds to estimate the importance of filamentary structures relative to spherical clumps for the global star formation process.
In Sect. 2, we introduce the formalism of the anisotropic wavelet analysis. Section 3 shows the application of the method to well-controlled test structures to determine which parameters are best suited for a local and global analysis and to demonstrate the resolving power of the anisotropic wavelet analysis. In Sect. 4, we analyze the anisotropic structure created in magneto-hydrodynamic (MHD) turbulence simulations, in Sect. 5, we apply the method to observed column–density maps of interstellar clouds, and in Sect. 6, we discuss the implications for the characterization of the role of filaments and magnetic fields.
2 Anisotropic wavelets
The continuous wavelet transform of a 2D map f(x) = f(x, y) is defined by
 (1)
(1)
where s is the spatial scale and the wavelet ψφ(x, y) obtained by rotating an asymmetric wavelet ψ(x, y) by the position angle φ,
 (2)
(2)
This definition implies that φ is zero in positive x direction and increases counterclockwise. The scaling by s−3∕2 provides a wavelet energy spectrum that corresponds to the energy density spectrum (Frick et al. 2001), allowing for an easy comparison with the Fourier transform.
We use a complex Morlet mother wavelet function in the x-direction (see Fig. 1; Walker 2008)
![\begin{equation*} \mathrm{\psi}(x,y) = {1 \over b} \left[\exp(2\mathrm{\pi}\imath x) -\exp(-\mathrm{\pi}^2 b^2) \right] \exp\left(\frac{-x^2-y^2}{b^2}\right),\end{equation*}](/articles/aa/full_html/2019/01/aa31596-17/aa31596-17-eq3.png) (3)
(3)
where the localization parameter b allows for a scaling of the isotropic Gaussian filter relative to the anisotropic sinusoidal part. In Sect. 3.6, we show how it affects the resolution of the wavelet in terms of scales and in the position in space. The small constant − exp(−π2b2) and the localization prefactor 1∕b are required to fulfill, correspondingly, the wavelet conditions of a zero mean and a square norm of unity. A similar wavelet was already proposed byRobitaille et al. (2014) within a larger, more general set of wavelets. However, they did not allow for a variation of the localization parameter to avoid the variable offset in the normalization in Eq. (3). We test the impact of localization parameters b between  and
and  in Sect. 3.6.
The 2D wavelet spectrum is defined as
 (4)
(4)
where  denotes the average over the map. The wavelet spectrum characterizes the distribution of energy as a function of scale s and orientation φ. Isotropic mi and anisotropic ma parts of energy can be defined as the amplitude of the n = 0 and n = 2 complex rotational modes of |W(s, φ, x)|2 at the given position and scale, namely,

The n = 0 mode mi (s, x) is real. It can be interpreted as the local isotropic energy. The mode n = 1 is zero because of the symmetry W(s, φ, x) = W*(s, φ + π, x). The complex n = 2 mode ma (s, x) quantifies the anisotropy in the structure, where the amplitude |ma(s, x)| characterizes the energy2. The phase φ0(s, x) = arg(ma(s, x)) gives the preferred direction of the local anisotropy3.
Using these distributions we can introduce the isotropic and anisotropic spectra

The spectrum Mi(s) measures the energy as a function of scale of the isotropic wavelet transform. Analytic expressions for the wavelet spectrum can be given for idealized test structures. The case of elliptical Gaussians is covered in Appendix A. We can compare Mi (s) to the spectrum obtained from filtering with isotropic wavelets such as the Mexican hat filtering by Frick et al. (2001) and Arévalo et al. (2012) also used in the Δ-variance spectrum,  (Stutzki et al. 1998; Ossenkopf et al. 2008). We discuss the comparison for selected examples in Appendix B.
It is now natural to introduce the degree of anisotropy as
 (10)
(10)
This characterizes the degree of the local anisotropies throughout the map. The spectrum of the degree of anisotropy then quantifies the scale dependence of the ratio of the energy of anisotropic variations compared to that of isotropic variations. It does not directly identify the size of individual structures but the size where anisotropic variations dominate (Sect. 3.1.3).
If one is only interested in global anisotropies, one can use the average of the complex wavelet coefficients ma (s, x) instead of their amplitudes so that different phases cancel each other. Then we obtain a global degree of anisotropy from the wavelet transform,
 (11)
(11)
In the case of a significant global anisotropy one can calculate the preferred direction as the angle
 (12)
(12)
Averaging φ0 over the map instead does not make sense due to the periodicity of the angles.
To combine the spatial and angular information we can study the distribution of angles φ0 (s, x) of the anisotropic modes ma(s, x). We define the 2D anisotropic mode spectrum as
 (13)
(13)
where the  symbol indicates that the averaging is to be taken over the coefficients with arg (ma(s, x)) = φ.
In the same way, we can define a 2D spectrum of the degree of anisotropy by normalizing the distribution of angles A(s, φ) to the spectrum of isotropic modes
 (14)
(14)
The 2D spectra then provide information on the scale and the angle dependence of the anisotropic wavelet coefficients. The inspection of A(s, φ) and Ã(s, φ) provides a complementary view on the ratio between local and global anisotropies that will help us to understand the relation between  and
and  .
.
The global anisotropy measured through the wavelet spectrum can be compared with the outcome of existing methods. In Appendix C, we show a comparison with the structure-function-based anisotropy definition from Esquivel & Lazarian (2011). The wavelet-based anisotropy is independent of the choice of scaling normalization in Eq. (1). As shown for the Δ -variance as an isotropic wavelet analysis, the wavelet spectrum can also be related to the Fourier spectrum of the distribution (Stutzki et al. 1998; Ossenkopf et al. 2008).Scale s and wave number k are related as s = Xtot∕k where Xtot is the total size of the map. If  is the Fourier transform ofthe map f(x) and
 (15)
(15)
is the energy density of the map in k-space, we can decompose them into angular modes. The isotropic contribution is simply given by the energy density Fi (k) = F(k) and the anisotropic contribution is
 (16)
(16)
However, as this definition implies a global integral of the phases, Fa (k) can only characterize global anisotropies. We obtain the degree of anisotropy as
 (17)
(17)
which should be equivalent to the wavelet-based global degree of anisotropy  . By testing that both methods provide equivalent results for the global anisotropy we can obtain a feeling for the general reliability ofthe wavelet-based method that holds then as well for local anisotropies. For an easy comparison of the energy density spectra and the wavelet coefficients, we express all scales in terms of the corresponding filter size by s = Xtot∕k.
The scaling normalization in Eq. (1) means that structures of similar shape but different size have the same contribution to Mi(s) if their total energies per scale are equal. We can use these wavelet spectra for a direct measurement of the energy density, equivalent to the Fourier spectra. Our wavelet and Fourier spectra characterize the energy density of the structures as a function of their scale in units of the square of the amplitude in f multiplied by the pixel scale.
However, for very shallow structures like the Plummer profiles with p = 2 discussed in Sect. 3.1.4, the energy normalization leads to a peak of the spectrum at infinite scales. For those structures the Mi (s) spectrum cannot be directly used to measure their size. This can be overcome by rescaling the spectrum by s−2. The rescaled spectra, Mi(s)∕s2, measure amplitude per scale equality of structures with similar shape and different size. The additional factor 1∕s2 always guarantees the appearance of a peak related to the size of a structure. On top of the slope change we can additionally normalize the spectra by the variance of the original maps,  , to separate the effects of the signal amplitude from the spatial structure. For all applications where we want to measure the size of individual structures, we, therefore, switch to this combined rescaling. The units of the rescaled spectra are consequently given by the inverse pixel scale.
 |
Fig. 1 Cut through the basic two-dimensional Morlet wavelet used for the anisotropic analysis (Eq. (3) for b = 1). The yellow surface represents the real part, the blue surface the imaginary part of the wavelet function. For better visibility of both parts, the range y < 0 is omitted in the display. For the full analysis, the wavelet is stretched by a factor s and rotated by an angle φ. |
3 Test of the technique with artificial data sets
To test how the anisotropic wavelet analysis describes inherent and coincidental anisotropies in different data sets, we performed a large set of tests using maps with simple geometrical structures and computed the different coefficients defined in Sect. 2. We start with a kernel width of b = 1. A more extended set of tests including other kernels is presented in Appendix E.
3.1 Individual structures
3.1.1 Sinusoidal pattern
As the most simple anisotropic structure in Fourier space, we start with a sinusoidal pattern. In Fig. 2 we test a sine pattern in y direction with a wave number of k = 16 providing a period of 32 pixels in a 5122 pixels image, representing an extremely anisotropic structure. The Fourier spectra consist of a single point at the characteristic structure length of s = 32. The wavelet spectra show a broader peak at the same scale due to finite scale resolution of wavelets controlled by the localization parameter b. As the only structure in the map is 100% anisotropic, isotropic and anisotropic coefficients fall basically on top of each other. The resulting ratios between anisotropic and isotropic coefficients, providing the degrees of anisotropy, are therefore close to unity at all scales where the structure is detected and drop to a value of ~ 0.8 at small scales where no structure is detected any more. There is no difference between the global and local degrees of anisotropy as the only structure is globally anisotropic.
When combining stripes in orthogonal directions, the π symmetry in our definition of the anisotropic coefficients in Eqs. (6) and (15) leads to a cancellation of the contributions from structures with a relative angle of 90 degrees. Therefore, we find vanishing anisotropies when analyzing the sum of two orthogonal patterns like Fig. E.4 or from star-like structures. In principle, this limitation can be overcome byincluding higher moments in our definitions but for the practical purpose of quantifying filamentary structures those cases shouldbe irrelevant.
3.1.2 Noise maps
A special type of isotropic structures well defined in Fourier space is given by fractional Brownian motion structures (fBms, see e.g., Stutzki et al. 1998, and Fig. E.2). These are given by a power-law power spectrum F(k) ∝ k1−β and randomphases. One example is given by white noise maps with an energy density spectrum F(k) ∝ k. Other spectral indices, β≠0, correspond to maps of colored noise. The wavelet analysis for two fBms is shown in Appendix E. We find the same spectral index measured by the slope of the Fourier spectra and the wavelet spectra. The spectra of anisotropic wavelet coefficients are proportional to those of the isotropic coefficients providing an almost constant local degree of anisotropy of about 0.3 independent of the spectral index. This indicates a significant fraction of accidental local anisotropies that are caught by the wavelets when considering all orientations. When only considering global anisotropies, as measured by the Fourier coefficients or the sum of anisotropic wavelet coefficients including their phase (Eqs. (10) and (16)), we obtain vanishing global degrees of anisotropy below 10−4.
3.1.3 Gaussian clumps
Gaussians represent a type of clump that is sharply confined and numerically well behaved. In an elliptic representation with different widths along the two main axes a and c, Gaussians are given by
 (18)
(18)
where ĝ specifies the amplitude, ϕ the angle of the c axis in the x, y plane, and σa and σc are the standard deviations of the ellipse in both directions.
For the most simple case of a single Gaussian clump, analytic formulae for the wavelet spectra are derived in Appendix A. Here we only summarize the most important parameters and show the results for localization parameters b between  and
and  .
.
Figure 3 shows the results from the analysis of a Gaussian clump with axes of σ =8 × 32 pixels when using a filter parameter b = 1. It contains the isotropic and anisotropic wavelet and Fourier spectra (Eqs. (8), (14), (15)) in the upper panel and the local and global degree of anisotropy measured through wavelet and Fourier coefficients (Eqs. (9), (10), (16)) in the lower panel. The shape of the spectra of wavelet and Fourier coefficients reflects the size of the Gaussians. The isotropic spectra, Mi and Fi, show the same behavior at scales above about 30 pixels. Their maxima appear at about 180 pixels in a broad peak. The Fourier spectra, Fi and Fa, show a steep increase from about 8 to 30 pixels. The spectra of wavelet coefficients, Mi and Ma, have a shallower increase but anisotropic and isotropic coefficients behave very similarly for both quantities. The anisotropic spectra peak at smaller scales, and consequently, the degrees of anisotropy, given by the ratio of the spectra, peak at even lower scales. The wavelet-based degrees of anisotropy,  and
and  , have their maximum at
  pixels; the Fourier-transform-based degree of anisotropy,
  , continues to rise up to unity for the vanishing Fourier coefficients towards the small-scale limit. As there is only one anisotropic structure in the map, the local degree of anisotropy is identical to the global degree of anisotropy. The match between the peaks of the wavelet-based and the Fourier-transform-based isotropic and anisotropic spectra indicate, as for the sinusoidal pattern, that anisotropic wavelet and Fourier analysis measure the same scale of the maximum energy density for isotropic and anisotropic variations.
The general formulae from Appendix A show that the peak of the local degree of anisotropy  measures the aspect ratio of the Gaussian clumps σc∕σa. This is demonstrated in Fig. 4 giving the maximum degree of anisotropy as a function of the width of the major axis of a Gaussian when the minor axis is fixed to σa = 1 pixel. For aspect ratios below three we find a steep dependence. For larger aspect ratios the maximum degree of anisotropy saturates.
The location of the peak of the degree of anisotropy falls at  . However, with the extended plateau around the peak, the exact position of the peak is hard to determine when applying the method to observational data that may be affected by noise and other observational errors. It is better to parameterize the whole plateau by measuring its edges. In agreement with typical observational errors in the order of 10% we define the plateau here as the region where the spectrum falls above 90% of the peak value.
In Fig. 5, we show the dependence of the plateau parameters for the degree of anisotropy, dw, and the spectra of isotropic wavelet coefficients, Mi, on the aspect ratio of the Gaussian ellipses. As discussed in Sect. 2, a better sensitivity to prominent scales is achieved when normalizing the isotropic spectrum by the quadratic spatial scales Mi ∕s2. Therefore, we also show the peak parameters for the Mi∕s2 spectra in the figure. For every localization parameter b we plot the three curves that provide the location of the peak and the two plateau edges at 90% of the peak value.
For the degree of anisotropy (upper panel) the upper end of the plateau hardly changes with the b parameter. The edge can be approximated by a simple linear function ŝ90% ≈ 2σc − 1∕2σa in the range σc > σa. The lower edge does not depend on σc, but b with š90% ≈ 1.1σa∕b2. The square root σc -dependence of the peak,  , thus falls between the constant and the linear behavior of the two edges. The plateau gets wider with increasing aspect ratio.
The peak and edges of the isotropic wavelet spectrum (central panel) depend only weakly on b and are linear in σc. The peak position falls at about  for σc > σa. This means that the peak of the isotropicwavelet spectrum, Mi, measures mainly the length of the filaments, not their width. In contrast, the peak of the renormalized spectra Mi ∕s2 (lower panel) mainly depends on the filament width for aspect ratios above 1.5. We can describe the plateau by a square root σc dependence at small aspect ratios and a constant for larger aspect ratios σc ∕σa:
  for σc < 1.5σa; (4.8, 6.0, 7.7) ×σa for σc > 1.5σa when using the b = 1 filter. There is a weak b-dependence; all values are higher by 2% for the
  filter and lower by 5% for the
  filter. For circular structures, the peak falls at 4.8 times the radius, σa, consistent with the comparison to the Δ-variance in Appendix B.
The results show that for elliptic structures with an axes ratio of 1.5 or more, the peak of the spectrum of isotropic wavelet coefficients is determined by the length of the major axis (central panel), the peak of the spectrum of scale-normalized wavelet coefficients is determined by the minor axis (lower panel), while the plateau of the degree of anisotropy extends from š90%, determined by the minor axis, to ŝ90%, determined by the major axis (upper panel).
 |
Fig. 2 Spectra of isotropic and anisotropic wavelet and Fourier coefficients for a map containing a sinusoidal stripe pattern with ky =16, i.e., a period of p = 32 pixels in a 5122 pixels image.The two Fourier spectra consist only of a single point at s = 32 pixels and are otherwise zero. In all figures, we plot the absolute value for the anisotropic Fourier spectrum.All other coefficients are real. The wavelet analysis used a localization parameter b = 1. |
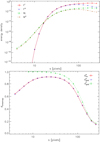 |
Fig. 3 Anisotropic wavelet analysis for a map containing an anisotropic Gaussian clump with standard deviations of σa = 8 pixels, σc = 32 pixels. Top panel: isotropic and anisotropic wavelet and Fourier spectra. Bottom panel: resulting local and global degrees of anisotropy. |
 |
Fig. 4 Peak value of the degree of local and global anisotropy from the wavelet analysis of Gaussians as a function of their aspect ratio. |
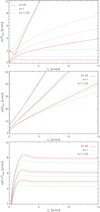 |
Fig. 5 Dependence of the peak region of the degree of anisotropy (upper plot), the spectra of isotropic wavelet coefficients, Mi (central plot), and the quadratic-scale-normalized spectra of isotropic wavelet coefficients, Mi ∕s2 (lower plot), on the aspect ratio of the Gaussian ellipses. We changed the major axis σc of the ellipses while keeping the minor axis σa = 1 pixel constant. For every filter, three curves are plotted giving the location of the peak and the two plateau edges at 90% of the peak. |
3.1.4 Plummer profiles
Column-density maps of interstellar clouds rarely show boundaries as steep as Gaussian clumps. In particular, filamentary structures are rather described by Plummer profiles (Plummer 1911)
 (19)
(19)
where Ra describes the radius of an inner core with a flat density distribution and the exponent p the outer radial decay (see e.g., Ostriker 1964). Therefore we implement filaments with a Plummer-type radial structure as another test data set.
The value of p = 2 found, for example, by Arzoumanian et al. (2011), Malinen et al. (2012), and Juvela et al. (2012) for many interstellar filaments represents another extreme compared to the Gaussians, as p = 2 Plummer profiles are spatially ill confined having a diverging total mass due to the 1∕r dependence at large radii. The divergence prevents us from providing analytical solutions but numerical computations on a finite domain still provide us with significant numbers. For the major axis of the clumps we stick to a Gaussian profile for which we already know the imprint on the wavelet spectra from Sect. 3.1.3. The full Plummer test clump structure used here is thus given as
 (20)
(20)
where Ra is the inner core radius of the Plummer profile in the direction of the minor axis and σc is the standard deviations of the Gaussian profile in the direction of the major axis. Consequently, we only consider σc > Ra.
In reality all clumps should show an intermediate behavior between the Gaussians with the steep exponential boundaries and the Plummer profiles with p = 2 having very shallow boundaries. Figure 6 compares the radial profiles for the Gaussian case with the p = 2 Plummer distribution. For Ra = σ the inner part of both profiles agree but the Plummer profile has much shallower wings. We also show a Plummer profile that is narrower by a factor 1.7. Below we demonstrate that this one has the same peak of the renormalized wavelet spectra as the Gaussians (Fig. 8). It corresponds to a match of the levels at 40% of the maximum between Gaussian and Plummer profiles.
Figure 7 shows the results from the wavelet and Fourier analysis for a p = 2 Plummer profile with a core radius of Ra = 8 pixels and a Gaussian length σc = 32 pixels, equivalent to Fig. 3. Again, Fourier and wavelet spectra behave very similarly at scales above s = 30 pixels while the Fourier spectra show a steeper slope at small scales. For the Plummer profiles the isotropic wavelet coefficients grow monotonically with scale showing no local maximum but continuing to rise towards infinite size scales with a slope of s3∕2. The anisotropic spectra show a local maximum at about 90 pixels leading to a peak of the wavelet-based degrees of anisotropy at s* ≈ 15 pixels while the Fourier-transform-based degree of anisotropy approaches unity towards the small-scale limit. As there is only one anisotropic structure in the map, local and global degrees of anisotropy agree. Due to the unboundedness of the shallow profiles the energy density is no useful quantity to measure the characteristic size of the clumps. This can be overcome by rescaling the spectra by s−2, providing the amplitude per scale as mentioned in Sect. 2. For the rest of the paper we therefore compare rescaled wavelet spectra,  .
.
In Fig. 8, we show the dependence of the plateau parameters for the degree of anisotropy, dw (upper panel), and the renormalized spectra of isotropic wavelet coefficients, Mi ∕s2 (lower panel), on the aspect ratio of the Plummer profile clumps, σc∕Ra. For the three localization parameters  , b = 1, and
  , and a number ofaspect ratios, we give the location of the peak as a central dot and the 90% plateau edges, š90% and ŝ90%, as outer lines. In the degree of anisotropy, the lower edge of the plateau falls at very small scales, close to the minimum scale of the map, meaning that we were only able to reliably measure this edge with the
  filter. For the wavelet coefficients, the points at the right edge of the plotted range indicate the values for an infinite aspect ratio, given by an extended 1D Plummer profile.
For the degree of anisotropy (upper panel), we find a behavior that is close to that of the Gaussian clumps when multiplying the plateau scales by a factor 0.8. The upper end of the plateau is again independent of b and well approximated by ŝ90% ≈ 0.8 × (2σc − 1∕2Ra). The dependence of the peak location,  , on the aspect ratio is somewhat steeper than for the Gaussians. Instead of an exponent of 0.5 we fit a common exponent of 0.63 ± 0.02 when excluding the smallest aspect ratios for the
  filter. However, simply using the square-root scaling law from the Gaussian clumps, multiplied by the factor 0.8, also gives a reasonable representation of the peak location within 20% when excluding aspect ratios above 40 and below 6 for the
  filter. The lower edge of the plateau, š90%, seems to fall at slightly smaller scales than the 0.8-fold of the Gaussian value, only approaching it for large aspect ratios; we cannot, however, give solid estimates here. As a consequence, we get an approximate match of the peak positions of the degrees of anisotropy between Gaussian and Plummer profiles if we increase the size of the Plummer profiles by the factor 1∕0.8 = 1.25 and exclude the
  filter. In Sect. 3.6, we see moreover that this filter is less suited to study the degree of anisotropy.
For the normalized isotropic wavelet spectra, Mi∕s2 (lower panel), we also find a constant position of the peak plateau, but only for large aspect ratios, σc ∕Ra≳8. Like for the Gaussians, the peak position only depends on the filament width in this range:  when using the b = 1 filter. For the
  filter, the values are higher by 4%, and for the
  filter they are lower by 10%. Compared to the Gaussian ellipses the scale of the lower edge of the plateau is 1.4 times higher, the peak position 1.7 times higher, and the upper edge 2 times higher. The peak plateau is thus shifted by a factor 1.7 and widened by 40%. As seen in Fig. 6, a match between the peak scales of highly elongated Gaussian and Plummer profiles is consequently reached when comparing the contours that mark 40% of the maximum.
However, an excursion exists for aspect ratios σc∕Ra ≈ 3–6. There, the location of the peak of the isotropic wavelet spectra would overestimate the filament width by up to a factor of two. The deviation is small for the filter and largest for the
  filter. Inspection of the wavelet coefficient maps shows that this effect results from the varying match of the filter shape to the wings of the clump. Due to the shallow decrease of the Plummer profile in the direction of the minor axis, only the central contours of the clump reflect the input aspect ratio. For an aspect ratio σc ∕Ra = 6.0, the 40% contour only shows an aspect ratio of 3.5, and the 10% contour is already almost round. The filter with the wide localization parameter b is more sensitive to these broad structures resulting in an almost spherical distribution of the wavelet coefficients at the scale of the peak of Mi∕s2. There, it obviously no longer traces the filamentary structure. Instead of providing an additional fit for the range of aspect ratios σc ∕Ra ≈ 3–6, we consider this rather as an uncertainty of the method for the particular case of relatively short filaments with a shallow radial profile. In all cases where the 40% contour has an aspect ratio of four or above, the fixed relation between the peak of the Mi ∕s2 spectra and the filament width can be used to reliably measure the width of the 40% contour, independent of whether the filament profile is as steep as a Gaussian or as shallow as a p = Plummer profile. In terms of the 40% of the maximum width, the peak of the Mi ∕s2 spectra falls at
  . When sticking to the commonly used full-width-half-maximum (FWHM) instead, the relation is
  but this introduces an uncertainty of % due to the unknown density structure falling somewhere in between the Gaussian and the p = 2 Plummer profile.
To demonstrate this approach we compare the normalized isotropic spectra and the local degree of anisotropy for Gaussian clumps and Plummer profiles with the same axes ratios in Fig. 9. The shallow density profile of the Plummer ellipses creates shallower spectra in both quantities. When using the same axes Ra = σa and σc for both clumps, the isotropic wavelet spectra of the Plummer profiles peak at much larger scales than for the Gaussian profiles and the degrees of anisotropy peak at slightly smaller scales. A match of the peak position of the wavelet spectra is achieved when reducing the size of the Plummer profile by a factor of 1.7, and a match in the peak position of the degree of anisotropy is achieved when increasing the size of the Plummer profile by the factor 1.25. Both quantities react in a different way to the shallower density profile. For single-sized clumps with known aspect ratio one could therefore use the comparison between the two to distinguish the density profile. Vice versa, if the density profile is known one could derive the width and the aspect ratio. For real maps consisting of multiple structures with different sizes, aspect ratios, and density profiles, this is however practically impossible, and therefore we concentrate here on a robust way to measure the width of the filaments that is defined by the 40%-contours, independently of the aspect ratio and the density profile. Unfortunately, the scale sensitivity of the wavelet analysis is significantly reduced when the analyzed structures are less pronounced due to being embedded in shallow density halos. The plateau around the peaks is wider, meaning that an accurate determination of the peak location becomes more difficult than for sharply confined structures.
 |
Fig. 6 Comparison of a Gaussian profile with a Plummer profile for p = 2 when using the Gaussian standard deviation for the plateau radius Rc or using a 1.7 times smaller plateau radius leading to the same 40% width. |
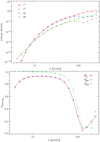 |
Fig. 7 Anisotropic wavelet analysis for a map containing an anisotropic Plummer profile with a core radius Ra = 8 pixels and σc = 32 pixels. The panels and parameters are the same as in Fig. 3. |
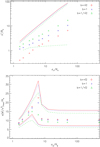 |
Fig. 8 Parameters of the peak plateau regions for the degree of anisotropy (upper plot), and the rescaled spectra of isotropic wavelet coefficients, Mi∕s2 (lower plot), as a function of the aspect ratio of the Plummer ellipses. We labeled the y-axes by the variables for the peak of the two quantities. For every filter, the central dots give the location of the peak and the two outer lines show the plateau edges, at 90% of the peak. For the wavelet coefficients, the dots at the right edge of the plotted range represent the values for an infinite aspect ratio, i.e., a one-dimensional (1D) Plummer profile. In the degree of anisotropy, we were not able to measure the lower edge of the plateau except for the |
3.1.5 Noise effects
In observational data, the analysis will be affected by observational uncertainties, in particular noise. This may introduce an error in the measurement of the characteristic scale of any structure. From Figs. 2 and 3 it is clear that in principle the maximum of the power spectrum measures the characteristic scale most sharply, but only for infinitely extended structures. For spatially constrained structures, the wavelet analysis provides a good compromise.
The standard deviation of the wavelet coefficients σw caused by noise with a correlation length lN is approximately  . This leads to the systematic variation of the wavelet spectra and a possible shift of the peak of the rescaled isotropic spectra
  used for the filament width measurement. We estimated the error for Gaussian profiles of different widths but find qualitatively the same behavior for all structures discussed so far. Figure 10 shows the results of numerical tests, providing the relative uncertainty of the peak position as a function of the signal to noise ratio, (S∕σN), and the noise correlation length relative to the characteristic structure sc ale, lN ∕smax. Because the uncertainty in
  is determined by
  the uncertainty in the peak position also dependsonly on the product
  . The dashed line represents a linear dependence, providing an approximate relation for relative error of the peak position
  with c ≈ 0.05 for lN < s. Even for relatively large noise amplitudes, noise will thus only affect our size estimates at scales below the noise correlation length. They are easily identified by increased variances and the lower panel shows the (see the discussion of the Polaris column density map in Sect. 5).
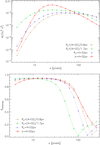 |
Fig. 9 Comparison of the rescaled spectra of the isotropic wavelet coefficients (top panel) and the local degree of anisotropy (bottom panel) for elliptical Gaussian clumps with σa = 4 pixels, σc = 32 pixels and Plummer profile clumps with Ra = 4 pixels and σc = 32 pixels. To test the fit relations for the peaks in the wavelet spectra and the degree of anisotropy, we also show the results for Plummer profile clumps that are smaller by a factor 1/1.7 and larger by the factor 1/0.8. |
 |
Fig. 10 Relative error of smax simulated for noise with different values of the signal-to-noise ratio, S∕σN, and the relative noise correlation length, lN∕smax, superimposed on Gaussian structures. The dashed line represents the approximation for small noise correlation lengths, |
3.2 Superposition effects
Astronomical maps usually contain multiple structures. As the wavelet analysis is a linear transformation, the wavelet spectra, averaging the square of the transform, do not distinguish between a map consisting of ten separated clumps, like in Figs. 11 and D.1, and a map consisting of a single clump with an amplitude that is higher by the factor  . The distinction has to come from the spatial distribution of the wavelet coefficients. The contribution of every individual structure to the total wavelet spectrum is always determined by its square-amplitude weighted fraction of the total map. The area filling enters only as a simple scaling parameter that is eliminated when we divide the spectra by the variance of the maps,
  , as proposed in Sect. 2. If there is more than one component that contributes to a map it is therefore necessary to inspect the maps of wavelet coefficients to judge the number and relative contribution of different structures in the map.
However, the spatial correlation of multiple clumps may create some effects that are not visible in the analysis of the single structures considered above. To study superposition effects we limit ourselves here to superpositions of Gaussians because they are numerically well behaved and the general impact of the superposition effects does not depend on the shape of the individual structures.
We start with the superposition of isotropic clumps. In Fig. 11, we use a random superposition of ten Gaussian clumps; they are inherently isotropic but may create some anisotropy due to their random placement in the map. The shape of the isotropic wavelet spectra, shown in the middle panel, roughly matches the behavior of single Gaussians. In agreement with the results from Sect. 3.1.3, the peak of the renormalized spectrum falls at s ≈ 4.8σa. The anisotropic wavelet spectrum is non-negligible, roughly following the isotropic spectrum, but at a ten to one hundred times lower level. The global degrees of anisotropy rise to a noticeable level at scales above 60 pixels where the random placement of the Gaussians creates some larger structure. Small local anisotropies are also visible at scales below 8 pixels where the filter picks up the edges of the individual circles as some anisotropy, but obviously without any preferred direction.
In the actual numerical implementation, we noticed that it is very difficult to create perfectly isotropic structures. Placing isotropic clumps randomly on a rectangular grid already creates small deviations due to the gridding. These anisotropies are picked up by the wavelet coefficients. A 1% deviation from isotropy already creates a local degree of anisotropy of 2.5% for the b = 1 filter and of 5% for the  filter. This is expressed in the very steep rise of the maximum degree of anisotropy as a function of the aspect ratio in Fig. 4. We therefore interpret degrees of anisotropy below 10–20% as isotropic even if the anisotropic wavelet spectra do not vanish.
To better understand the nature of the anisotropies, we show the maps of the individual anisotropic wavelet coefficients, |ma (s, x)|, normalized by the total variance of the map,  , for some filter sizes s in Fig. 12. At small filter sizes, the curvature of the edges of the Gaussians appears as anisotropy, but at a very low level. If the filter size is in the order of the size of the individual clumps, they are no longer visible as anisotropies, but the two closely neighboring clumps in the upper central part of the map (Fig. 11 top) appear as main anisotropic structure. With larger filter sizes, other groups of clumps appear as dominant anisotropies, all at a similar level. As those groups represent global structures, we find that the local and global degrees of anisotropy in Fig. 11 grow from values close to zero to values of about 0.2 for scales above 60 pixels. Degrees of anisotropy of 0.2–0.3 are thus naturally expected for random configurations of overall isotropic structures. As seen in Sect. 3.1.2, degrees of anisotropy of 0.3 are a robust limit for random noise signals.
As mentioned above, the map of wavelet coefficients is moreover a necessary tool to interpret the wavelet spectra in terms of the number of contributions. At small scales, we can clearly count the ten clumps in the map. At larger scales, fewer structures contribute. The relatively low number of structures at wavelet scales above the clump size confirms that superposition effects are relatively small in this example; the wavelet spectra are still close to those of the individual clumps.
Equivalent tests for anisotropic structures, laid out in detail in Appendix D, show that the spectra of wavelet coefficients and degrees of anisotropy for ensembles of anisotropic structures are simply given by a combination of the behavior of individual anisotropic clumps as discussed in Sect. 3.1.3 and the superposition effects discussed for the isotropic case above. The isotropic wavelet spectra closely follow the spectra measured for individual clumps and at scales up to about four times the major axis of the clumps, σc, the local degree of anisotropy also matches the curve of the individual clumps. Differences only occur at larger scales wherethe random superposition of the clumps creates local and global anisotropies of about 20%. The mutual alignment of the individual clumps, however, creates a huge difference in the global degree of anisotropy at small scales.For the random angular placement of the clumps, the global anisotropy vanishes at the scales below 4σc while for a parallel alignment the global anisotropy is identical to the local anisotropy in this scale range. Combining the local and global degree of anisotropy as a function of scale then allows us to characterize both the anisotropy of individual structures and their mutual alignment.
The maps used so far contain only relatively few clumps, leading to small superposition effects. To combine all effects discussed so far with a large number of clumps we compare in Fig. 13 maps of individual clumps of different sizes to maps of superpositions containing a variable number of clumps. We randomly placed and oriented elliptical clumps with an aspect ratio of 4:1 using different sizes and numbers of clumps. For the degree of anisotropy we only show the local degree  because we find only small accidental global anisotropies. The spectra of wavelet coefficients show the expected broad peaks and very little variation when changing the number of clumps. All peak positions fall at six times the standard deviation of the clump minor axis and the range above the 90%-of-the-peak level extends from 20% below the peak position to 30% above the peak position. At a scale of three times the clump minor axis, the coefficients drop to about 1∕e and at the scale of the minor axis to 2 × 10⁻⁴ of the peak values. The difference between 1 clump and 100 clumps can provide a variation of the peak position by up to 15% and some deviation at large scales due to some random superpositions. The situation is very different when inspecting the degree of isotropy. The simple size-peak relation for single elliptic clumps in the maps is quickly distorted when adding more clumps. The anisotropy at large scales is systematically reduced due to the random relation between neighboring clumps. The affected scales are determined by the typical distance between the clumps. We measured the average distance between the clumps through Delaunay triangulation and obtained a broad distribution with a mean of 160 pixels and a standard deviation of 70 pixels for 10 clumps and a mean of 50 pixels and a standard deviation of 40 pixels for 100 clumps. As a consequence, the maximum of the smallest clumps between 4 and 30 pixels is not affected when combining only 10 clumps, but the large-scale wing is significantly reduced when combining 100 clumps. The resulting peak position is shifted to smaller scales. The same effect is prominent for the largest clumps when combining 10 of them. When combining many clumps the mutual alignment or misalignment from the random placement always destroys the anisotropy in the map at scales of the average clump distance, both globally and locally, but provides only a minor modification to the isotropic wavelet coefficients.
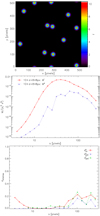 |
Fig. 11 Anisotropic wavelet analysis for a map containing 10 Gaussian clumps with a standard deviation of σ = 8 pixels, i.e., a FWHM of 19 pixels. Upper panel: original map. Central panel: scale-normalized isotropic and anisotropic wavelet spectra |
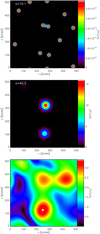 |
Fig. 12 Maps of anisotropic wavelet coefficients |ma(s, x)| for the field of 10 Gaussian clumps from Fig. 11. The three panels show the coefficients for the filter sizes of s = 10, 40, and 160 pixels. To be independent of the amplitude of the original signal we normalized the coefficients by the map variance |
3.3 Angular sensitivity
In Fig. 14, we combine two anisotropic structures with similar sizes but different aspect ratios and orientations. Comparing the local and global degree of anisotropy then allows us to assess the sensitivity of the method to the aspect ratio of the structures. Ten Gaussian clumps with standard deviations of 6 and 18 pixels for their main axes are oriented at 45 degrees while ten clumps with a larger aspect ratio, provided by standard deviations of 3 and 27 pixels for their main axes, have a uniform angular distribution. The corresponding isotropic power spectra and spectra of wavelet coefficients, not plotted here, show a similar behavior to the individual clumps in Fig. 3. The same is true for the degree of local anisotropy at scales of s < 27 pixels. The global anisotropy introduced by the 45 degrees alignment of the clumps with the 3:1 axes ratio is only apparent at scales between about 30 and 60 pixels.
In Fig. 15, we invert the situation in the sense of aligning all ellipses with the high aspect ratio at an angle of zero while uniformly distributing the angles of the σ =6 × 18 pixels ellipses. As the orientation of the ellipses is irrelevant for the local degree of anisotropy, the curve for  agrees with the one from Fig. 14. However, the global degree of anisotropy is much higher here at all scales below 30 pixels. Similar global degrees as in Fig. 14 only occur for s≳30 pixels.
When inspecting the maps of anisotropic wavelet coefficients |ma (s, x)|, we find that at small scales the clumps with the higher aspect ratio produce nine times higher anisotropic wavelet coefficients than the σ =6 × 18 pixels clumps. The relative contribution of the wavelet coefficients of the clumps with lower aspect ratio grows with scale, starting from the characteristic anisotropy scale for the minor axis at  pixels, until they show the same magnitude as the coefficients for the clumps with the high aspect ratio at a scale of about 30 pixels. Consequently, the map-averaged anisotropic wavelet coefficients Ma (s) are dominated by high-aspect-ratio clumps at all small scales while we find similar contributions at scales s≳30 pixels. On very large scales, approaching the map size, only random anisotropies appear from the mutual positioning of the individual clumps providing degrees of anisotropy around 0.2–0.3.
To also inspect the distribution of the directions of anisotropic structures in the maps we need to look at the distribution of angles of the anisotropic modes ma(s, x) measured by the 2D anisotropic mode spectra A(s, φ) and Ã(s, φ) (Eqs. (12) and (13)).
Figure 16 shows the angular distribution of the anisotropic wavelet coefficients, in terms of A(s, φ) (contours) and Ã(s, φ) (colors) for the examples from Figs. 14 and 15. The upper plot refers to the configuration where the low-aspect-ratio clumps are aligned at 45 degrees; in the lower plot the clumps with high aspect ratio are aligned at 0 degrees. In the case of the uniform angular distribution of the high-aspect-ratio clumps, we can see the contribution from every individual of these clumps at small scales in the normalized coefficients à (s, φ). However, there the absolute magnitude of the wavelet coefficients is small, causing the clumps to not show up in the contours of A(s, φ). The angular distribution of the absolute coefficients A(s, φ) exceeds 3% of its maximum only for s > 10 pixels. The peak is reached at s ≈ 30 pixels where we also see the contribution of the σ = 6 × 18 pixels clumps concentrated at the angle of π∕4 = 45 degrees. Although the global anisotropy is not very prominent in the spectra in Fig. 14 it is very obvious in the angular distribution. At large scales we find an accidental anisotropy at an angle of about 30 degrees responsible for the enhanced degree of anisotropy there.
In the lower plot where the high-aspect-ratio clumps are aligned, the whole angular distribution, both in terms of A(s, φ) and à (s, φ), is dominated by the σ = 3 × 27 pixels clumps. One can only recognize the broad angular distribution of the low-aspect-ratio clumps in the A(s, φ) contours at the level of A(s, φ) ≥ 3% at scales between 30 and 60 pixels. This is hardly visible in the normalized spectrum but is sufficient to lower the global degree of anisotropy at scales above 30 pixels to the same level as measured for the aligned clumps with low aspect ratio (see Fig. 14).
Both angular distributions of wavelet coefficients, A and Ã, are therefore useful to judge the anisotropic structure in a map. The absolute coefficients, A(s, φ), add the angular information to the power of anisotropic structural variations thereby providing a visual explanation for the measured degree of global anisotropy in a map. Local and global anisotropy are, however, better covered by the plot of à (s, φ), combining the information from  and
and  into a single 2D surface showing the full angular dependence. The color represents the degree of local anisotropy as a function of size scale and angle; the angular spread of the contributions provides a good assessment of the alignment that can create some global anisotropy.
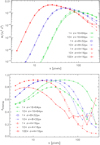 |
Fig. 13 Comparison of the wavelet spectra and local degrees of anisotropy measured in the anisotropic wavelet analysis for maps containing randomly placed and oriented ellipses with different sizes, all with an axes ratio of 4:1 (σ = 4 ×16 pixels, σ = 8 × 32 pixels, σ = 16 × 64 pixels). By changing the number of the clumps, we introduce different degrees of anisotropy on the scale of the typical distance of the clumps. The wavelet spectra are normalized for amplitude per scale weighting by dividing them by |
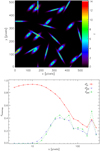 |
Fig. 14 Local and global degrees of anisotropy for the map containing a superposition of two ensembles of elliptic clumps, shown in the top panel. All clumps with standard deviations of 6 and 18 pixels are oriented at 45 degrees; ellipsoidal clumps with standard deviations of 3 and 27 pixels, i.e., an aspect ratio of 9:1, are distributed at uniformly spaced angles covering 360 degrees. |
 |
Fig. 15 Local and global degrees of anisotropy for a map containing a superposition of two ensembles of elliptic clumps. Ten clumps with standard deviations of 3 and 27 pixels, i.e., an aspect ratio of 9:1, are aligned at 0 degrees; ten clumps with standard deviations of 6 and 18 pixels are distributed at uniformly spaced angles covering 360 degrees. |
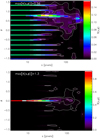 |
Fig. 16 Angular distribution of the anisotropic wavelet coefficients for the maps containing the two ensembles of clumps from Figs. 14 (top panel, σ = 6 × 18 pixel clumps at 45 degrees, σ = 3 × 27 pixel clumps uniformly distributed) and 15 (bottom panel, σ = 6 × 18 pixel clumps uniformly distributed, σ = 3 × 27 pixel clumps at 0 degrees). The contours show the 2D spectrum of wavelet coefficients A(s, φ) at levels of 1/30, 1/10, and 1/3 of the peak value indicated in the top-left corner of the plot. The colors represent the coefficients normalized by the spectrum of isotropic modes, Ã (s, φ) (Eq. (13)), on a linear scale. |
3.4 Three-dimensional structures
To address the question whether the anisotropy of the 2D projection eventually reflects elongated structures in the underlying 3D structure, or rather projections of sheets, we analyzed projections of Gaussian rotational ellipsoids with main axes a × a × c. For a < c this corresponds to cigar-like, prolate structures approximating the traditional picture of elongated filaments, while a > c represents the oblate case of thin sheets. In the projection of a rotational ellipsoid one axis corresponds to the length of the two common axes aproj = a while the second axis is given by  , where θ is the angle between the symmetry axis of the ellipsoid and the direction of projection. Any projection reduces the aspect ratio of the resulting 2D ellipses from the 3D ellipsoids.
Figure 17 shows the normalized spectra of isotropic wavelet coefficients and the degrees of local anisotropy for maps created from random projections of ten prolate Gaussian clumps with σ =3 × 3 × 27 pixels and ten oblate clumps (σ = 3 × 27 × 27 pixels). For comparison we overplot the spectra for ten randomly placed 2D Gaussian ellipses with σ =3 × 27 pixels. The spectra of isotropic wavelet coefficients show a close match between the 2D case and the projections of the prolate clumps. The good match results from the combination of two effects already discussed in Sects. 3.1.3 and 3.3. There we found that for highly elongated structures the larger diameter hardly changes the wavelet spectrum and that in a superposition of clumps those clumps with the higher aspect ratio dominate the wavelet spectrum. This means that for the random projections of prolate structures the clumps with a projection angle θ close to 90 degrees dominate the spectrum, having the same shape as the 2D ellipses. The deviation between both curves at larger scales is explained by the variable superposition effects (Sect. 3.2). The wavelet spectrum for the projection of the oblate clumps is very shallow with an onset of structures also at the three-pixel scale, but a much wider distribution of scales because of the wide distribution of the minor axes of the projected clumps covering the whole range between 3 and 27 pixels. In contrast to the wavelet spectrum, the degree of anisotropy on its own is not sufficient to distinguish between projections of oblate and prolate spectra. As the average axes ratio of the projections is the same in both cases, given by the mean projection angle, we find only small differences between the degrees of anisotropy. The degree of anisotropy is always dominated by the few clumps that appear very elongated in the projection close to the 2D case that represents the most elongated limit and thus has the broadest peak going up to ŝ90% ≈ 2σc − 1∕2σa = 52 pixels.
Therefore, the anisotropic wavelet analysis performed on projected maps can only provide limited information on the underlying 3D structure. It reliably measures the width of the narrowest filaments and the anisotropy of the most elongated structures but a distinction between the oblate and the prolate case is only possible if one has some a priori knowledge of the size distribution of the clumps allowing for a detailed quantitative interpretation of the isotropic wavelet spectrum. To what degree this can be performed in observed 3D position–position–velocity cubes will be the topic of a subsequent paper.
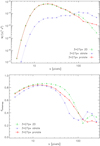 |
Fig. 17 Comparison of the normalized spectra of the isotropic wavelet coefficients (top panel) and the local degree of anisotropy (bottom panel) for maps containing random projections of ten 3D Gaussian rotational ellipsoids with sizes of σ = 3 × 3 × 27 pixels and σ = 3 × 27 × 27 pixels. The green line shows the result for a map consisting of ten 2D Gaussian ellipses with σ = 3 × 27 pixels. |
3.5 Spectra of clumps
In Fig. 18, we combine anisotropic structures on very different scales. A big ellipsoidal clump with σ = 20 × 100 pixels is oriented at −45 degrees providing a global anisotropy. Ten small ellipsoidal clumps, each with σ = 4 × 16 pixels, randomly oriented and positioned are superimposed. The wavelet and Fourier spectra show the superposition of two broad maxima from the two structures, having only a weak dip at the intermediate scales of 60–70 pixels. In the degrees of anisotropy we find two well separated peaks. The local degree of anisotropy shows the broad maximum between 4 and 30 pixels expected from the individual σ = 4 × 16 pixel clumps, but the maximum from the σ = 20 × 100 ellipse does not start at 22 pixels, as expected from the scaling relations for individual clumps, but only at about 120 pixels. This can be understood from the effect seen in Fig. 13. The scale range below 100 pixels is dominated by the arrangement of the individual smaller clumps. The mutual alignment or misalignment from the random placement destroys the anisotropy in the map at those scales, both globally and locally, while still providing some noticeable contribution to the isotropic wavelet coefficients.
The global degrees of anisotropy are close to the local ones at large scales where the map contains only one large anisotropic structure. At small scales the global degrees also show a small enhancement due to the accidental alignment of four of the clumps at an angle of about 60 degrees.
All tests performed so far intentionally used structures with well defined sizes. An opposite assumption is a continuous spectrum of sizes following an approximately self-similar scaling. One case, composed of discrete sizes, consists of a superposition of elliptical Gaussian clumps with different sizes. We compare two different approaches: an equal number of clumps independent of their size and an equal area filling, corresponding to a quadratic decrease of the number of clumps as a function of their size. The smallest clumps used here have a size of σ =4 × 16 pixels. As a data set that is free of any discrete scales, we use a simulation of fully developed hydrodynamic turbulence (Federrath et al. 2010). The column density structure obtained in a FLASH3 simulation of isothermal turbulence in a periodic box driven by solenoidal velocity perturbations provides a structure with a close-to-power-law power spectrum and no preferred direction. After ten autocorrelation times of the forcing, structures of all sizes are created leading to a large inertial range of the power spectrum of the maps.
Figure 19 shows the normalized spectra of isotropic wavelet coefficients and the degrees of local anisotropy for the three data sets. The global degree of anisotropy is always vanishing. The wavelet spectrum of the hydrodynamic simulations is flat over all scales corresponding to a power spectrum with an exponent β =3. The spectraof the clump ensembles show a steep decay below the predicted lower plateau edge at š90% ≈ 19 pixels corresponding to the width of the smallest clumps (see Sect. 3.1.3). Above that limit the spectra follow power laws. The ensemble with an equal number of clumps of all sizes shows a spectrum proportional to the scale M∕s2 ∝ s. This corresponds to the analytical relations given in Appendix A in which an individual clump contribution in a spectrum is proportionalto its scale. The spectrum with the same area of the clumps of different sizes shows a weakly decaying power-law spectrum M∕s2 ∝ s−0.5. This is somewhat shallower than the expected scaling M∕s2 ∝ s−1. The large-scale wing of the individual clump spectrum decays ∝ s−1 but the superposition of many small clumps with larger ones probably creates this deviation.
In the degrees of anisotropy we find a very flat spectrum for the hydrodynamic turbulence simulation with a degree around 0.5 tracing the numerous filaments in the structure. For the clump distribution at small scales, the degree of anisotropy matches the one of the individual clumps of σ = 4 × 16 pixels contained for example in Figs. 13 and 18; it measures the structure of the individual smallest clumps. However, the superposition with the larger clumps leads to a higher anisotropy also at large scales. Because of the relatively higher contribution of large clumps in the map with a fixed number of clumps per size, the degree of anisotropy remains higher at large scales compared to the ensemble with a fixed area of clumps. The noticeable decrease of the degree of anisotropy towards large scales in both cases does not reflect the size of the largest clumps but is rather due to the superposition of the different clumps destroying the local geometry of the individual clumps in configurations with many clumps as seen in Figs. 13 and 18. This effect does not seem to be present in the turbulence simulations indicating that it is an artifact of our test setup of clump superpositions and not a general limitation of the method.
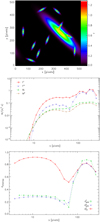 |
Fig. 18 Anisotropic wavelet analysis of a map with a superposition of a big elliptic clump with σ = 20 × 100 pixels with 10 smaller ellipsoidal clumps with σ = 4 × 16 pixels. |
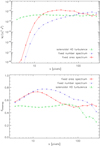 |
Fig. 19 Comparison of the normalized spectra of the isotropic wavelet coefficients (top panel) and the local degree of anisotropy (bottom panel) for maps with a hierarchy of structures of different sizes. The green line represents the projected density structure in a simulation of fully developed hydrodynamic turbulence with a close-to-power-law power spectrum and no preferred direction (Federrath et al. 2010). The blue and red curves show the results for maps composed of a hierarchy of Gaussian clumps with sizes of σ = 4 × 16, 8 × 32, 16 × 64, and 32 ×128 pixels. One map contains two clumps of each size, the other one a fixed area for clumps of different sizes, i.e., 64 clumps of the smallest sizeand one clump of the largest size. |
3.6 Filter shape
As shown in the previous section, for a superposition of ellipses the spectrum of anisotropic wavelet coefficients tends to be dominated by the clumps with the highest aspect ratio at any given scale. The wavelet coefficients of the structures with the higher anisotropy exceed those of structures with a lower anisotropy by a large factor. This usually matches the visual impression, by preferring the most filamentary structure in the spectrum, but may hide relevant structures in a map. To verify whether this effect is due to the accidental match of the wavelet shape to the shape of the ellipses we have changed the shape of the wavelet by varying the isotropic localization parameter b in Eq. (3).
Figure 20 presents the local and global degrees of anisotropy for the two clump ensembles from Figs. 14 and 15 when using a b parameter of  and
and  . The filter with
  has a wider isotropic part at the same scale so that it can trace more elongated structures than the standard b = 1 filter; the filter with
  is more localized leading to a lower effective aspect ratio of the filter. Because a narrower isotropic filter corresponds to the convolution with a broader Gaussian in Fourier space the peaks in the isotropic spectra become broader. As the previous analysis used b = 1, the curves thereshow an intermediate behavior with respect to the two cases in Fig. 20.
The curves for the global degrees of anisotropy confirm the expected effect. The filter with the lower aspect ratio given by the lower b parameter reduces the contributions of the 9:1 clumps relative to the 3:1 clumps in the global degree. For the ensemble with the aligned 3:1 clumps, the  filter reveals some global anisotropy also at low scales that was not visible for higher b values. The value remains quite low, however. For the ensemble with the aligned 9:1 clumps we see the corresponding opposite effect. The contributionof unaligned 3:1 clumps reduces the global degree of anisotropy from a value close to unity to a peak below 0.8. A lower b parameter therefore dampens the high sensitivity of the wavelet analysis to the most elongated structures. The effect is, however, relatively small. The highest aspect ratio still provides the dominant wavelet coefficients.
As seenalready, the local degree of anisotropy does not depend on the alignment of the different ensembles and the two corresponding curves for each filter always fall on top of each other. However the details of the peak in the local degree of anisotropy are affected by the filter shape. The change from the  filter to the
  filter reduces the measured local degree of anisotropy by 0.1–0.2 at small scales. In terms of the characterization of the structure this seems undesired as the map consists of highly anisotropic clumps. The peak is however more pronounced, allowing for a more reliable measurement of the sizes of the anisotropic structures.
The plateau parameters in Sect. 3.1.3 suggest that at the 90% level the peaks in the wavelet spectra depend only slightly on the localization parameter b while the peak plateau in the degree of anisotropy widens with b2. To evaluate this scale sensitivity as a function of the filter shape we compute the wavelet spectra and degrees of anisotropy for the clumps with σ = 8 × 32 pixels from Fig. 13 when changing the filter shape. The results are shown in Fig. 21. For a direct comparison, we also include the curves for the b = 1 filter already shown in Fig. 13, and to expand the parameter range, we also add results for b = 1∕2. As expected, the position of the peaks of the wavelet spectra shows negligible change. However, the decay at small scales changes significantly. The spectra become shallower when lowering the localization parameter b approaching the spectra measured with the Δ-variance (see Appendix B). A higher b parameter therefore seems favorable for a sensitive size determination. In the local degree of anisotropy, we have the opposite effect however. The peak becomes narrower when reducing the b parameter allowing for a better characterization of the size of anisotropic structures. On the other hand, we find a decrease of the contrast of the peak that prevents a good characterization of the degree of anisotropy when going to very low b parameters. A good compromise is given by  providing a pronounced peak and degrees of anisotropy up to about 0.8.
When inspecting the maps of wavelet coefficients we also find that the narrow  filter leads to an improved localization of the coefficients, which now follow the individual clumps in the map more closely being less extended along their edges. This has a positive side effect: the analysis becomes less sensitive to superposition effects, better measuring the properties of individual clumps instead of the impact of their mutual alignment or misalignment. This is demonstrated in Fig. 22, which shows the local degree of anisotropy for the same clump configurations already analyzed in Fig. 13. Compared to Fig. 13, the distortion of the anisotropy spectra of the individual clumps due to the superposition of 10 or 100 of them is noticeably reduced, but still significant.
The selection of the best localization parameter b of the filter requires some compromise. A large b value provides a poor localization in the map space, but an accurate localization in terms of the angular spectra à (s, φ) and steeper wavelet spectra, allowing for a more accurate measurement of the minimum structure size. However, when looking for the location of spines of filamentary structures in maps of wavelet coefficients, a smaller isotropic filter is preferable. The better localization of the filter with a smaller b also decreases the impact of superposition effects. Moreover, a smaller extent of the filter in the y direction reduces the bias of the method towards the most elongated structures better identifying contributions from structures with moderate anisotropies; it also produces sharper spectra of the degrees of anisotropy that give access to a more accurate determination of the filament aspect ratio. On the other hand, this change lowers the contrast in the measured degree of anisotropy and provides smoother spectra of isotropic wavelet coefficients turning them as broad as the Δ -variance spectra that represent the limit of fully isotropic wavelets. To allow for a systematic comparison of all these effects for individual cases we provide the results from two filters with  and
and  for a set of our test structures in Appendix E.
To exploit the full strength of the method, we combine the analysis with different filter shapes depending on the quantity to be measured. In the following, we use the  filter when showing spectra of isotropic or anisotropic wavelet coefficients so that we are as sensitive as possible to the size of the structures. This provides a fixed relation between the peak of the isotropic wavelet spectra and the width of elongated filaments,
  with an 8% error due to the unknown density structure (see Sect. 3.1.4). This filter is also used for the 2D angular spectra of anisotropic wavelet coefficients Ã(s, φ) to obtain the best resolution in scales and angles. To best measure the anisotropy of all filaments we use the
  filter for thespectra of the degrees of anisotropy; it is also used to show the spines of individual filaments in maps as it localizes their positions more accurately. To be sure that we did not overlook any characteristic scales or structures in the maps we always applied both filters and compared their results, but we only show the above mentioned combination of results in the following unless explicitly stated.
 |
Fig. 20 Comparison of the degrees of anisotropy measured by different filter shapes in the anisotropic wavelet analysis for the ensembles from Figs. 14 and 15 containing clumps with σ = 6 × 18 pixels and σ = 3 × 27 pixels where eitherof the two types is aligned. |
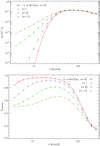 |
Fig. 21 Comparison of the wavelet spectra and local degrees of anisotropy measured by different filter shapes for maps containing randomly placed and oriented ellipses with a size of σ = 8 × 32 pixels (see Fig. 13). The wavelet spectra are normalized relative to a slope of unity and the variance in the map. |
 |
Fig. 22 Comparison of the local degrees of anisotropy measured by the filter with |
4 Application to MHD simulations
4.1 Model setup
To investigate whether the method presented here can be used to quantify the role of magnetic fields in the formation of anisotropic density structures in interstellar clouds, we apply the method to a simulation of isothermal compressible MHD turbulence with well controlled properties introduced by Burkhart et al. (2013a). As a test set, we selected the model of supersonic (Ms = 7) and sub-Alfvénic (MA = 0.7) turbulence (model 5 from Table 1 in Burkhart et al. 2013a). It is characterized by a very filamentary density structure without any obvious preferential direction, but a relatively anisotropic velocity structure that is due to the combination of the magnetic field and the large-scale turbulent driving. Figure 23 shows the column-density together with the density and line-of-sight velocity in a slice through the simulation. The initial magnetic field in the simulation was set up parallel to the x direction. The velocity structure traces this anisotropy by forming regions of constant velocity flows parallel to the magnetic field. In contrast, the density is dominated by individual narrow compression regions.
The radiative-transfer simulations in Burkhart et al. (2013a); Burkhart et al. (2013b) showed that in maps of integrated line intensities optically thin tracers follow the highly entangled filamentary structure of the density field while optically thick lines rather reflect the anisotropic velocity field resulting in thick filaments parallel to the magnetic field direction.
Following the approach described in Burkhart et al. (2013a) we generate spectral cubes of the 2–1 transition of different CO isotopologs from the simulation using the SimLine-3D radiative-transfer algorithm (Ossenkopf 2002). The code computes the excitation of the molecules from collisions with the surrounding gas and from the radiative excitation at the frequencies of the molecular transitions through line and continuum radiation impinging from the environment. In a second step it solves the ray-tracing problem computing the observable intensities as a function of the line velocity so that we obtain position–position–velocity cubes of the molecular lines. The simulation is scaled to a total size of 5 pc and a uniform gas temperatureof 10 K is assumed.
To test the impact of the radiative transfer on the observable structure we simulate the same molecular line, using the parameters of the 13CO 2–1 transition, but change the molecular abundance to represent different optical depths. Molecular abundances of  , and 4.5 × 10⁻⁵ provide results that are roughly representative for observations of the C18O, 13CO, and 12CO isotopologs (see e.g., Langer & Graedel 1989; Bolatto 2013). Mean line-center optical depths in the simulations are τ = 0.1, 3.4, and 74 for the three abundances. The resulting velocity integrated intensity maps are shown in Fig. 24. Channel maps for the component with zero line-of-sight velocity, v = 0, are shown in Fig. 25.
Inspection of the maps of line-integrated intensities in Fig. 24 by eye confirms the findings from Lazarian & Pogosyan (2004) and Burkhart et al. (2013b) on the impact of the optical depth on the size spectrum of the observable structures. When integrated over a broad velocity range, the intensity maps show fewer small-scale structures at high optical depths. Larger structures become more prominent when moving to high optical depths; this means that the power spectrum of the maps becomes shallower. On top of this known behavior, we see, however, that there is also an alignment effect. All maps appear very filamentary but while the filaments at low optical depths (X = 5 × 10⁻⁸) show no preferential direction, those at high optical depths (X = 4.5 × 10⁻⁵) are mainly aligned parallel to the x axis. They trace the velocity and magnetic field structure.
The channel maps do not integrate over the velocity structure therefore providing a different combination of density and velocity structure (see e.g., Lazarian & Pogosyan 2000). The optically thin channel map in Fig. 25 is very similar to the structure also seen in the line-integrated map. For the map with an optical depth of 3.4 there is still some resemblance but in the high-optical-depth case the v = 0 channel map looks completely different from the integrated line map. The two cases with a significant optical depth also show some increase of the typical structure size in the channel maps, but this is less prominent than for the integrated line maps. This matches the predictions from Lazarian & Pogosyan (2004) that thin slices show a steeper power spectrum than integrated maps for our parameters. In contrast to the integrated line maps, the high-optical-depth channel map does not show a clear global alignment of the structures. At the highest optical depths some alignment perpendicular to the magnetic field direction even seems to appear. For a quantification of these effects we need to apply the anisotropic wavelet analysis to all six maps.
 |
Fig. 23 Total column density and central slice through the density and the line-of-sight velocity structure of the supersonic, sub-Alfvénic MHD turbulence simulation analyzed (Burkhart et al. 2013a). |
 |
Fig. 24 Maps of line-integrated intensities of the J = 2 − 1 transition of CO isotopologs computed for the MHD simulation from Fig. 23. The molecule abundances in the three panels are X = 5 × 10⁻⁸, 1.5 × 10⁻⁶, and 4.5 × 10⁻⁵. |
 |
Fig. 25 Channel maps for the v = 0 velocity channel of the line from the radiative-transfer simulations shown in Fig. 24. |
4.2 Wavelet analysis
Figure 26 shows the normalized spectra of isotropic wavelet coefficients for the integrated line maps (Fig. 24) and the maps of the v = 0 velocity slices (Fig. 25) in the three simulations. In the optically thin case, the spectra of the integrated line map and the channel map agree. They show a relative surplus of small-scale structures and a lack of structures with sizes above 1 pc compared to the other maps. The maps with the larger optical depth are characterized by wavelet spectra with a higher contribution from larger scales and a lower contribution from small-scale structures, corresponding to a higher slope between 0.1 and 1.5 pc. In agreement with the discussion by Burkhart et al. (2013b) larger optical depths blur out all small filaments and merge them into large systematic structures. The suppression of small-scale structures shifts the peak of the normalized spectra from 0.15 to 0.35 pc. The line-integrated intensity maps are more affected than channel maps. At the largest optical depths the isotropic wavelet coefficients form a plateau that extends up to s ≈ 1.5 pc. Using the calibration of the plateau edge for highly elongated Gaussians from Sect. 3.1.3 this corresponds to a maximum filament width of σminor ≈ 0.2 pc or a FWHM ≈ 0.45 pc. This number is in rough agreement with the visual impression for the width of the large filaments in Figs. 24 and 25. In the optically thinner maps on the other hand we see a continuous hierarchy of smaller and smaller filaments.
Figure 27 shows the spectra of the local (top panel) and global degrees (bottom panel) of anisotropy for the six maps. At small scales the local anisotropy is high in all maps, the highest degree is seen in the channel map for the case with high optical depth. The degree of local anisotropy slightly decreases with scale. For the optically thick maps it remains high up to scales of s ≈ 0.7 pc, suggesting an increase of the filament length with the optical depth. However, even the optically thin maps still show a significant local anisotropy up to the largest scales, indicating that the individual small filaments visible in the maps create a hierarchy of filamentary structures at larger and larger scales.
The biggest difference between the maps at high optical depths and those at low and moderate optical depths shows up in the global degree of anisotropy. The global alignment visible in the maps creates a degree of global anisotropy of about 0.5 up to scales of s ≈ 0.7 pc for the optically thick maps while there is negligible global anisotropy in the other maps at those scales. The difference between the curves of the optically thick channel map and the corresponding line-integrated map indicates that the globally aligned structures are somewhat longer for the integrated map. Some accidental global anisotropies show up in all maps at the largest scales when the individual filaments merge in all cases.
Altogether, this approach helps to quantify the imprint of the magnetic field on the structure formation as a function of the spatial scale. Small-scale filaments are entangled with the field lines while the large-scale magnetic field preserves the global anisotropy. As the density structure is dominated by the small-scale fluctuations while the velocity structure inherits more of the global anisotropy, we can exploit the different selectivity of optically thin and thick maps for the two aspects to characterize the anisotropy in both structures. Higher optical depths emphasize the global anisotropy; they produce maps with wider filaments aligned withthe global magnetic field as they trace the broader velocity dispersion on larger scales and the connection of the velocity field to the magnetic field structure. Optically thin lines trace the individual small-scale shocks dominating the density structure without any preferred direction. Both structures are filamentary, but the ratio between local and global anisotropy clearly separates them. The spectra of wavelet coefficients allows us to quantify the distribution of the filament widths.
 |
Fig. 26 Spectra of normalized isotropic wavelet coefficients |
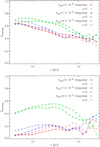 |
Fig. 27 Spectra of the local degree of anisotropy (top panel) and the global degree of anisotropy (bottom panel) for the six maps from Figs. 24 and 25. The filamentary density structure seen at low optical depths provides a high degree of local anisotropy at small scales. But those filaments appear unaligned. For large optical depths (brown and purple curves) the velocity filaments dominate and the global anisotropy in the x direction becomes significant. Following Sect. 3.6, the |
5 Observed maps
To verify whether our method confirms the findings of André et al. (2014) and Arzoumanian et al. (2011) that most filaments in different clouds have a characteristic FWHM of about 0.1 pc, we apply our analysis to two different column-density maps obtained from observations of the ESA Herschel Space Observatory (Pilbratt et al. 2010). The Aquila rift and Polaris Flare are very different regions and have already been compared by André et al. (2010) and Schneider et al. (2013). The Aquila rift is an active high-mass star-forming region while the Polaris Flare is still quiescent at a much lower density. Because of the different conditions a common property such as a uniform filament width would provide an important hint regarding the underlying physics governing the ISM structure independent of the evolutionary state. The two column-density maps are shown in Fig. 28. The column densities were taken from André et al. (2010) and Könyves et al. (2015). They were obtained by a gray-body fit to the Herschel PACS and SPIRE continuum maps and have a resolution of 36 arcsec. For practical reasons, we give the column density in units of the visual extinction AV using the standard extinction factor NH ∕AV = 1.87 × 1021 cm−2 mag−1 (Bohlin et al. 1978). This avoids wavelet coefficients of order 1045.
To discuss the properties of individual filaments and to compare our results with filament finders such as DisPerSe (Sousbie 2011) or getFilaments (Men’shchikov et al. 2010) it is useful to directly inspect the maps of anisotropic wavelet coefficients localizing the individual filaments (see Fig. 12). In Fig. 29, we show the coefficient maps for two filter sizes applied to the Polaris column-density map. The colors represent the results for the localization parameter  that should best trace the places of the filaments. In the maps from both filter sizes the main filament, often called the “saxophone”, dominates the wavelet coefficients. In the map for the small filter size, chains of peaks follow the spines of the individual filaments. The widespread emission and more isotropic structures, seen, for example, in the eastern part of the map, are filtered out. Comparing the map of wavelet coefficients with the original map provides a good indication of which structures provide the main anisotropies. For the larger filter, the somewhat broader structures east of the saxophone also provide a significant contribution. More extended low-column-density filaments become visible. In this way we can identify different types of filaments. The coefficients for very small filter sizes follow the filament spines also traced by the filament finders. The coefficients for larger filters trace larger and larger filamentary structures that are not necessarily correlated with those at small scales. By providing the full spectrum of wavelet coefficients our analysis is not biased towards structures of a particular size or width.
In the plot for the larger filter size, we include the equivalent results from the  filter, shown as contours. This filter has the better angular resolution but a lower spatial sensitivity. The contours show the same peaks but do not trace the shape of the filaments in the same way as the coefficients from the
  filter. They are more roundish, and do not follow all the spatial variations that are seen in the color maps. We did not overplot the contours for the small scale as they only show the same behavior; they do not add new information, but make the picture less readable. Equivalent plots for the Aquila map mainly trace the main ridge and the associated filaments visible in the central northern part of the map.
Figure 30 shows the rescaled spectra of the isotropic wavelet coefficients, the angular spectrum of anisotropic wavelet coefficients, and the degrees of anisotropy for the Polaris column density map obtained from the different filter shapes. As we are interested in the anisotropy, angular distribution, and size distribution of the filaments we show the results for two different filter shapes again. The spectra of isotropic wavelet coefficients show relatively little variation between 0.03 and 1 pc. The  filter picks up a weak broad peak around 0.12 pc, corresponding to a filament FWHM of about 0.045 pc. In this scale range the angular spectrum shows a wide distribution of weak filaments at all angles, weakly concentrated around two contributions that are approximately perpendicular at 0.03 pc and merge into a broad peak at about φ =40 degrees at 0.5 pc. The resulting local degree of anisotropy is approximately constant at 0.4, and the global degree of anisotropy is slightly increasing due to the convergence of the angular components. As expected from the studies in Sect. 3.6, the angular spectrum for the
  filter is better confined in spatial and angular scale. The smaller localization parameter
  instead leads to the detection of more small-scale anisotropic structures leading to a somewhat higher local degree of anisotropy below 1 pc.
A single prominent structure appears at a scale of about 1.1 pc at angles between 45 and 60 degrees. It can be attributed to the saxophone and corresponds to a minimum filament width of σminor = 0.18 pc or a FWHMof about 0.4 pc. This matches the width of the main “saxophone” filament that represents the main anisotropy in the map at those scales. Here, the local degree grows to a value of 0.55, the global one to 0.35. At larger scales all coefficients drop again. A secondary, smaller peak appears at the scale of the map size where the emission pattern appears as an approximately horizontal strip in the map. In contrast to Sect. 3.6, the  filter detects a somewhat larger local degree of anisotropy. This is expected for curved filaments where the better-localized
  filter can follow the structure of the filament while the
  filter provides higher coefficients for straight filaments. At very small scales where no cloud structure can be resolved in the finite resolution of the map the spectra are dominated by observational noise, visible as an increase of the wavelet coefficients in the two upper plots. In this small scale range we cannot expect to measure any significant structure size, as discussed in Sect. 3.1.3.
Even with the scale-sensitive  filter we find no statistically significant excess of structure corresponding to a filament width around 0.1 pc. At all scales below about 0.4 pc the spectrum indicates an almost self-similar hierarchy of smaller and smaller filaments without any prominent scale. The saxophone only represents the upper end of that hierarchy. The wavelet analysis provides no support for a universal filament width.
To focus on the characteristic scales in the Aquila column density map we also show the analysis results for the  filter. Figure 31 contains the 2D spectrum of wavelet coefficients A(s, φ) and the coefficients normalized by the spectrum of isotropic modes, providing the angular degree of anisotropy à (s, φ). The Aquila spectrum differs strongly from the Polaris spectrum; it is dominated by a single warped filament that covers all scales from 0.05 pc to the map size. Apart from a structure at an angle of ϕ = −0.6 rad = −35 degrees, stemming from the filaments east of the main ridge, all other structures are statistically negligible compared to the main filament. The corresponding map of wavelet coefficients shows a single strong peak at the location of the main ridge in the upper center of the map.
Figure 32 compares the resulting spectra of the wavelet coefficients and the degrees of anisotropy for the Aquila map with the Polaris results. Between 0.15 and 0.7 pc, both maps show an approximately self-similar scaling with about the same exponent Mi (s)∕s2 ∝ s−0.3 corresponding to a power spectral index of β ≈ 2.7. The local degree of anisotropy is approximately the same at all scales. However, we find three main differences: the Aquila spectrum steeply rises at small scales. At large scales it drops already above 0.8 pc compared to 1.3 pc for Polaris, and the global degree of anisotropy is significantly higher in Aquila.
Part of the rise of the Aquila spectrum above the beam size may stem from the blurring of the observable structure by the telescope beam as discussed in detail for the Δ-variance by Bensch et al. (2001). The finite resolution suppresses variations at scales of up to a few beam sizes. In Polaris the effect is present as well, but is compensated by observational noise. The difference between the two spectra in this scale range is thus consistent with the significantly higher signal-to-noise ratio in Aquila compared to Polaris.
The relative lack of structure at scales above 0.8 pc in Aquila is accompanied by a peak in the local and global degree of anisotropy that also falls at smaller scales compared to Polaris. The two quantities measure width and length of filaments (see Sect. 3.1.3). As there is only a very broad peak in the wavelet spectrum for Aquila, we can only use the upper edge criterion to measure the maximum filament width. The ŝ90% scale of 0.7 pc corresponds to a FWHM of 0.21 pc. This matches approximately the width that one would measure naively with a ruler for thecyan area around the brightest structure in the map (Fig. 28). The peaks in the degrees of anisotropy at s= 0.6 pc for Aquila and at 1.1 pc for Polaris correspond to a similar difference in the filament length of a factor two. For Aquila the upper end of the filament hierarchy falls a factor of two below the one for Polaris, both in filament length and width.
Smaller filaments are preferentially aligned with the main filament, creating a coherent structure in the à (s, φ) diagram; the resulting global degree of anisotropy closely follows the local degree of anisotropy, quite different from the Polaris behavior. Incontrast to Aquila, the Polaris map shows much weaker global anisotropy; it shows a highly filamentary nature measured by the local anisotropy but the filaments with scales below 1 pc are oriented in random directions. Around 1 pc the saxophone dominates as a global structure.
We can use the degree of anisotropy to address the question of whether the cloud structure is “dominated” by filaments (Federrath 2016). Using a threshold of  for such a distinction, the lower panel of Fig. 32 shows that both Polaris and Aquila fall at approximately this limit for all scales between 0.05 and 1.3 pc. Globally, the maps are neither dominated by isotropic nor by anisotropic structures. Isotropic fluctuations are dominant at the scale of the clouds and close to the resolution limit, while anisotropic fluctuations are slightly higher at the scales of the lengths of the two dominant filaments in the maps, at 0.6 and 1.1 pc, respectively. To study whether this global result also holds true locally, Fig. 33 shows the map of the local degree of anisotropy equivalent to Fig. D.2. When we compare it with the corresponding map of anisotropic wavelet coefficients in the lower panel of Fig. 29 we find no clear correlation to the amplitude of the wavelet coefficients. Around the saxophone the degree of anisotropy is high on average, but not across the whole structure. Low degrees are found for example at its southern end. This variation of the degree continues through the whole map. High degrees of anisotropy are usually seen at the centers of visible filaments but low degrees occur at their ends. The same is true for other size scales and for the corresponding Aquila maps. The local degree of anisotropy varies strongly across the whole map. An area-weighted average is close to the wavelet-coefficient weighted average in
  . A dominance of filamentary structures is therefore only seen in confined parts of the clouds. Globally, isotropic and anisotropic fluctuations are comparable.
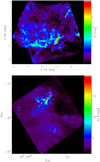 |
Fig. 28 Column-density maps of the Polaris and Aquila regions derived from Herschel dust emission data previously analyzed by André et al. (2010), Schneider et al. (2013), and Könyves et al. (2015). As the map of Polaris includes the celestial pole, coordinates are given relative to 3h 28m 16.0s, 88°34′ 32.0″ (J2000). One degree in the map corresponds to 2.6 pc in Polaris and 4.5 pc in Aquila. We specify the column density in terms of the visual extinction using the standard factor NH ∕AV= 1.87 × 1021 cm−2 (Bohlin et al. 1978). |
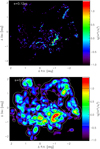 |
Fig. 29 Maps of the amplitude of the anisotropic wavelet coefficients |ma(s, x)| in logarithmic scaling for the Polaris column-density map. Upper panel: coefficients for the filter sizes of s = 0.12 pc = 0.044°, lower panel: a filter size of 0.56 pc = 0.21°. In both maps the colors show the results for the |
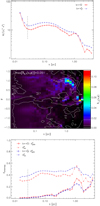 |
Fig. 30 Spectra of isotropic wavelet coefficients (top panel), angular spectrum of anisotropic wavelet coefficients (central panel), and local and global degrees of anisotropy (bottom panel) for the Polaris column-density map computed for filter parameters of |
 |
Fig. 31 Two-dimensional spectrum of anisotropic wavelet coefficients (contours) and degrees of anisotropy (color) for Aquila. The contours are drawn at levels of 1/30, 1/10, and 1/3 of the peak value indicated in the top-left corner of the plot. The angles are plotted in radians. |
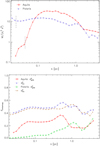 |
Fig. 32 Spectra of rescaled isotropic wavelet spectra Mi(s)∕s2 (top panel, |
 |
Fig. 33 Map of the local degree of anisotropy |ma(s, x)|∕mi(s, x) for the Polaris column-density map when using the |
6 Gravitational stability
The spectra of isotropic and anisotropic wavelet coefficients provide us with a means of directly comparing the relative amount of structure in isotropic and filamentary modes. When interpreting the filaments as cylindrical structures we can measure the relative importance of spherical and cylindrical collapse modes by comparing the power in isotropic and anisotropic structures. As their relative importance changes as a function of scale and position in the maps we can try to use the anisotropic wavelet analysis to constrain the local collapse modes.
The standard criterion for gravitational instability is the Jeans criterion, first computed for an unbound spherical mass distribution (Jeans 1902). Equivalent criteria can be derived for various geometries, differing from the original criterion by prefactors around unity. The first solution for the geometry of an infinite cylinder was provided by Stodółkiewicz (1963) and Ostriker (1964). They found a hydrostatically stable configuration for an isothermal cylinder that is described by a Plummer density profile with an exponent p = 4 providing a steep boundary to the filaments described. It is described by a mass per length of
 (21)
(21)
Here, G describes the gravitational constant and cs is the soundspeed in the gas. More massive filaments will undergo radial collapse, finally leading to fragmentation and star formation (see e.g., discussion in Anathpindika & Freundlich 2015).
Relatively similar spherically symmetric configurations are described by Bonnor-Ebert spheres (Ebert 1955; Bonnor 1956), solutions of the hydrostatic equations for isothermal spheres confined by some external pressure. They consist of a central part with a relatively constant density and an outer density decay inversely proportional to the square of the radius, similar to Plummer profiles with p =2. The critical Bonnor-Ebert sphere is the densest stable solution, with a density contrast of 14 between the center and the outer boundary and a mass of
 (22)
(22)
(e.g., Fischera & Dopita 2008). The quantity ρc denotes the central gas density.
Both criteria can be translated into an approximate criterion for the column density when treating the clumps or filaments as uniform spheres or cylinders, ignoring the density variation within them, and substituting the core density ρc by the peak column number density
 (23)
(23)
where R is the radius of the sphere or cylinder and μ the average molecular mass. Together with the relations between density, size, and mass of a sphere and cylinder, we can write them as new criteria for the gravitational instability
![\begin{eqnarray}\hat{N} R &>& \left[ {1\over 2} \left({3\over \mathrm{\pi}}\times 4.42 \right)^2\right]^{1/3} {c_{\textrm{s}}^2 \over G \mu} \nonumber\\ & \approx & 2.07 \, {c_{\textrm{s}}^2 \over G \mu} \; \textrm{for\; spheres},\\ \hat{N} R &>& {4 \over \mathrm{\pi}} {c_{\textrm{s}}^2 \over G \mu} \nonumber\\ & \approx & 1.27 \, {c_{\textrm{s}}^2 \over G \mu} \; \textrm{for\; cylinders}\,. \end{eqnarray}](/articles/aa/full_html/2019/01/aa31596-17/aa31596-17-eq103.png)
The factor  cm−2 pc for isothermal molecular gas with a temperature of 15 K and an average molecular mass of 2.36 atomic hydrogen masses, typical conditions for molecular clouds (e.g., Mac Low & Klessen 2005). With these criteria the easily measurable product of column density and radius of the structures allows us to estimate their stability simply as a function of their temperature independent of the difficult-to-measure density. We can use any measurement of the product of column density and the smallest 1D extent of a structure to characterize the gravitational stability of the structure, both for filaments and cores. For H2 gas we simply have to divide the column density NH from Fig. 28 by a factor of two.
As the wavelet analysis provides a way to measure column-density fluctuations as a function of their size and geometry we can interpret the wavelet coefficients in terms of the stability analysis using the criteria from Eqs. (23) and (24). If we use the observed column density N as the map function f in Eq. (1) the wavelet transform W will scale as Ns1∕2 because the wavelet ψ is not normalized relative to s (Eq. (3)) meaning that it provides an s2 contribution in the integral. We thus obtain a scaling of the wavelet coefficients  . When multiplying the wavelet coefficients m with the wavelet scale s we obtain a quantity that measures the gravitational stability modes,
  . Maps of
  and
and  characterize the gravitational stability of structures of varying size. The isotropic coefficients mi characterizes the total variations while we can assign ma to anisotropic collapse modes. By comparing the coefficients
  and
and  with the critical values
  from Eqs. (23) and (24), the wavelet coefficient maps provide information on the individual collapse modes for every point and scale s.
If a map is dominated by a single structure, we can assess its stability using the average coefficients Mi (s) and Ma (s) discussed in the previous chapters. The contribution of the wavelet coefficients mi (s, x), ma (s, x) of an individual structure to the average over the whole map (Eq. (4)) is scaled by the area over which the coefficients of that structure contribute. Due to the blurring nature of the wavelets, the area is proportional to s2, meaning that the relative contribution of any structure to the average spectrum is given by  , where lmap gives the linear size of the whole map. With the contribution of the individual structure to the total normalized wavelet spectrum Mindiv ∝ m × s2 we obtain the stability of individual structures from
  . Consequently, we can judge the gravitational stability in an analyzed map by taking the square root of the normalized wavelet spectra M∕s. For the example of a singular isothermal sphere (Appendix E) M∕s is flat, in line with the scale-independence of this configuration being equally stable or unstable at every scale.
For real maps we always have a hierarchy of filaments in the map. Due to the linear nature of the wavelet analysis their contributions add up in the wavelet spectra, and therefore we cannot judge the stability of any individual structure from the global spectrum. Instead we need to select a particular contribution. We focus here on the single structure that dominates the wavelet maps mi and ma providing their maxima. For the two observed maps, the maxima of mi and ma correspond to points in the saxophone region in Polaris and in the main ridge in Aquila. The spectra of  and
and  then quantify the gravitational stability of the spherical and cylindrical modes in the main structures.
In Fig. 34, we show the spectra of the maxima of the wavelet coefficients  and
and  relative to the critical values
  cm−2 pc and 0.83 × 1021 cm−2 pc for spherical and cylindrical collapse modes, respectively. To guarantee the best localization of the wavelet coefficients on the filaments we used the
  filter here. Inspection of the maps of mi and ma shows that the peaks in the two maps that are used to compute the stability spectra are usually very close. The anisotropic modes always peak at the centers of the filaments with the main peak given by the center of the saxophone and the Aquila rift, while the isotropic modes cover some broader regions around the filaments.
The absolute magnitude of the wavelet coefficients confirms that the Polaris main filament is subcritical for the assumed temperature of 15 K. No collapse is expected there. In contrast the ridge in Aquila should be collapsing over a broad range of scales. This is in line with the known star-formation activity in the two regions. In both regions we find a clear dominance of the anisotropic instability. Cylindrical collapse modes will dominate. The Aquila spectra show that the limit for the cylindrical gravitational instability is reached at scales of 0.15 pc, the spherical limit is only reached at sizes of 0.2 pc. On scales of 2 pc and higher, filamentary collapse is no longer preferred over radially symmetric collapse, both are similarly unstable. The maximum of the anisotropic spectrum at 0.7–0.8 pc suggests that the structure at that size is as unstable against filamentary collapse as the whole cloud.
For the Polaris saxophone the isotropic and anisotropic spectra differ by an almost constant factor, in agreement with the constant local degree of anisotropy around  measured in the whole Polaris map (Fig. 32). This indicates that we have a uniform distribution of “filamentariness”, describing the contribution of filaments of all scales to the overall structure, throughout the whole region. In contrast, for the Aquila map we measured about the same local degree of anisotropy, but now find that for the most unstable structure the dominance of the anisotropic modes is limited to scales between approximately 0.04 and 2 pc. This suggests a higher filamentatariness of other structures on smaller and larger scales. To understand the full distribution of the filamentariness across a map it is therefore necessary to combine the spatial information with the spectra.
In the case of supercritical gravitational modes we can go one step further by determining the minimum scale scrit for which the condition of supercriticality  is met. From this quantity we can assess the size of the region affected by the characteristic collapse mode for the density distribution around the considered point. As the free-fall time only depends on the density, the collapse time should also follow the pattern measured by the critical length scale. Figure 35 shows this map of critical scales computed from the wavelet coefficients for the Aquila column densities. White areas in the map indicate regions with densities that are too low for collapse. The corresponding figure for Polaris would be white only.
First wenotice the global consistency of the map values with the map topology. The red region, showing a critical size scrit ≈ 3 pc has a radius of approximately 3 pc, the green region indicating scrit ≈ 1.2 pc has a radius of 1.2 pc, and so on. Fast collapse on small scales is only expected within the main filament. The anisotropic modes cover a more elongated region compared to the isotropic modes. The anisotropic modes also show a significant instability for the side arm of the main rift further east. Both modes identify the most unstable structure within the main filament, the minimum for the anisotropic modes is slightly further southeast compared to the isotropic modes.
Assessing the gravitational stability of structures in an observed map from the wavelet analysis only is of course a very crude approximation as it ignores all information about the dynamics in the gas flows and the details of the geometry of the individual structures, decomposing them into two modes only. However, it allows for a qualitative assessment of the behavior of the different regions and the relative importance of cylindrical versus spherical collapse modes. Observations of molecular lines should be used to verify a relation between these column-density-based gravitational instability modes and the actual velocity field of infalling gas.
 |
Fig. 34 Gravitational stability spectra for the dominating structures in the two maps from Fig. 28. The isotropic and anisotropic wavelet coefficients mi and ma characterize the size dependence of the local column-density variation. Taking the size-scaled coefficients relative to the critical values of |
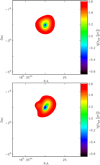 |
Fig. 35 Maps of the critical size for gravitational instability in the Aquila column-density map (Fig. 28). Upper panel: critical scale for isotropic modes, lower panel: anisotropic modes. White areas are regions with densities that are too low for collapse. |
7 Conclusions and outlook
The anisotropic wavelet analysis inherits the strengths of the Δ -variance (Stutzki et al. 1998; Ossenkopf et al. 2008) but allows us to quantify and distinguish local and global anisotropies and measure the size of filaments (Sect. 3.1). In contrast to many existing filament finders it is not biased by typical selection effects as discussed for example by Panopoulou et al. (2017). Therefore, it can provide a spectrum of filament widths from a data set starting from the resolution limit up to about 20% of the map size. However, the spectra of wavelet coefficients and degrees of anisotropy result from a combination of the size spectrum of filaments with the distribution of their aspect ratios (Sect. 3.5). Here, we concentrated on the derivation of the size range of filaments. The derivation of the full distributions from the slope of the spectra will be the topic of a subsequent study. Similarly, an assignment of anisotropic structures in a map to underlying prolate or oblate 3D structures is only possible with a priori knowledge on their aspect ratios (Sect. 3.4).
Maps of wavelet coefficients allow one to identify the spines of filamentary structures of a particular scale (Sects. 3.2 and 5), to quantify the angular distribution of the different filaments (Sect. 3.3), and to measure the local and global degree of anisotropy and angular alignment for the structures in a map (Sects. 3.3 and 3.6).
The application of the analysis to molecular line maps from MHD simulations in Sect. 4 confirms the findings from Lazarian & Pogosyan (2004) and Burkhart et al. (2013a) about the impact of the optical depth on the size spectrum of the observable structures. With increasing optical depth wider filaments become more prominent reflecting the broader velocity dispersion on larger scales and the global magnetic field structure. The observed filament sizes depend on the combination of magnetic-field-dominated density-velocity correlations and radiative-transfer effects. This can be exploited by observing tracers with different optical depths. Optically thin lines trace small-scale filaments that are entangled with the field lines while optically thick lines alternatively trace the velocity structure that inherits more of the global anisotropy from the large-scale magnetic field. Both types of maps show filamentary structures, but the ratio between local and global anisotropy clearly separates them.
Applying the analysis to column-density maps obtained from Herschel observations (Schneider et al. 2013) in Sect. 5, we find a broad range of filament widths. We do not find a universal characteristic filament width but an approximately self-similar behavior covering at least a factor of four in Aquila and a factor of ten in Polaris. The self-similar range can be somewhat smaller when assuming an intrinsic p = 2 Plummer profile. The main filament in Polaris, which has a width of 0.4 pc, is accompanied by many smaller filaments. They have no preferred direction so that a high degree of local anisotropy is not leading to a global anisotropy. In contrast in the Aquila map the main filament, which has a total width of 0.2 pc, dominates the statistics. However, it also splits up into a hierarchy of associated subfilaments that are closely related in position and orientation. Consequently the Aquila map shows a significant global anisotropy. Globally the degree of anisotropy in both maps falls at about 0.5, indicating no clear dominance of either isotropic or anisotropic fluctuations. Locally, the situation may be different.
For individual structures we can measure the relative importance of spherical and cylindrical collapse modes by comparing the power in isotropic and anisotropic fluctuations (Sect. 6). By translating the gravitational stability criteria for isothermal gas in a Bonnor-Ebert sphere or a hydrostatic cylinder into a product of central column density and size we obtain an equivalence to the isotropic or anisotropic wavelet coefficients. The application to the observed column-density maps shows that in both the regions studied, the cylindrical modes dominate for the largest fluctuations in the maps. In Polaris, this dominance is independent of scale, in Aquila the spherical modes are comparable to the cylindrical ones at scales below 0.05 and above 1.5 pc. The amplitude of the gravitational modes is much higher in Aquila compared to Polaris. For a gas temperature of 15 K, the higher column density in Aquila leadsto mode amplitudes above the limit for gravitational stability. They should lead to collapse at all scales above0.15 pc. All resolved structures in the Polaris Flare are gravitationally stable. Measuring the critical spatial scalefor a gravitational mode should allow us to estimate the size of a region affected by a particular collapse mode. Fast collapse is expected around the main Aquila rift, but larger regions should contribute to mass accretion.
This pattern requires observational verification. Molecular line measurements should trace the change of the velocity structure across that region to test the correlation between the gravitational modes computed from the column density and actual infall motions.
To constrain the scope of this paper we have limited ourselves to the 2D case here. However, it is essential to study the relation between 3D filamentary density structures and their projection in observable 2D maps. Therefore, we plan to extend the method to three dimensions in a subsequent paper.
Acknowledgements
This project was financed through DFG project number Os 177/2-2. We thank Tigran Arshakian for taking a major initiative in the collaboration and for many useful discussions. We are grateful to Blakesley Burkhart for providing us with the MHD simulations analyzed in Sect. 4 and Nicola Schneider for providing us with the column-density maps analyzed in Sect. 5. We thank an anonymous referee for an extremely detailed and constructive report on the first version of the manuscript.
Appendix A Analytical expressions for single Gaussian ellipses
For the special test case consisting of a single Gaussian elliptical clump we can provide an analytic solution of the wavelet analysis that can serve as a reference. We define the Gaussian ellipse as
 (A.1)
(A.1)
where the prefactor provides a normalized integral of  . To keep the equations shorter we use a notation here that deviates from the main text in using directly the letters a and c for the standard deviations of the main axes, not σa and σc.
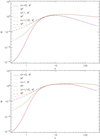 |
Fig. A.1 Wavelet spectra from the analytic wavelet convolution of elliptical Gaussians with axes of 1 × 3 pixels (top panel) and 1 × 9 pixels (bottom panel), respectively. |
 |
Fig. A.2 Degree of local and global anisotropy from the analytic wavelet convolution of elliptical Gaussians with axes of 1 × 3 pixels and 1 × 9 pixels. |
The wavelet transform of g(x, y) gives
 (A.2)
(A.2)
where we neglect the constant exp(−π2b2) in Eq. (3). Its contribution to the result is less than 1% even for the smallest b used here. The resulting maps of isotropic mi and anisotropic ma are given by
![\begin{eqnarray}m^i(s,x,y)&=&\displaystyle\frac{4 \mathrm{\pi} ^2 a b^2 c s \times I_0\left(\displaystyle\frac{2 b^4 (c^2-a^2) \mathrm{\pi} ^2 s^2}{\left(2 a^2+b^2 s^2\right) \left(2 c^2+b^2 s^2\right)}\right) \exp \left(-\displaystyle\frac{2 \left(a^2 \left(\mathrm{\pi} ^2 b^4 s^2+4 \mathrm{\pi} ^2 b^2 c^2+2 y^2\right)+\mathrm{\pi} ^2 b^4 c^2 s^2+b^2 s^2 \left(x^2+y^2\right)+2 c^2 x^2\right)}{\left(2 a^2+b^2 s^2\right) \left(b^2 s^2+2 c^2\right)}\right)}{\left(2 a^2+b^2 s^2\right) \left(b^2 s^2+2 c^2\right)},\\[5pt] m^a(s,x,y)&=&\displaystyle\frac{4 \mathrm{\pi} ^2 a b^2 c s \times I_1\left(\displaystyle\frac{2 b^4 \left(c^2-a^2\right) \mathrm{\pi} ^2 s^2}{\left(2 a^2+b^2 s^2\right) \left(2 c^2+b^2 s^2\right)}\right) \exp \left(-\displaystyle\frac{2 \left(a^2 \left(\mathrm{\pi} ^2 b^4 s^2+4 \mathrm{\pi} ^2 b^2 c^2+2 y^2\right)+\mathrm{\pi} ^2 b^4 c^2 s^2+b^2 s^2 \left(x^2+y^2\right)+2 c^2 x^2\right)}{\left(2 a^2+b^2 s^2\right) \left(b^2 s^2+2 c^2\right)}\right)}{\left(2 a^2+b^2 s^2\right) \left(b^2 s^2+2 c^2\right)}, \end{eqnarray}](/articles/aa/full_html/2019/01/aa31596-17/aa31596-17-eq125.png)
where I0 and I1 denote the Bessel-I functions of the zeroth and first order. Integration over the (x, y)-plane gives the isotropic and anisotropic spectra
![\begin{eqnarray}M^i(s)&=&\displaystyle\frac{2 \mathrm{\pi} ^3 a b^2 c s \times \exp \left(-\displaystyle\frac{2 \mathrm{\pi} ^2 b^2 \left(a^2 \left(b^2 s^2+4 c^2\right)+b^2 c^2 s^2\right)}{\left(2 a^2+b^2 s^2\right) \left(b^2 s^2+2 c^2\right)}\right) I_0\left(\displaystyle\frac{2 b^4 \left(c^2-a^2\right) \mathrm{\pi} ^2 s^2}{\left(2 a^2+b^2 s^2\right) \left(2 c^2+b^2 s^2\right)}\right)}{\sqrt{\left(2 a^2+b^2 s^2\right) \left(b^2 s^2+2 c^2\right)}},\\[5pt] M^a(s)&=&\displaystyle\frac{2 \mathrm{\pi} ^3 a b^2 c s \times \exp \left(-\displaystyle\frac{2 \mathrm{\pi} ^2 b^2 \left(a^2 \left(b^2 s^2+4 c^2\right)+b^2 c^2 s^2\right)}{\left(2 a^2+b^2 s^2\right) \left(b^2 s^2+2 c^2\right)}\right) I_1\left(\displaystyle\frac{2 b^4 \left(c^2-a^2\right) \mathrm{\pi} ^2 s^2}{\left(2 a^2+b^2 s^2\right) \left(2 c^2+b^2 s^2\right)}\right)}{\sqrt{\left(2 a^2+b^2 s^2\right) \left(b^2 s^2+2 c^2\right)}}. \end{eqnarray}](/articles/aa/full_html/2019/01/aa31596-17/aa31596-17-eq126.png)
In Fig. A.1, we show the spectra of isotropic and anisotropic coefficients for two ellipses with a = 1, c = 3 and a = 1, c = 9 computed for the three different values of the localization parameter discussed in the paper. The b parameter only affects the small scales. At large scales the curves for the three b values fall on top of each other. In contrast the extension of the larger main axis of the ellipses does not change the spectra at small scales, but extends the peaks towards longer scales.
The ratio of the anisotropic and isotropic spectra provides the degrees of anisotropy
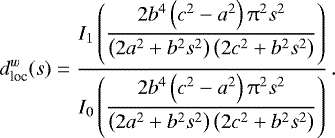 (A.7)
(A.7)
Since ma(s, x, y) is real and positive, local and global anisotropy agree  . Figure A.2 shows those ratios for the spectra from Fig. A.1. We see that the large-scale wing of the anisotropy spectra is only determined by the larger major axis of the ellipses – the wings are shifted exactly by the factor of three. In contrast, the small-scale wing and the resulting width of the plateau with high anisotropies is mainly determined by the localization parameter b. A
  filter creates a plateau that is much wider than the factor of three or nine between the two major axes of the ellipses.
The maximum of the local degree of anisotropy  at the peak scale s* depends only on the aspect ratio γ = c∕a and is given by
 (A.8)
(A.8)
The location of the peak of the degree of anisotropy falls at  . For the peaks of the spectra of wavelet coefficients we cannot give an analytic expression, but they are approximated by simple fitting functions in Sect. 3.1.3.
Appendix B Comparison to the Δ-variance
Our approach presented in Sect. 2 is similar to the Δ -variance. Both methods make use of wavelet functions for filtering of spatial structures. However, the wavelet used for the Δ -variance is purely real and has an isotropic, slightly different shape. Because of a normalization by s−2 in the equivalent of Eq. (1) for the Δ-variance definition, the Δ-variance spectra are steeper by s−1 than the wavelet spectra computed here. For a direct comparison we have to rescale the Δ -variance spectra by a multiplication with s and a corresponding normalization factor to get the scale-dependent energy density or divide the wavelet coefficients from Eq. (8) by s to get the scale-dependent variance.
Ossenkopf et al. (2008) calibrated the scale dependence of the Δ-variance by the systematic analysis of test structures with well defined size scales, comparing the width of individual emission peaks in the map with the scale of the Δ-variance peak. This provided a relation between filter size s and scale of the highest sensitivity of the Δ-variance. For Gaussian circular structures Arshakian & Ossenkopf (2016) showed that the Δ-variance spectra have a prominent peak at  of the Gaussians.
When using the amplitude rescaling Mi(s)∕s2 for the wavelet coefficients introduced in Sect. 2 the Δ-variance has to be rescaled by 1∕s to obtain the same dimensionality. The analysis of the peak of the rescaled Δ-variance for circular Gaussian structures, equivalent to Appendix A, provides a shift to  . As the peak of the corresponding wavelet spectra, Mi(s)∕s2, falls at 4.8σ we find that a simple shift of the Δ-variance lag scale by the factor 2.0 provides a match of the peak scales of the Δ -variance spectra and the isotropic wavelet spectra.
In Fig. B.1, we compare the rescaled Δ -variance spectra with the wavelet and Fourier spectra for the isotropic example from Fig. 11 and the anisotropic example from Fig. 2. Here and in all the spectra in Appendix E we have shifted the Δ -variance spectra by the constant factor of 2.0 to allow for a direct comparison to the wavelet spectra, using the s parameter as a uniform scale. Both for the isotropic test case but also for the extreme example of the most anisotropic structure, given by the 1D sinusoidal pattern (Fig. 2), we obtain a match of the peak positions in the spectra by this Δ -variance shift. This confirms that both methods provide an independent, uniform, and consistent assignment between wavelet scale and measured structure size. When comparing the spectra, one only has to use the appropriate scale definition. Here, we stick to the wavelet scale defined in Sect. 2 that has a peak at 4.8 times the standard deviation of isotropic Gaussian structures in spectra of amplitude per scale for all methods compared throughout the paper.
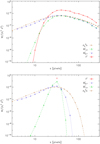 |
Fig. B.1 Comparison of the Δ-variance spectra with the isotropic wavelet and Fourier spectra for the test structures from Figs. 11 and 2, i.e., a map containing 10 Gaussian clumps with a standard deviation of
σ = 8 pixels (top panel) and a map containing a sinusoidal stripe pattern with a period of
p = 32 pixels (bottom panel). All spectra are plotted using the amplitude rescaling, M∕s2, that always guarantees a peak. The wavelet spectra were computed for localization parameters
|
For the scale-free cases of fractional Brownian motion structures (see e.g., Figs. E.1 and E.2) there is always a good match of the isotropic spectra. For all cases with pronounced size scales the Δ -variance spectrum shows a similar, but wider peak than the isotropic wavelet and Fourier spectra. As known from the sampling theorem and discussed in Sect. 3.6 the scale sensitivity decreases with increasing localization of the filtering. The Fourier spectra, without any localization filtering, show the sharpest peaks around prominent scales. Our anisotropic wavelet spectra show broader peaks with an increasing width for decreasing localization parameter b. The Δ -variance peaks finally are always the broadest among the compared methods. In terms of scale sensitivity our new anisotropic wavelet filter is thus superior to the original Δ-variance wavelet as shown already for another type of isotropic wavelet by Arévalo et al. (2012).
Appendix C Comparison with structure-function-based anisotropy
Esquivel & Lazarian (2011) also proposed a very generic approach to characterize the scale-dependent isotropy or anisotropy in maps. An extension to position–position–velocity cubes was proposed by Burkhart et al. (2014).
The method is based on the structure function
![\begin{equation*} S(\vec{r}) = \left\langle \left[ f(\vec{x}) - f (\vec{x} + \vec{r})\right]^2 \right\rangle_{\vec{x}}. \end{equation*}](/articles/aa/full_html/2019/01/aa31596-17/aa31596-17-eq135.png) (C.1)
(C.1)
Inspecting the contours of the structure function in the r-plane the anisotropies in the map are quantified by the deviation of these contours from a round shape. As all anisotropies characterized by Esquivel & Lazarian (2011) were aligned with the y-direction, it was sufficient to measure the values of the structure function in x and y-direction, that is, at x = |r| and y = |r|, and take their ratio as a function of the scale |r|. Dividing the smaller by the larger value provided the degree of isotropy,  , going from zero for extremely anisotropic structures to unity for isotropic structures.
Generalizing the approach, we can use the minimum and maximum value of the structure function at any point on the circle of constant |r| being independent from a known direction of anisotropy to define the structure-function-based degree of isotropy. As the structure function averages over the whole map, this measure can only characterize the global degree of isotropy in a map. For a direct comparison to our degree of anisotropy, not isotropy, we plot  as a measure of anisotropy.
Figure C.1 compares the output of the structure function with the wavelet-based global degree of anisotropy from the two filter shapes with  and
and  for the simple examples of a random arrangement of circular clumps and a superposition of aligned elliptic clumps (see Sects. 3.2, 3.3, and Appendix E). All methods agree on the isotropy of the spherical clumps on small scales and the small random anisotropy on large scales. For the aligned clumps, the structure function shows a moderate anisotropy at small scales similar to the value obtained from the less elongated filter with
  . However, the anisotropy shows no increase at very small scales and drops already at shorter scales than in the wavelet spectrum.
To test whether this scale shift results from the destruction of the global anisotropy by the superposition of many clumps, we repeat the test with the varying number of ellipses from Figs. 13 and 21 and include a calculation of the structure function. Figure C.2 compares the output of the structure function with the wavelet-based global degree of anisotropy. The single clump results in a high global anisotropy seen through all measures and the relative shift in the scales is the same as in Fig. C.1 excluding superposition effects. Consequently, the two methods only differ in a scale calibration. However, even when further increasing the size of the ellipses, the anisotropy seen through the structure function remains at the same high level at small scales preventing any detection of the minimum filament size through that method.
 |
Fig. C.1 Comparison of the global degree of anisotropy measured through the wavelet analysis with the degree of isotropy measured through the structure function for two maps containing spherical clumps (σ = 8 pixels, Fig. 11) and elliptical clumps (σ = 6 × 18 pixels) all aligned at 45 degrees (Fig. D.3). |
 |
Fig. C.2 Comparison of the global degree of anisotropy measured through the wavelet analysis with the degree of isotropy measured through the structure function for two maps containing either a single or ten randomly distributed and oriented elliptic clumps with an axes ratio of 4:1 (σ = 8 × 32 pixels, see Fig. 13). |
For the superposition of multiple clumps we find similar values for the remaining global anisotropy at small scales. The structure function provides the highest values being least sensitive to superposition effects as it naturally ignores low map values in contrast to the wavelet analysis that always considers variations. It is an appropriate method to measure the global anisotropy when we recalibrate the scales by a factor of two relative to each other, which means we can shift the structure function-based degree of anisotropy to two times higher scales to apply the scaling relations from Sect. 3.1.3. When looking for global anisotropies, the wavelet analysis has the advantage of being sensitive to the minimum size of the structures while the structure function is less affected by superposition effects. However, the structure function can only characterize the global anisotropy. For an unbiased analysis of the local filamentariness in a map, the wavelet analysis is the only approach.
Appendix D Understanding the degree of anisotropy for clump ensembles
To illustratehow the degree of anisotropy changes for an ensemble of clumps relative to the degree measured for individual clumps in Sect. 3.1.3, we give some examples for superpositions of anisotropic clumps here, similar to the case of isotropic clumps in Fig. 11, but now including the additional degree of freedom of their relative orientation. Figure D.1 shows the wavelet analysis for an ensemble of ten anisotropic Gaussian clumps. The clumps have the same aspect ratio of 1:3 and a uniform distribution of orientations. The spectra of wavelet and Fourier coefficients are similar to those of the individual clumps (Fig. 3) therefore we do not show them here. The main difference is seen in the local and global degree of anisotropy.
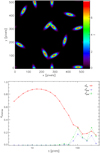 |
Fig. D.1 Anisotropic wavelet analysis of a map containing elliptic Gaussian clumps with standard deviations of 6 and 18 pixels in orthogonal directions providing an aspect ratio of 3:1 and having random orientations. Upper panel: original map. Lower panel: degrees of anisotropy. |
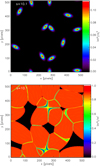 |
Fig. D.2 Map of anisotropic wavelet coefficients (top panel) and map of the ratio of anisotropic to isotropic wavelet coefficients (bottom panel) for the structure of elliptic Gaussian clumps from Fig. D.1 computed for a wavelet size s of 10.1 pixels. |
 |
Fig. D.3 Degrees of anisotropy for a map containing the elliptic Gaussian clumps from Fig. D.1, but all aligned in the same orientation of 45 degrees. |
The shape of the spectrum of local anisotropies can be understood when looking at a map of anisotropies defined as |ma (s, x)|∕mi(s, x). This quantity is not useful to characterize the general anisotropy in a map because it is dominated by contributions from very small mi (s, x) far away from any real structure in the map, but it can be used to visualize the spatial location of the different contributions. Figure D.2 shows the map of anisotropic wavelet coefficients used to compute the degrees of anisotropy and the map of the ratio of anisotropic to isotropic wavelet coefficients for the structure from Fig. D.1 when applying a filter size s = 10 pixels. The anisotropic wavelet coefficients peak at the locations of the individual clumps but they have a less elongated structure being dominated by the gradients at the sharper boundaries of the individual clumps. Around the clumps we find identical values for the isotropic and anisotropic wavelet coefficients providing a ratio of unity. Lower values occur at the boundaries where two clumps approach each other so that the overall structure becomes less anisotropic. This is in particular prominent for the two groups of clumps at about (x, y) = (250, 350) and (250, 50), where the approximately orthogonal direction of the two clumps leads to a reduced local degree of anisotropy. When goingto larger filter sizes, the effect of the relative arrangement of the different clumps becomes more and more prominent relative to the anisotropy of the individual clumps so that the overall degree of anisotropy  decreases as seen in Fig. D.1. At smaller filter sizes the anisotropic filter does not fully match the structure of the ellipses so that the local degree of anisotropy |ma (s, x)|∕mi(s, x) falls somewhat below unity explaining the decrease of
  towards very small filter sizes.
For Fig. D.3, we changed the configuration from Fig. D.1 by introducing a global anisotropy. All clumps are aligned in the same direction with their major axis. The resulting spectra of wavelet coefficients and isotropic Fourier coefficients are almost the same as those from the unaligned ellipses in Fig. D.1 and also the local degree of anisotropy is the same as in Fig. D.1 but the wavelet-based degree of global anisotropy now matches the local anisotropy spectrum. The degree of global anisotropy measured through the Fourier spectrum follows the one measured through the wavelet coefficients at large and intermediate scales but remains high at scales below the clumps size. Combining local and global degree of anisotropy allows us to characterize both the anisotropy of individual structures and their mutual alignment.
Appendix E Analysis of test structures
Here, we present the standard analysis plots for a subset of test structures that we processed to measure the sensitivity of the different tools to different aspects of the maps. We only show data sets that are not described by the analytical formulae in Appendix A or where superposition effects are small enough that they still closely follow those formulae. The figures presented here always show the analyzed map in the first panel, the angular distribution of the anisotropic wavelet coefficients A(s, φ) in the second panel, the spectrum of isotropic wavelet, Δ-variance and Fourier coefficients in the third panel, and the corresponding spectra of the degrees of anisotropy in the fourth panel.
In contrast to the plots up to Sect. 3.5 that used the b = 1 filter we show the results for two different filters. The plots always contain the results for the analysis with a broad Gaussian kernel,  , indicated by the superscript “1.4”, and a narrow kernel,
  , indicated by the superscript “0.7”. In the second panel, the angular spectrum for the
  filter is plotted in colors and for the
  filter in contours.
Figure E.1 shows the results for a Gaussian distribution of white noise and Fig. E.2 the more general case of a fractional Brownian motion structure (see Sect. 3.1.2) with a power spectral index of 3.0 corresponding to a box-car fractal dimension of 2.5 or a Hurst index of H = 0.5, superimposed by Gaussian white noise with a signal to noise ratio S/N = 5. For the white noise, the renormalized Fourier, Δ-variance, and wavelet spectra show a s−3 dependence following a s−1 dependence of the original spectra given by the normalization of the Fourier and wavelet coefficients. White noise has a 2D Fourier spectrum  that is independent of the wavenumbers. The radial integration in the k-plane provides the energy density spectrum F(k) ∝ k so that the resulting energy densities per filter size drop like s−1. The spectra of anisotropic coefficients also fall like s−1 providing an almost constant degree of anisotropy. At scales above 30–50 pixels multiple random anisotropies are visible in the angular spectra with no preferred directions. When summing over different orientations of the anisotropies, as done in the sum of the total values of the anisotropic wavelet coefficients in the local degree of anisotropy, all accidental local anisotropies are caught and we obtain a relatively constant ratio between anisotropic and isotropic coefficients of about 0.30 for
  and 0.37 for
  , respectively, providing a constant degree of local anisotropy (Eq. (9)) with these values for all scales. When only considering global anisotropies, as measured by the Fourier coefficients or the sum of anisotropic wavelet coefficients including their phase (Eqs. (10) and (16)), we obtain vanishing global degrees of anisotropy. The same result is obtained for noise structures with a different noise spectral index. As long as they have random phases, the local degree of anisotropy remains at avalue around 0.3 while the global degree of anisotropy vanishes for all scales. The only difference in these structures is the different spectral slope of the renormalized wavelet and Fourier coefficients given by the spectral index of the noise as β − 3.
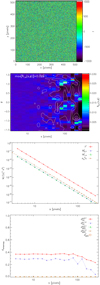 |
Fig. E.1 Anisotropic wavelet analysis of a white noise map. |
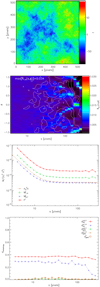 |
Fig. E.2 Anisotropic wavelet analysis of a map containing a fractional Brownian motion structure with a spectral index β = −3 superimposed by Gaussian noise (S∕N = 5). |
Figure E.3 shows the results for the projection of a singular isothermal sphere given by a 3D radial profile n ∝r−2. To avoid the numerical problems of the singularity in the center, the infinite value in the central pixel has been replaced by a value of 4.0 times the density of the closest surrounding pixels. The angular distribution shows some artifacts at a low level. The somewhat stripy structure seen in A(s, φ) at small scales stems from the gridding in the map that enhances all periodicities in a 2D square lattice. The enhancements in à (s, φ) at angles of 0 and π∕2 stem from the truncation of the sphere by the square map. Those distortions are only visible in the angular spectra. In the radially integrated spectra of wavelet coefficients and the degree of anisotropy they are not visible. The renormalized spectra follow a strict s−1 dependence like Δ-variance and the power spectrum. The degree of anisotropy is vanishing.
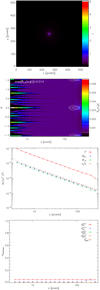 |
Fig. E.3 Anisotropic wavelet analysis of a map containing the projection of a sphere with a r−2 density profile. |
Figure E.4 contains the results for the map containing a sinusoidal stripe pattern with a period of p = 32 pixels discussed in Sect. 3.1.1. The Fourier spectrum measures the exact period. As discussed in Sect. 3.6, the filter with the wide localization parameter  also traces this pronounced scale very sharply while the filter with the narrower
  shows a broader peak, almost as wide as the Δ-variance. Nevertheless all four approaches show a peak at the scale reflecting the periodicity of the sinusoidal pattern. As the sinusoidal structure is the only structure in the map local and global degrees of anisotropy agree. Because the power spectrum vanishes at all scales different from s = 32 pixels it can only measure the degree of anisotropy there, providing a value of unity. The
  provides a value close to unity at this scale but falls off to 0.8 at small scales. The smaller localization parameter gives lower values of 0.9 at the peak at 0.6 at small scales. The angle of the pattern is accurately measured by both filters.
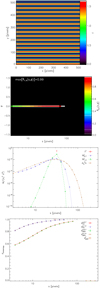 |
Fig. E.4 Anisotropic wavelet analysis of a map containing a sinusoidal stripe pattern with ky = 16, i.e. a period of p = 32 pixels. |
Figures E.5 and E.6 show the analysis for two elliptical Plummer profiles, as discussed in Sect. 3.1.4. With a ratio σc∕Ra = 8 the Plummer ellipse in Fig. E.5 falls into the asymptotic regime of long filaments in Fig. 8 where the peak of the wavelet spectra is independent of the filament length. The Plummer profile in Fig. E.6 has a smaller axis ratio σc∕Ra = 4 falling into the regime where the scale calibration from Sect. 3.1.4 has the largest error. Qualitatively, all types of spectra show the same behavior. The renormalized wavelet spectra of the long Plummer profiles show a steep increase at scales below 20 pixels, a power law trend at intermediate scales and a drop beyond 200 pixels. The peak parameters match the fitting formula from Sect. 3.1.4. The b-dependence is small. For the short Plummer profile the power-law behavior is steeper than in Figs. E.5 and 9, it starts already at smaller scales, in spite of the same profile width, and it extends only to about 70 pixels, more than a factor of two below the upper end in Fig. E.5. Obviously, here the wavelet spectrum is no longer dominated by the filament width only. In the degrees of anisotropy, we find a shift of the upper edge of the plateau by exactly the factor of two that is the difference in the lengths of the two profiles, confirming the length-dependence of the spectrum of the degree of anisotropy. The reason for the difference in the wavelet spectra can be seen from the maps showing the structures and the angular spectra. At small scales the center of the Plummer profile is the dominating structure. The angular spectra peak at the angle of the main filament axis σc. At larger scalesthe shallow decay of the Plummer profile creates a structure that is oriented rather perpendicular, in the direction of Ra. For short filaments this provides already a significant contribution at intermediate scales. However, the visual impression of the structure in Fig. E.6 also proves that the restriction of the fitting formula (Eq. (19)) from Sect. 3.1.4 to longer axes ratios is no problem for the characterization of real filaments as one would hardly describe structures with σc ∕Ra < 8 as significantly elongated structures.
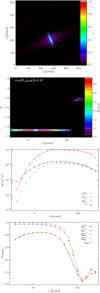 |
Fig. E.5 Anisotropic wavelet analysis of a map containing an asymmetric p = 2 Plummer profile with Ra = 3.2 pixels and σc = 26 pixels. |
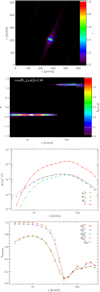 |
Fig. E.6 Anisotropic wavelet analysis of a map containing an asymmetric p = 2 Plummer profile with Ra = 3.2 pixels and σc = 13 pixels. |
As examples with strong superposition effects Figs. E.7–E.9 show ensembles of 100 Gaussian clumps each. In Fig. E.7 we used isotropic clumps with σa = σc = 8 pixels, in Fig. E.8 randomly oriented elliptical clumps with standard deviations of σ =4 × 16 pixels, and in Fig. E.9 the same type of elliptical clumps all oriented at an angle of 60 degrees. The maps show that the superposition of the individual clumps creates in the order of ten larger scale structures per map. In Fourier, wavelet, and Δ -variance spectra we find no significant difference to the appearance of individual clumps as discussed in Sect. 3.1.3. There the superposition effects seem to be negligible. The angular spectra show few prominent structures but the degrees of anisotropy are noticeably changed. In all cases the superposition of clumps creates a local degree of anisotropy of about 0.4at intermediate and large scales, beyond the characteristic scales of the individual clumps. For the randomly oriented clumps, the superposition noticeably lowers the local degree of anisotropy at the small scales that are characteristic for the clumps. For the ensemble of aligned clumps this effect does not happen. Here, only intermediate and large scales are affected. The angular distribution is only slightly widened there when using the  filter. In case of a strong global anisotropy, superposition effects are thus almost negligible in the anisotropic wavelet analysis.
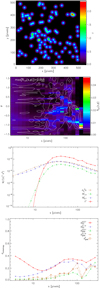 |
Fig. E.7 Anisotropic wavelet analysis of a map containing a superposition of 100 randomly placed spherical clumps with σ = 8 pixels. |
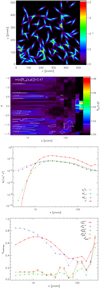 |
Fig. E.8 Analysis of a map containing a superposition of 100 randomly placed and oriented Gaussian elliptical clumps with σa = 4 pixels and σc = 16 pixels. |
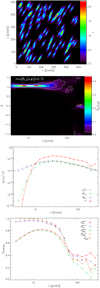 |
Fig. E.9 Analysis of a map containing a superposition of 100 randomly placed Gaussian elliptical clumps with σ = 4 × 16 pixels all oriented at an angle of 60 degrees. |
Figure E.10 finally uses a superposition of one big ellipsoidal clump with standard deviations of 20 and 100 pixels, oriented at −45 degrees, with a set of ten smaller isotropic clumps. The small clumps have a radius of σ =8 pixels and random positions. The configuration is thus similar to Fig. 18. The  wavelet andthe Fourier spectra also show a small dip separating the contributions from large and small clumps. This dip is smeared out when using the smaller localization parameter,
  , or the Δ -variance. Although the small clumps do not contribute individually to the degree of anisotropy they still distort the anisotropy spectrum of the large clump suppressing it at scales of between 30 and 60 pixels. In agreement with Sect. 3.6, the effect is minimized when using a small localization parameter. For a large parameter
  the superposition even tends to warp the angular spectrum of the large clump.
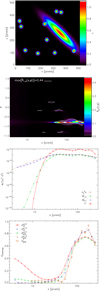 |
Fig. E.10 Analysis for a superposition of a big elliptic clump with σ = 20 × 100 pixels with 10 small spherical clumps with σ = 8 pixels. |
References
- Anathpindika, S., & Freundlich, J. 2015, PASA 37, e007 [NASA ADS] [CrossRef] [Google Scholar]
- André, P. 2017, Compt. Rend. Geosci., 349, 187 [Google Scholar]
- André, P., Men’shchikov, A., Bontemps, S., et al. 2010, A&A, 518, L102 [NASA ADS] [CrossRef] [EDP Sciences] [Google Scholar]
- André, P., Di Francesco, J., Ward-Thompson D., et al. 2014, Protostars and Planets VI, eds. H. Beuther, R. Klessen, C. Dullemond, & Th. Henning (Tucson, AZ: University of Arizona Press), 27 [Google Scholar]
- Arévalo, P., Churazov, E., Zhuravleva, I., Hernández-Monteagudo, C., & Revnivtsev, M. 2012, MNRAS, 426, 1793 [NASA ADS] [CrossRef] [Google Scholar]
- Arshakian, T. G., & Ossenkopf, V. 2016, A&A, 585, A98 [NASA ADS] [CrossRef] [EDP Sciences] [Google Scholar]
- Arzoumanian, D., André, P., Didelon, P., et al. 2011, A&A, 529, L6 [Google Scholar]
- Bensch, F., Stutzki, J., & Ossenkopf, V. 2001 A&A, 366, 636 [NASA ADS] [CrossRef] [EDP Sciences] [Google Scholar]
- Bohlin, R.C., Savage, B.D., & Drake, J.F. 1978, ApJ 224, 132 [NASA ADS] [CrossRef] [Google Scholar]
- Bolatto, A. D., Wolfire, M., & Leroy, A. K. 2013, ARA&A, 51, 207 [Google Scholar]
- Bonnor, W. B. 1956, MNRAS 116, 351 [CrossRef] [Google Scholar]
- Burkhart, B., & Lazarian, A., 2012, ApJ 755, L19 [NASA ADS] [CrossRef] [Google Scholar]
- Burkhart, B., Ossenkopf, V., Lazarian, A., & Stutzki, J. 2013a, ApJ, 771, 122 [NASA ADS] [CrossRef] [Google Scholar]
- Burkhart, B., Lazarian, A., Ossenkopf, V., & Stutzki, J. 2013b, ApJ 771, 123 [NASA ADS] [CrossRef] [Google Scholar]
- Burkhart, B., Lazarian, A., Leäo, I.C., de Medeiros, J. R., & Esquivel, A. 2014, ApJ, 790, 130 [NASA ADS] [CrossRef] [Google Scholar]
- Correia, C., Burkhart, B., Lazarian, A., et al. 2014, ApJ, 785, L1 [NASA ADS] [CrossRef] [Google Scholar]
- Ebert, R. 1955, Z. Astrophys. 37, 217 [NASA ADS] [Google Scholar]
- Esquivel, A., & Lazarian, A. 2011, ApJ, 740, 117 [NASA ADS] [CrossRef] [Google Scholar]
- Federrath, C. 2016, MNRAS, 457, 375 [NASA ADS] [CrossRef] [Google Scholar]
- Federrath, C., Roman-Duval, J., Klessen, R. S., Schmidt, W., & Mac Low, M.-M. 2010, A&A 512, A81 [NASA ADS] [CrossRef] [EDP Sciences] [Google Scholar]
- Fischera, J., & Dopita, M.A. 2008, ApJ 176, 164 [NASA ADS] [CrossRef] [Google Scholar]
- Fischera, J., & Martin, P.G. 2012, A&A, 542, A77 [NASA ADS] [CrossRef] [EDP Sciences] [Google Scholar]
- Frick, P., Beck, R., Berkhuijsen, E. M., & Patrickeyev, I. 2001, MNRAS, 327, 1145 [NASA ADS] [CrossRef] [Google Scholar]
- Frick, P., Stepanov, R., Beck. R., et al. 2016, A&A, 585, A21 [NASA ADS] [CrossRef] [EDP Sciences] [Google Scholar]
- Gabor, D. 1946, J.I.E.E., 93, part III, 429 [Google Scholar]
- Gill, A.G., & Henriksen, R.N. 1990, ApJ, 365, L27 [NASA ADS] [CrossRef] [Google Scholar]
- Glover, S. C. O., Federrath, C., Mac Low, M.-M., et al. 2010, MNRAS, 404, 2 [NASA ADS] [Google Scholar]
- Grossman, A., & Morlet, J. 1984, SIAM J. Math. Anal. 15, 723 [CrossRef] [MathSciNet] [Google Scholar]
- Hennebelle P. 2013, A&A 556, A153 [NASA ADS] [CrossRef] [EDP Sciences] [Google Scholar]
- Jeans, J. H. 1902, Phil. Trans. R. Soc. A 199, 1 [Google Scholar]
- Juvela, M., Malinen, J., & Lunttila, T. 2012, A&A 544, A141 [NASA ADS] [CrossRef] [EDP Sciences] [Google Scholar]
- Koch, E.W., & Rosolowsky E.W. 2015, MNRAS, 452, 3435 [NASA ADS] [CrossRef] [Google Scholar]
- Könyves, V., André, Ph., Menśhchikov, A., et al. 2015, A&A 584, A91 [NASA ADS] [CrossRef] [EDP Sciences] [Google Scholar]
- Langer, W. D., & Graedel, T. E. 1989, ApJS, 69, 241 [NASA ADS] [CrossRef] [Google Scholar]
- Lazarian, A., & Pogosyan, D. 2000, ApJ, 537, 720 [NASA ADS] [CrossRef] [Google Scholar]
- Lazarian, A., & Pogosyan, D. 2004, ApJ, 616, 943 [NASA ADS] [CrossRef] [Google Scholar]
- Mac Low, M.-M., & Klessen, R.S. 2005, Rev. Mod. Phys. 76, 125 [Google Scholar]
- Malinen, J., Juvela, M., Rawlings, M. G., et al. 2012, A&A, 544, A50 [NASA ADS] [CrossRef] [EDP Sciences] [Google Scholar]
- Men’shchikov, A., André, P., Didelon, P., et al. 2010, A&A, 518, L103 [NASA ADS] [CrossRef] [EDP Sciences] [Google Scholar]
- Miville-Deschênes, M.-A., Martin, P.G., Abergel, A., et al. 2010, A&A, 518, L104 [NASA ADS] [CrossRef] [EDP Sciences] [Google Scholar]
- Nesme-Ribes, E., Frick, P., Sokoloff, D., et al. 1995, Acad. Sci. Paris Compt. R. Ser. B Sci. Physiques, 321, 525 [NASA ADS] [Google Scholar]
- Ossenkopf, V. 2002, A&A, 391, 295 [NASA ADS] [CrossRef] [EDP Sciences] [Google Scholar]
- Ossenkopf, V., Krips, M., & Stutzki, J. 2008, A&A, 485, 917 [NASA ADS] [CrossRef] [EDP Sciences] [Google Scholar]
- Ostriker, J. 1964, ApJ, 140, 1056 [NASA ADS] [CrossRef] [MathSciNet] [Google Scholar]
- Panopoulou, G. V., Psaradaki, I., Skalidis R., et al. 2017, MNRAS 466, 2529 [NASA ADS] [CrossRef] [Google Scholar]
- Patrikeev, I., Fletcher, A., Stepanov, R., et al. 2006, A&A 458, 441 [NASA ADS] [CrossRef] [EDP Sciences] [Google Scholar]
- Peitgen, H. O., & Saupe, D. 1988, The Science of Fractal Images (New York: Springer) [Google Scholar]
- Pilbratt, G.L., Riedinger, J.R., Passvogel, T., et al. 2010, A&A, 518, L1 [CrossRef] [EDP Sciences] [Google Scholar]
- Plummer, H.C. 1911, MNRAS 71, 460 [CrossRef] [Google Scholar]
- Robitaille, J.-F., Joncas, G., & Miville-Deschênes, M.-A. 2014, MNRAS, 440, 272 [Google Scholar]
- Schneider, N., Csengeri, T., Bontemps, S., et al. 2010, A&A, 520, A49 [NASA ADS] [CrossRef] [EDP Sciences] [Google Scholar]
- Schneider, N., André, Ph., Könives, V., et al. 2013, ApJ, 766, L17 [NASA ADS] [CrossRef] [Google Scholar]
- Shu, F. H. 1977, ApJ 214, 488 [NASA ADS] [CrossRef] [Google Scholar]
- Sousbie T. 2011, MNRAS, 414, 350 [NASA ADS] [CrossRef] [Google Scholar]
- Stodółkiewicz, J.S. 1963, Acta Astron., 12, 30 [NASA ADS] [Google Scholar]
- Stutzki, J., & Güsten, R. 1990, ApJ, 356, 513 [NASA ADS] [CrossRef] [Google Scholar]
- Stutzki, J., Bensch, F., Heithausen, A., Ossenkopf, V., & Zielinsky, M. 1998, A&A, 336, 697 [NASA ADS] [Google Scholar]
- Vázquez-Semadeni, E., & García, N. 2001, ApJ, 557, 727 [NASA ADS] [CrossRef] [Google Scholar]
- Walker, J.S. 2008, A Primer on Wavelets and Their Scientific Applications, 2nd edn. (Boca Raton: Chapman and Hall/) [CrossRef] [Google Scholar]
All Figures
 |
Fig. 1 Cut through the basic two-dimensional Morlet wavelet used for the anisotropic analysis (Eq. (3) for b = 1). The yellow surface represents the real part, the blue surface the imaginary part of the wavelet function. For better visibility of both parts, the range y < 0 is omitted in the display. For the full analysis, the wavelet is stretched by a factor s and rotated by an angle φ. |
| In the text | |
 |
Fig. 2 Spectra of isotropic and anisotropic wavelet and Fourier coefficients for a map containing a sinusoidal stripe pattern with ky =16, i.e., a period of p = 32 pixels in a 5122 pixels image.The two Fourier spectra consist only of a single point at s = 32 pixels and are otherwise zero. In all figures, we plot the absolute value for the anisotropic Fourier spectrum.All other coefficients are real. The wavelet analysis used a localization parameter b = 1. |
| In the text | |
 |
Fig. 3 Anisotropic wavelet analysis for a map containing an anisotropic Gaussian clump with standard deviations of σa = 8 pixels, σc = 32 pixels. Top panel: isotropic and anisotropic wavelet and Fourier spectra. Bottom panel: resulting local and global degrees of anisotropy. |
| In the text | |
 |
Fig. 4 Peak value of the degree of local and global anisotropy from the wavelet analysis of Gaussians as a function of their aspect ratio. |
| In the text | |
 |
Fig. 5 Dependence of the peak region of the degree of anisotropy (upper plot), the spectra of isotropic wavelet coefficients, Mi (central plot), and the quadratic-scale-normalized spectra of isotropic wavelet coefficients, Mi ∕s2 (lower plot), on the aspect ratio of the Gaussian ellipses. We changed the major axis σc of the ellipses while keeping the minor axis σa = 1 pixel constant. For every filter, three curves are plotted giving the location of the peak and the two plateau edges at 90% of the peak. |
| In the text | |
 |
Fig. 6 Comparison of a Gaussian profile with a Plummer profile for p = 2 when using the Gaussian standard deviation for the plateau radius Rc or using a 1.7 times smaller plateau radius leading to the same 40% width. |
| In the text | |
 |
Fig. 7 Anisotropic wavelet analysis for a map containing an anisotropic Plummer profile with a core radius Ra = 8 pixels and σc = 32 pixels. The panels and parameters are the same as in Fig. 3. |
| In the text | |
 |
Fig. 8 Parameters of the peak plateau regions for the degree of anisotropy (upper plot), and the rescaled spectra of isotropic wavelet coefficients, Mi∕s2 (lower plot), as a function of the aspect ratio of the Plummer ellipses. We labeled the y-axes by the variables for the peak of the two quantities. For every filter, the central dots give the location of the peak and the two outer lines show the plateau edges, at 90% of the peak. For the wavelet coefficients, the dots at the right edge of the plotted range represent the values for an infinite aspect ratio, i.e., a one-dimensional (1D) Plummer profile. In the degree of anisotropy, we were not able to measure the lower edge of the plateau except for the |
| In the text | |
 |
Fig. 9 Comparison of the rescaled spectra of the isotropic wavelet coefficients (top panel) and the local degree of anisotropy (bottom panel) for elliptical Gaussian clumps with σa = 4 pixels, σc = 32 pixels and Plummer profile clumps with Ra = 4 pixels and σc = 32 pixels. To test the fit relations for the peaks in the wavelet spectra and the degree of anisotropy, we also show the results for Plummer profile clumps that are smaller by a factor 1/1.7 and larger by the factor 1/0.8. |
| In the text | |
 |
Fig. 10 Relative error of smax simulated for noise with different values of the signal-to-noise ratio, S∕σN, and the relative noise correlation length, lN∕smax, superimposed on Gaussian structures. The dashed line represents the approximation for small noise correlation lengths, |
| In the text | |
 |
Fig. 11 Anisotropic wavelet analysis for a map containing 10 Gaussian clumps with a standard deviation of σ = 8 pixels, i.e., a FWHM of 19 pixels. Upper panel: original map. Central panel: scale-normalized isotropic and anisotropic wavelet spectra |
| In the text | |
 |
Fig. 12 Maps of anisotropic wavelet coefficients |ma(s, x)| for the field of 10 Gaussian clumps from Fig. 11. The three panels show the coefficients for the filter sizes of s = 10, 40, and 160 pixels. To be independent of the amplitude of the original signal we normalized the coefficients by the map variance |
| In the text | |
 |
Fig. 13 Comparison of the wavelet spectra and local degrees of anisotropy measured in the anisotropic wavelet analysis for maps containing randomly placed and oriented ellipses with different sizes, all with an axes ratio of 4:1 (σ = 4 ×16 pixels, σ = 8 × 32 pixels, σ = 16 × 64 pixels). By changing the number of the clumps, we introduce different degrees of anisotropy on the scale of the typical distance of the clumps. The wavelet spectra are normalized for amplitude per scale weighting by dividing them by |
| In the text | |
 |
Fig. 14 Local and global degrees of anisotropy for the map containing a superposition of two ensembles of elliptic clumps, shown in the top panel. All clumps with standard deviations of 6 and 18 pixels are oriented at 45 degrees; ellipsoidal clumps with standard deviations of 3 and 27 pixels, i.e., an aspect ratio of 9:1, are distributed at uniformly spaced angles covering 360 degrees. |
| In the text | |
 |
Fig. 15 Local and global degrees of anisotropy for a map containing a superposition of two ensembles of elliptic clumps. Ten clumps with standard deviations of 3 and 27 pixels, i.e., an aspect ratio of 9:1, are aligned at 0 degrees; ten clumps with standard deviations of 6 and 18 pixels are distributed at uniformly spaced angles covering 360 degrees. |
| In the text | |
 |
Fig. 16 Angular distribution of the anisotropic wavelet coefficients for the maps containing the two ensembles of clumps from Figs. 14 (top panel, σ = 6 × 18 pixel clumps at 45 degrees, σ = 3 × 27 pixel clumps uniformly distributed) and 15 (bottom panel, σ = 6 × 18 pixel clumps uniformly distributed, σ = 3 × 27 pixel clumps at 0 degrees). The contours show the 2D spectrum of wavelet coefficients A(s, φ) at levels of 1/30, 1/10, and 1/3 of the peak value indicated in the top-left corner of the plot. The colors represent the coefficients normalized by the spectrum of isotropic modes, Ã (s, φ) (Eq. (13)), on a linear scale. |
| In the text | |
 |
Fig. 17 Comparison of the normalized spectra of the isotropic wavelet coefficients (top panel) and the local degree of anisotropy (bottom panel) for maps containing random projections of ten 3D Gaussian rotational ellipsoids with sizes of σ = 3 × 3 × 27 pixels and σ = 3 × 27 × 27 pixels. The green line shows the result for a map consisting of ten 2D Gaussian ellipses with σ = 3 × 27 pixels. |
| In the text | |
 |
Fig. 18 Anisotropic wavelet analysis of a map with a superposition of a big elliptic clump with σ = 20 × 100 pixels with 10 smaller ellipsoidal clumps with σ = 4 × 16 pixels. |
| In the text | |
 |
Fig. 19 Comparison of the normalized spectra of the isotropic wavelet coefficients (top panel) and the local degree of anisotropy (bottom panel) for maps with a hierarchy of structures of different sizes. The green line represents the projected density structure in a simulation of fully developed hydrodynamic turbulence with a close-to-power-law power spectrum and no preferred direction (Federrath et al. 2010). The blue and red curves show the results for maps composed of a hierarchy of Gaussian clumps with sizes of σ = 4 × 16, 8 × 32, 16 × 64, and 32 ×128 pixels. One map contains two clumps of each size, the other one a fixed area for clumps of different sizes, i.e., 64 clumps of the smallest sizeand one clump of the largest size. |
| In the text | |
 |
Fig. 20 Comparison of the degrees of anisotropy measured by different filter shapes in the anisotropic wavelet analysis for the ensembles from Figs. 14 and 15 containing clumps with σ = 6 × 18 pixels and σ = 3 × 27 pixels where eitherof the two types is aligned. |
| In the text | |
 |
Fig. 21 Comparison of the wavelet spectra and local degrees of anisotropy measured by different filter shapes for maps containing randomly placed and oriented ellipses with a size of σ = 8 × 32 pixels (see Fig. 13). The wavelet spectra are normalized relative to a slope of unity and the variance in the map. |
| In the text | |
 |
Fig. 22 Comparison of the local degrees of anisotropy measured by the filter with |
| In the text | |
 |
Fig. 23 Total column density and central slice through the density and the line-of-sight velocity structure of the supersonic, sub-Alfvénic MHD turbulence simulation analyzed (Burkhart et al. 2013a). |
| In the text | |
 |
Fig. 24 Maps of line-integrated intensities of the J = 2 − 1 transition of CO isotopologs computed for the MHD simulation from Fig. 23. The molecule abundances in the three panels are X = 5 × 10⁻⁸, 1.5 × 10⁻⁶, and 4.5 × 10⁻⁵. |
| In the text | |
 |
Fig. 25 Channel maps for the v = 0 velocity channel of the line from the radiative-transfer simulations shown in Fig. 24. |
| In the text | |
 |
Fig. 26 Spectra of normalized isotropic wavelet coefficients |
| In the text | |
 |
Fig. 27 Spectra of the local degree of anisotropy (top panel) and the global degree of anisotropy (bottom panel) for the six maps from Figs. 24 and 25. The filamentary density structure seen at low optical depths provides a high degree of local anisotropy at small scales. But those filaments appear unaligned. For large optical depths (brown and purple curves) the velocity filaments dominate and the global anisotropy in the x direction becomes significant. Following Sect. 3.6, the |
| In the text | |
 |
Fig. 28 Column-density maps of the Polaris and Aquila regions derived from Herschel dust emission data previously analyzed by André et al. (2010), Schneider et al. (2013), and Könyves et al. (2015). As the map of Polaris includes the celestial pole, coordinates are given relative to 3h 28m 16.0s, 88°34′ 32.0″ (J2000). One degree in the map corresponds to 2.6 pc in Polaris and 4.5 pc in Aquila. We specify the column density in terms of the visual extinction using the standard factor NH ∕AV= 1.87 × 1021 cm−2 (Bohlin et al. 1978). |
| In the text | |
 |
Fig. 29 Maps of the amplitude of the anisotropic wavelet coefficients |ma(s, x)| in logarithmic scaling for the Polaris column-density map. Upper panel: coefficients for the filter sizes of s = 0.12 pc = 0.044°, lower panel: a filter size of 0.56 pc = 0.21°. In both maps the colors show the results for the |
| In the text | |
 |
Fig. 30 Spectra of isotropic wavelet coefficients (top panel), angular spectrum of anisotropic wavelet coefficients (central panel), and local and global degrees of anisotropy (bottom panel) for the Polaris column-density map computed for filter parameters of |
| In the text | |
 |
Fig. 31 Two-dimensional spectrum of anisotropic wavelet coefficients (contours) and degrees of anisotropy (color) for Aquila. The contours are drawn at levels of 1/30, 1/10, and 1/3 of the peak value indicated in the top-left corner of the plot. The angles are plotted in radians. |
| In the text | |
 |
Fig. 32 Spectra of rescaled isotropic wavelet spectra Mi(s)∕s2 (top panel, |
| In the text | |
 |
Fig. 33 Map of the local degree of anisotropy |ma(s, x)|∕mi(s, x) for the Polaris column-density map when using the |
| In the text | |
 |
Fig. 34 Gravitational stability spectra for the dominating structures in the two maps from Fig. 28. The isotropic and anisotropic wavelet coefficients mi and ma characterize the size dependence of the local column-density variation. Taking the size-scaled coefficients relative to the critical values of |
| In the text | |
 |
Fig. 35 Maps of the critical size for gravitational instability in the Aquila column-density map (Fig. 28). Upper panel: critical scale for isotropic modes, lower panel: anisotropic modes. White areas are regions with densities that are too low for collapse. |
| In the text | |
 |
Fig. A.1 Wavelet spectra from the analytic wavelet convolution of elliptical Gaussians with axes of 1 × 3 pixels (top panel) and 1 × 9 pixels (bottom panel), respectively. |
| In the text | |
 |
Fig. A.2 Degree of local and global anisotropy from the analytic wavelet convolution of elliptical Gaussians with axes of 1 × 3 pixels and 1 × 9 pixels. |
| In the text | |
 |
Fig. B.1 Comparison of the Δ-variance spectra with the isotropic wavelet and Fourier spectra for the test structures from Figs. 11 and 2, i.e., a map containing 10 Gaussian clumps with a standard deviation of
σ = 8 pixels (top panel) and a map containing a sinusoidal stripe pattern with a period of
p = 32 pixels (bottom panel). All spectra are plotted using the amplitude rescaling, M∕s2, that always guarantees a peak. The wavelet spectra were computed for localization parameters
|
| In the text | |
 |
Fig. C.1 Comparison of the global degree of anisotropy measured through the wavelet analysis with the degree of isotropy measured through the structure function for two maps containing spherical clumps (σ = 8 pixels, Fig. 11) and elliptical clumps (σ = 6 × 18 pixels) all aligned at 45 degrees (Fig. D.3). |
| In the text | |
 |
Fig. C.2 Comparison of the global degree of anisotropy measured through the wavelet analysis with the degree of isotropy measured through the structure function for two maps containing either a single or ten randomly distributed and oriented elliptic clumps with an axes ratio of 4:1 (σ = 8 × 32 pixels, see Fig. 13). |
| In the text | |
 |
Fig. D.1 Anisotropic wavelet analysis of a map containing elliptic Gaussian clumps with standard deviations of 6 and 18 pixels in orthogonal directions providing an aspect ratio of 3:1 and having random orientations. Upper panel: original map. Lower panel: degrees of anisotropy. |
| In the text | |
 |
Fig. D.2 Map of anisotropic wavelet coefficients (top panel) and map of the ratio of anisotropic to isotropic wavelet coefficients (bottom panel) for the structure of elliptic Gaussian clumps from Fig. D.1 computed for a wavelet size s of 10.1 pixels. |
| In the text | |
 |
Fig. D.3 Degrees of anisotropy for a map containing the elliptic Gaussian clumps from Fig. D.1, but all aligned in the same orientation of 45 degrees. |
| In the text | |
 |
Fig. E.1 Anisotropic wavelet analysis of a white noise map. |
| In the text | |
 |
Fig. E.2 Anisotropic wavelet analysis of a map containing a fractional Brownian motion structure with a spectral index β = −3 superimposed by Gaussian noise (S∕N = 5). |
| In the text | |
 |
Fig. E.3 Anisotropic wavelet analysis of a map containing the projection of a sphere with a r−2 density profile. |
| In the text | |
 |
Fig. E.4 Anisotropic wavelet analysis of a map containing a sinusoidal stripe pattern with ky = 16, i.e. a period of p = 32 pixels. |
| In the text | |
 |
Fig. E.5 Anisotropic wavelet analysis of a map containing an asymmetric p = 2 Plummer profile with Ra = 3.2 pixels and σc = 26 pixels. |
| In the text | |
 |
Fig. E.6 Anisotropic wavelet analysis of a map containing an asymmetric p = 2 Plummer profile with Ra = 3.2 pixels and σc = 13 pixels. |
| In the text | |
 |
Fig. E.7 Anisotropic wavelet analysis of a map containing a superposition of 100 randomly placed spherical clumps with σ = 8 pixels. |
| In the text | |
 |
Fig. E.8 Analysis of a map containing a superposition of 100 randomly placed and oriented Gaussian elliptical clumps with σa = 4 pixels and σc = 16 pixels. |
| In the text | |
 |
Fig. E.9 Analysis of a map containing a superposition of 100 randomly placed Gaussian elliptical clumps with σ = 4 × 16 pixels all oriented at an angle of 60 degrees. |
| In the text | |
 |
Fig. E.10 Analysis for a superposition of a big elliptic clump with σ = 20 × 100 pixels with 10 small spherical clumps with σ = 8 pixels. |
| In the text | |
Current usage metrics show cumulative count of Article Views (full-text article views including HTML views, PDF and ePub downloads, according to the available data) and Abstracts Views on Vision4Press platform.
Data correspond to usage on the plateform after 2015. The current usage metrics is available 48-96 hours after online publication and is updated daily on week days.
Initial download of the metrics may take a while.


![$|W(s,\mathrm{\varphi}_m,\textbf{x})| =\max_{\mathrm{\varphi}\in[0,\mathrm{\pi}]}{|W(s,\mathrm{\varphi},\textbf{x})|}.$](/articles/aa/full_html/2019/01/aa31596-17/aa31596-17-eq179.png)