Fig. 16
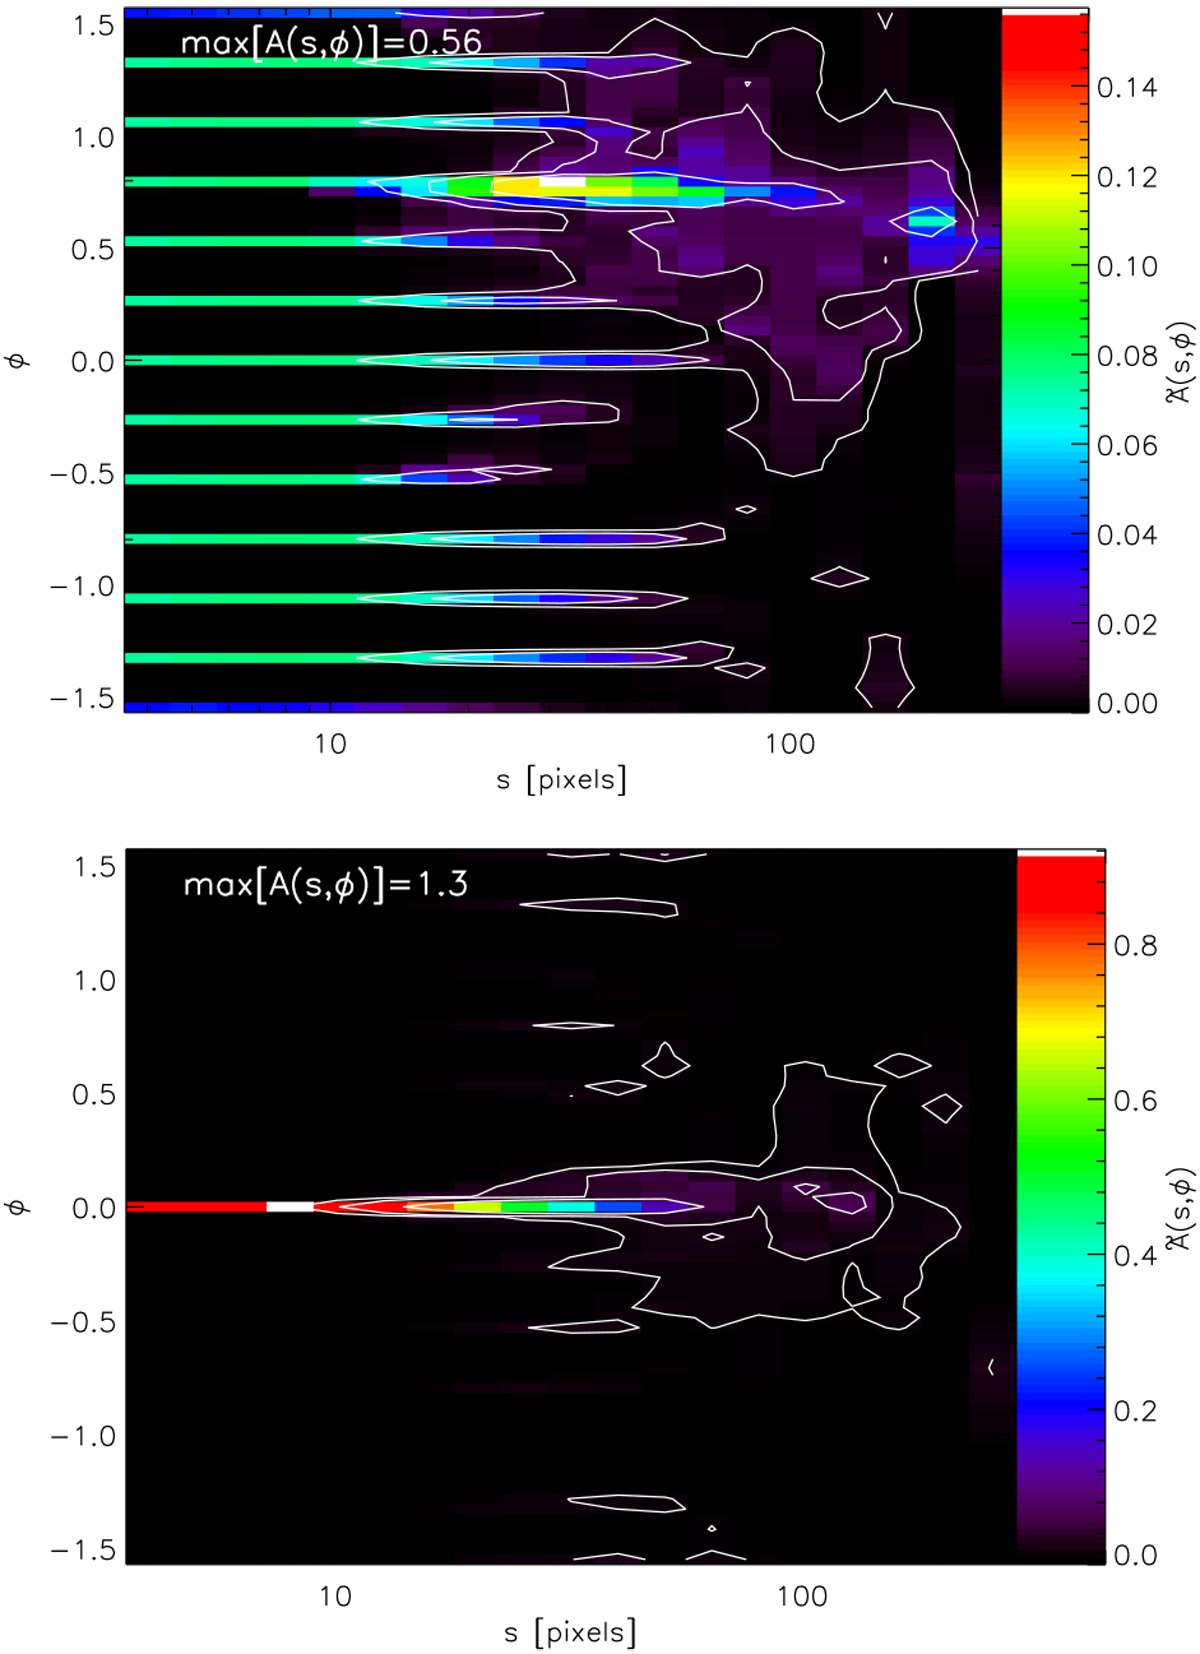
Angular distribution of the anisotropic wavelet coefficients for the maps containing the two ensembles of clumps from Figs. 14 (top panel, σ = 6 × 18 pixel clumps at 45 degrees, σ = 3 × 27 pixel clumps uniformly distributed) and 15 (bottom panel, σ = 6 × 18 pixel clumps uniformly distributed, σ = 3 × 27 pixel clumps at 0 degrees). The contours show the 2D spectrum of wavelet coefficients A(s, φ) at levels of 1/30, 1/10, and 1/3 of the peak value indicated in the top-left corner of the plot. The colors represent the coefficients normalized by the spectrum of isotropic modes, Ã (s, φ) (Eq. (13)), on a linear scale.
Current usage metrics show cumulative count of Article Views (full-text article views including HTML views, PDF and ePub downloads, according to the available data) and Abstracts Views on Vision4Press platform.
Data correspond to usage on the plateform after 2015. The current usage metrics is available 48-96 hours after online publication and is updated daily on week days.
Initial download of the metrics may take a while.