Free Access
Fig. 35
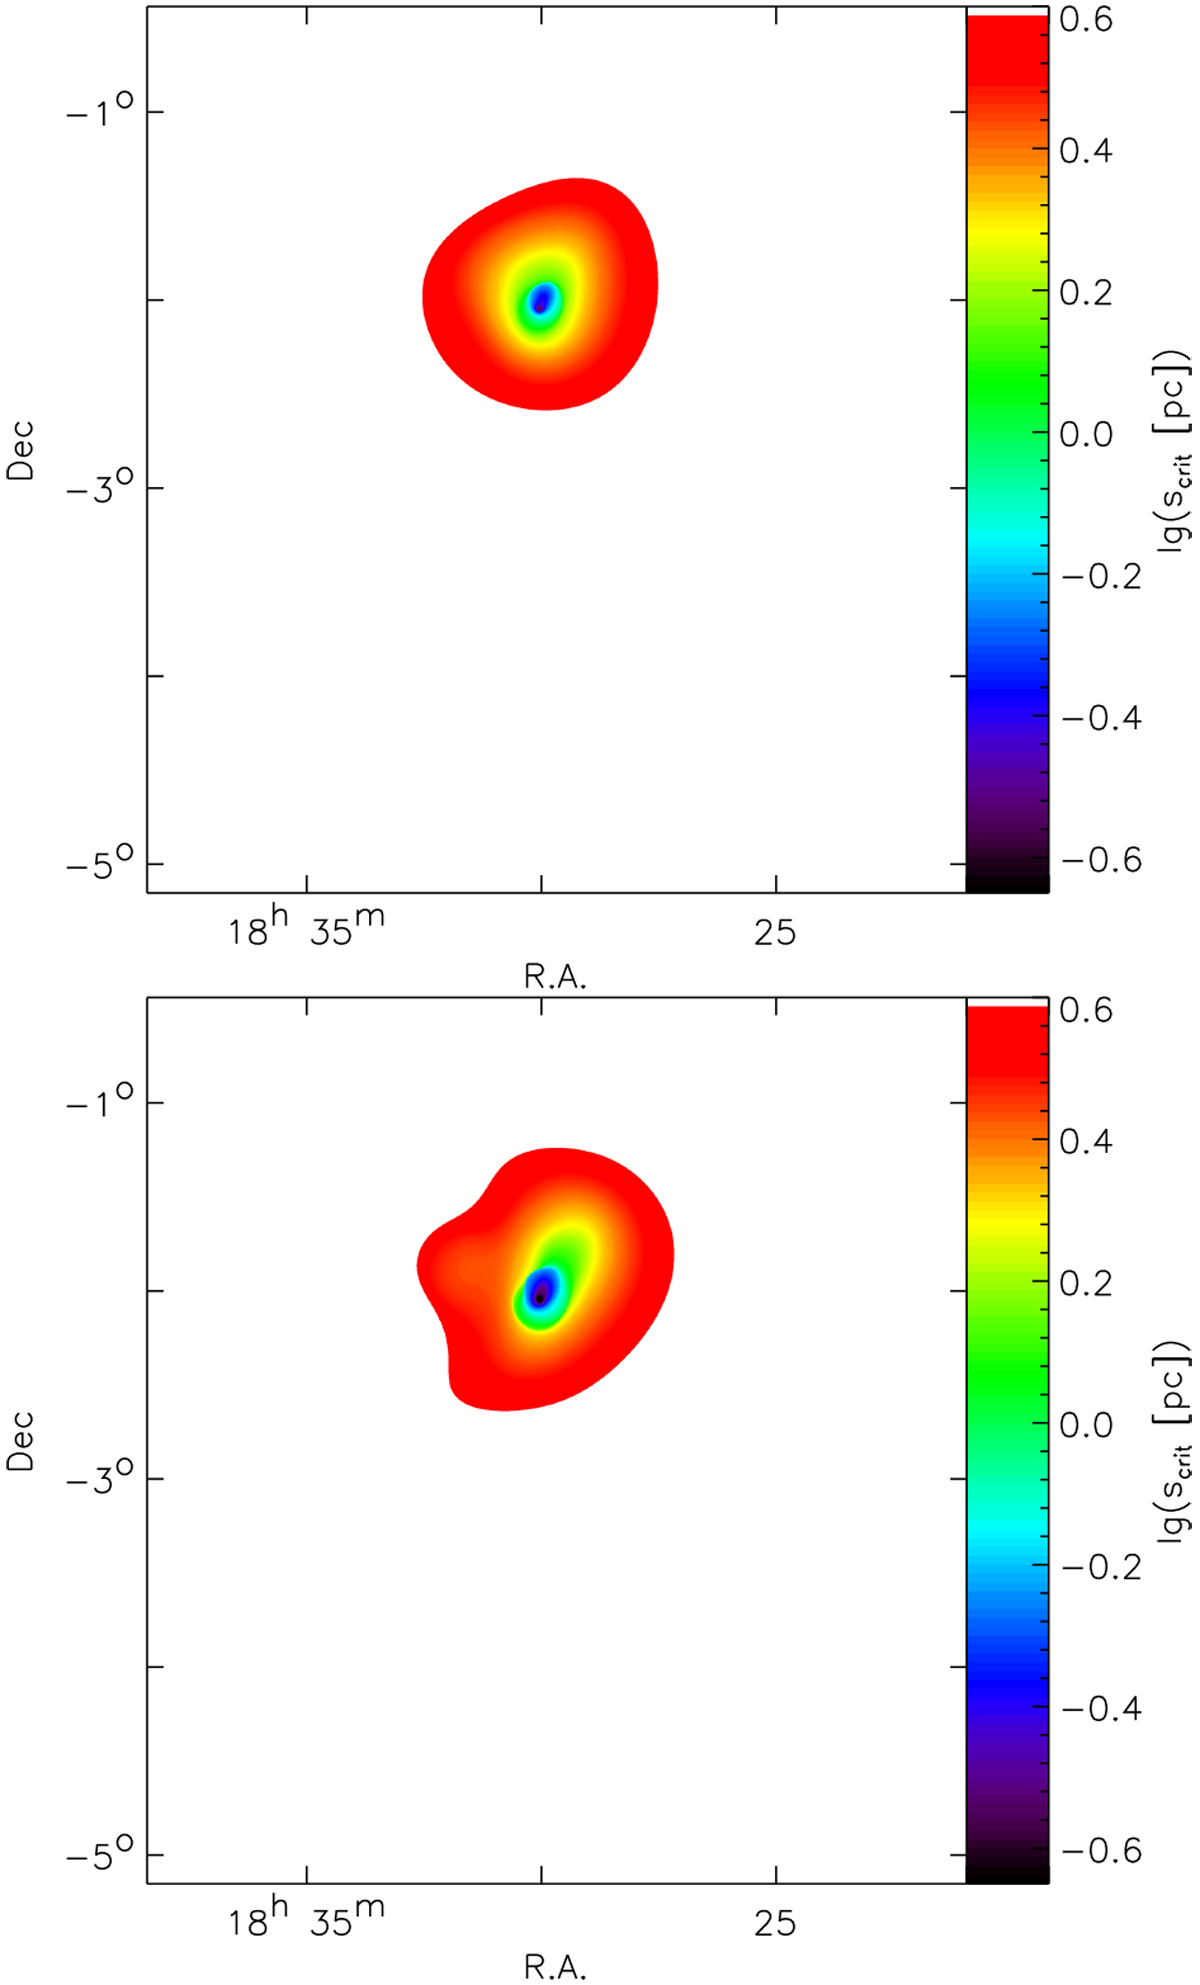
Maps of the critical size for gravitational instability in the Aquila column-density map (Fig. 28). Upper panel: critical scale for isotropic modes, lower panel: anisotropic modes. White areas are regions with densities that are too low for collapse.
Current usage metrics show cumulative count of Article Views (full-text article views including HTML views, PDF and ePub downloads, according to the available data) and Abstracts Views on Vision4Press platform.
Data correspond to usage on the plateform after 2015. The current usage metrics is available 48-96 hours after online publication and is updated daily on week days.
Initial download of the metrics may take a while.