Fig. 13
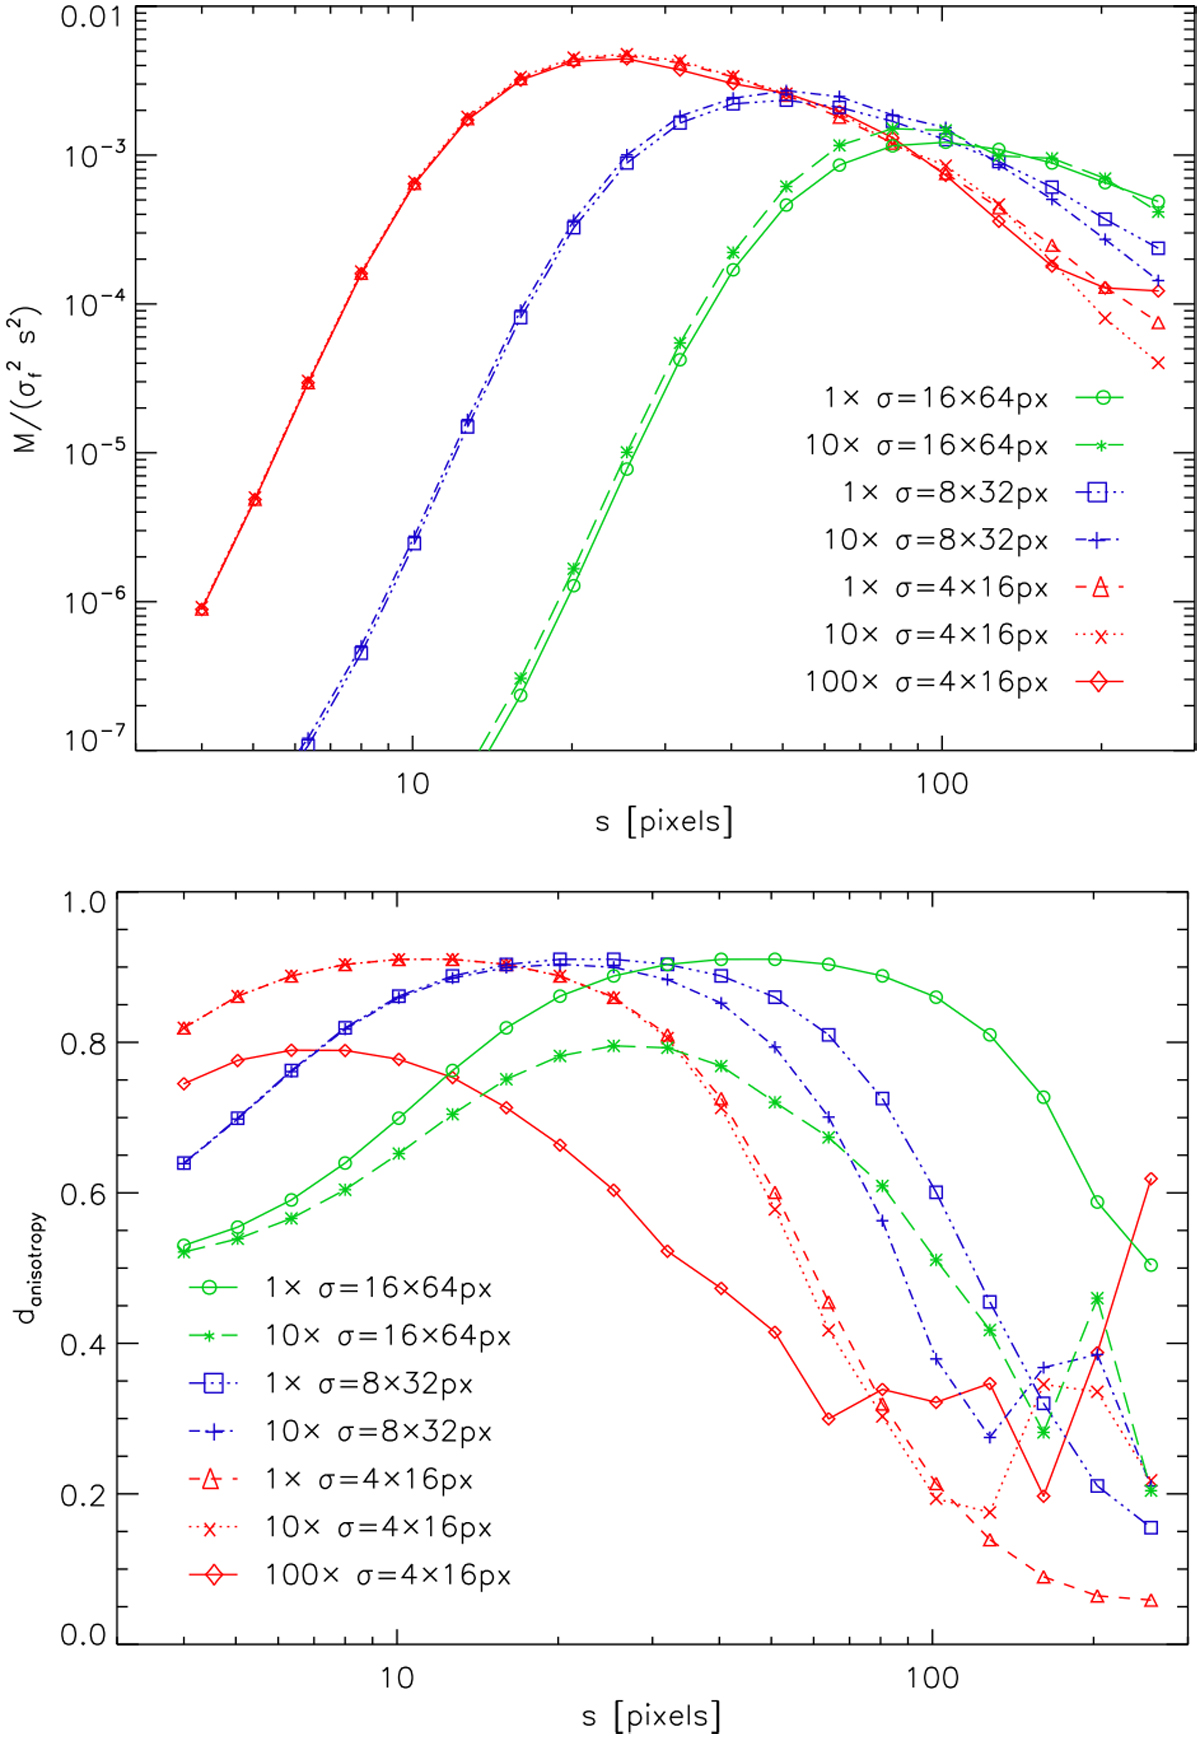
Comparison of the wavelet spectra and local degrees of anisotropy measured in the anisotropic wavelet analysis for maps containing randomly placed and oriented ellipses with different sizes, all with an axes ratio of 4:1 (σ = 4 ×16 pixels, σ = 8 × 32 pixels, σ = 16 × 64 pixels). By changing the number of the clumps, we introduce different degrees of anisotropy on the scale of the typical distance of the clumps. The wavelet spectra are normalized for amplitude per scale weighting by dividing them by ![]() .
.
Current usage metrics show cumulative count of Article Views (full-text article views including HTML views, PDF and ePub downloads, according to the available data) and Abstracts Views on Vision4Press platform.
Data correspond to usage on the plateform after 2015. The current usage metrics is available 48-96 hours after online publication and is updated daily on week days.
Initial download of the metrics may take a while.