Free Access
Fig. 31
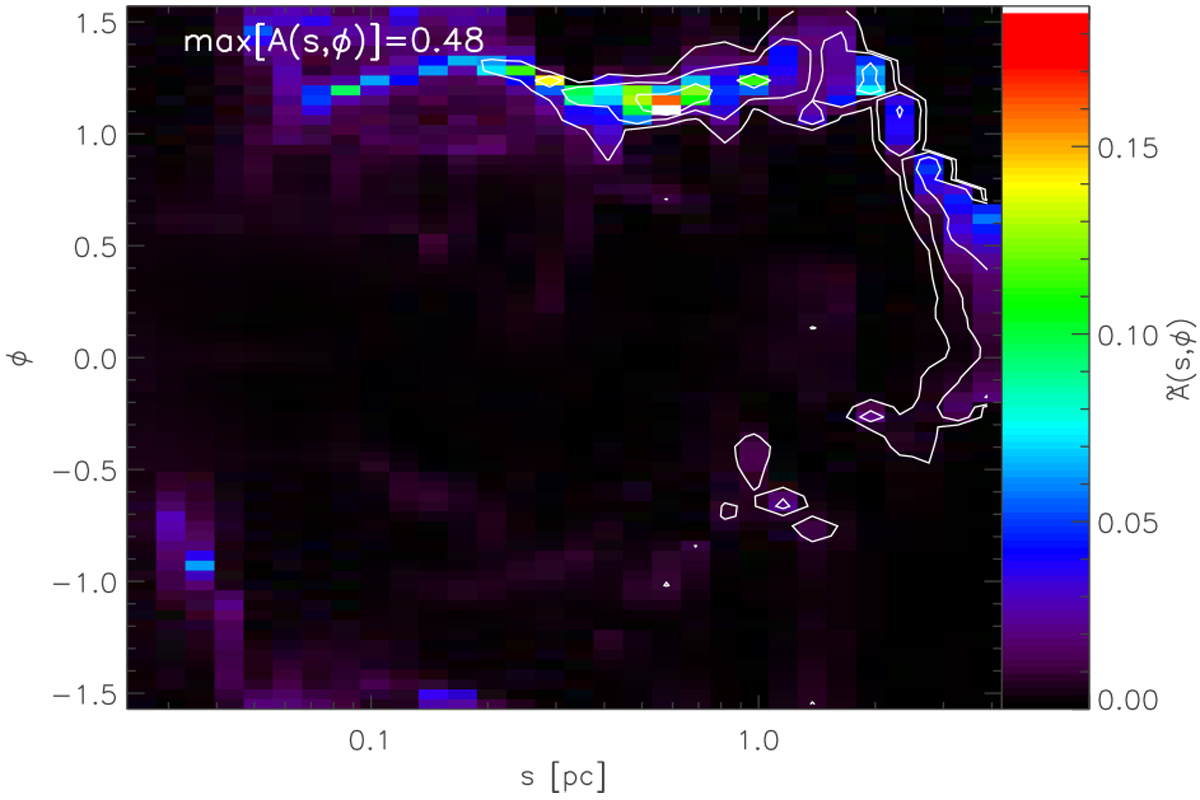
Two-dimensional spectrum of anisotropic wavelet coefficients (contours) and degrees of anisotropy (color) for Aquila. The contours are drawn at levels of 1/30, 1/10, and 1/3 of the peak value indicated in the top-left corner of the plot. The angles are plotted in radians.
Current usage metrics show cumulative count of Article Views (full-text article views including HTML views, PDF and ePub downloads, according to the available data) and Abstracts Views on Vision4Press platform.
Data correspond to usage on the plateform after 2015. The current usage metrics is available 48-96 hours after online publication and is updated daily on week days.
Initial download of the metrics may take a while.