Fig. 32
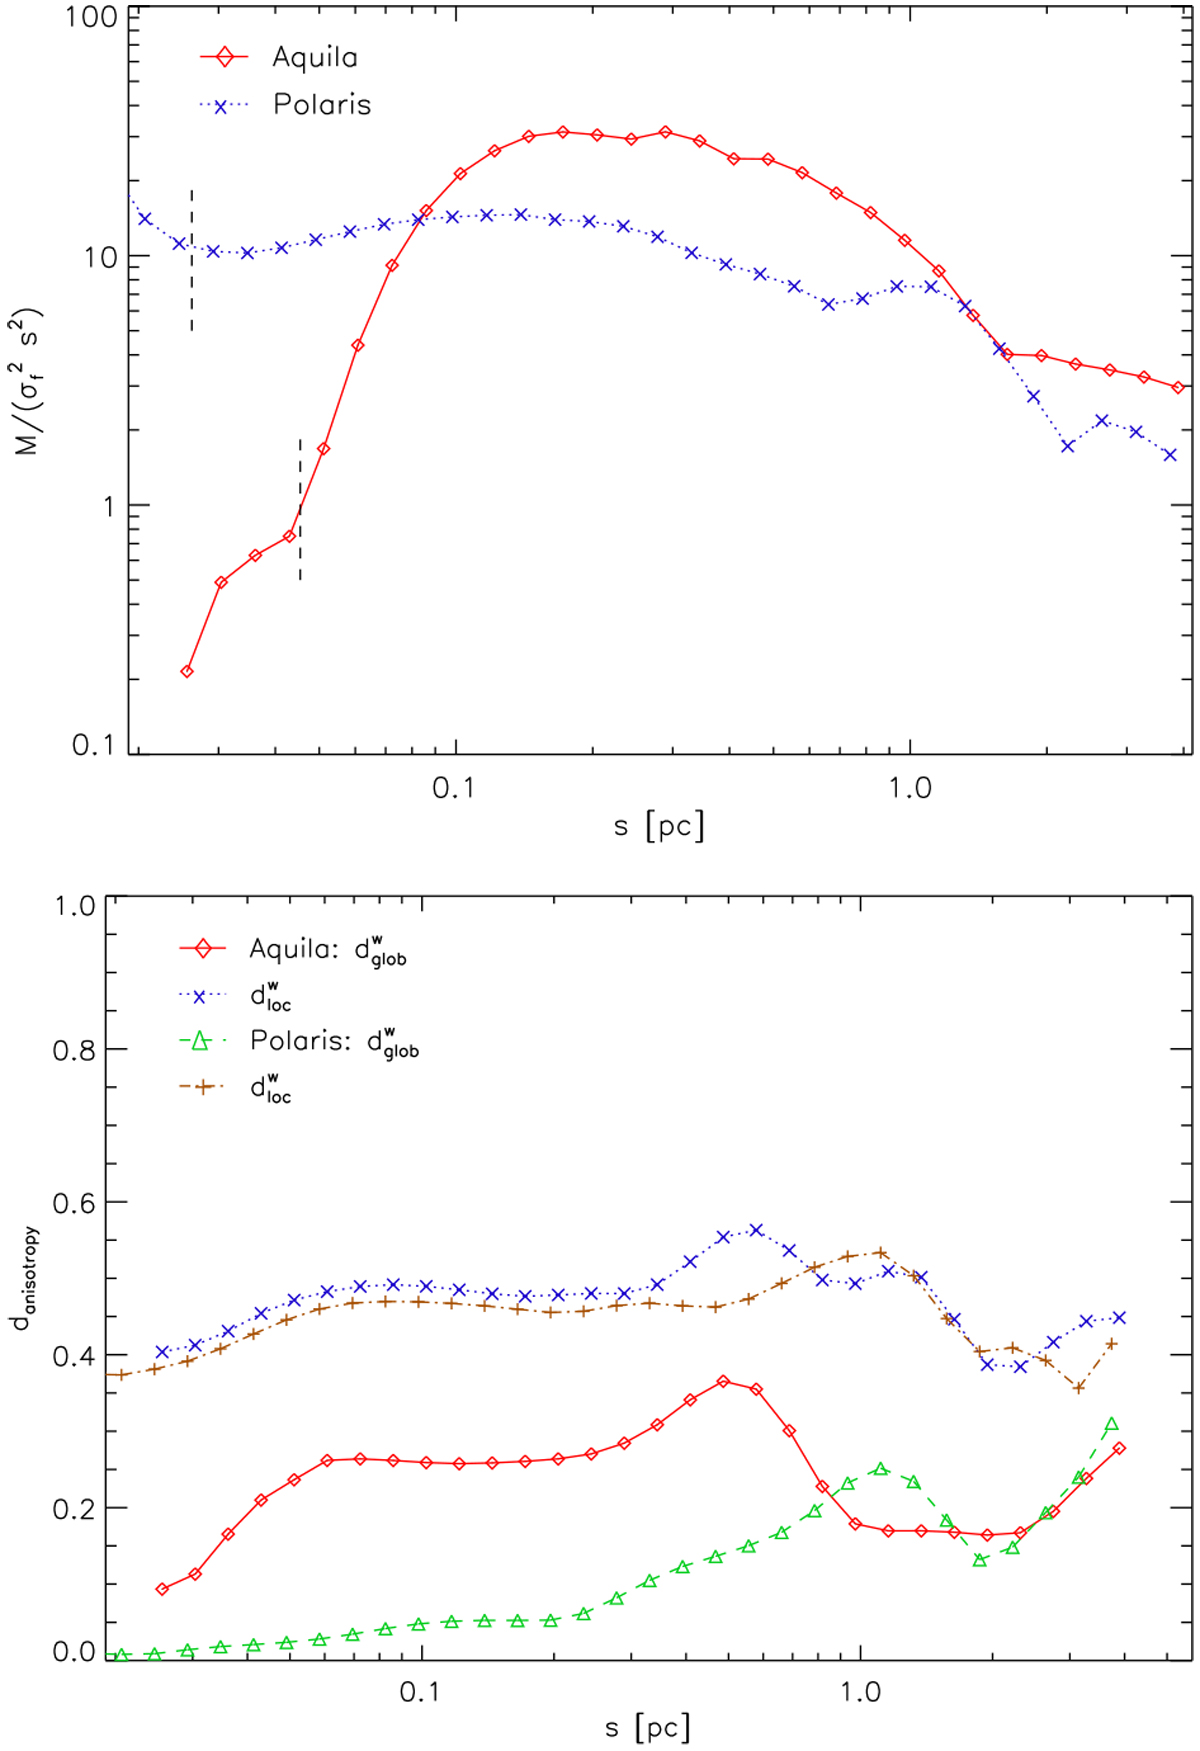
Spectra of rescaled isotropic wavelet spectra Mi(s)∕s2 (top panel, ![]() ) and local and global degrees of anisotropy (bottom panel,
) and local and global degrees of anisotropy (bottom panel, ![]() ) for the two maps from Fig. 28. The dashed lines in the panel for the spectra mark the spatial resolution in the two maps. Around that scale and below, the structures in the map are dominated by the telescope beam and observational noise.
) for the two maps from Fig. 28. The dashed lines in the panel for the spectra mark the spatial resolution in the two maps. Around that scale and below, the structures in the map are dominated by the telescope beam and observational noise.
Current usage metrics show cumulative count of Article Views (full-text article views including HTML views, PDF and ePub downloads, according to the available data) and Abstracts Views on Vision4Press platform.
Data correspond to usage on the plateform after 2015. The current usage metrics is available 48-96 hours after online publication and is updated daily on week days.
Initial download of the metrics may take a while.