Fig. 27
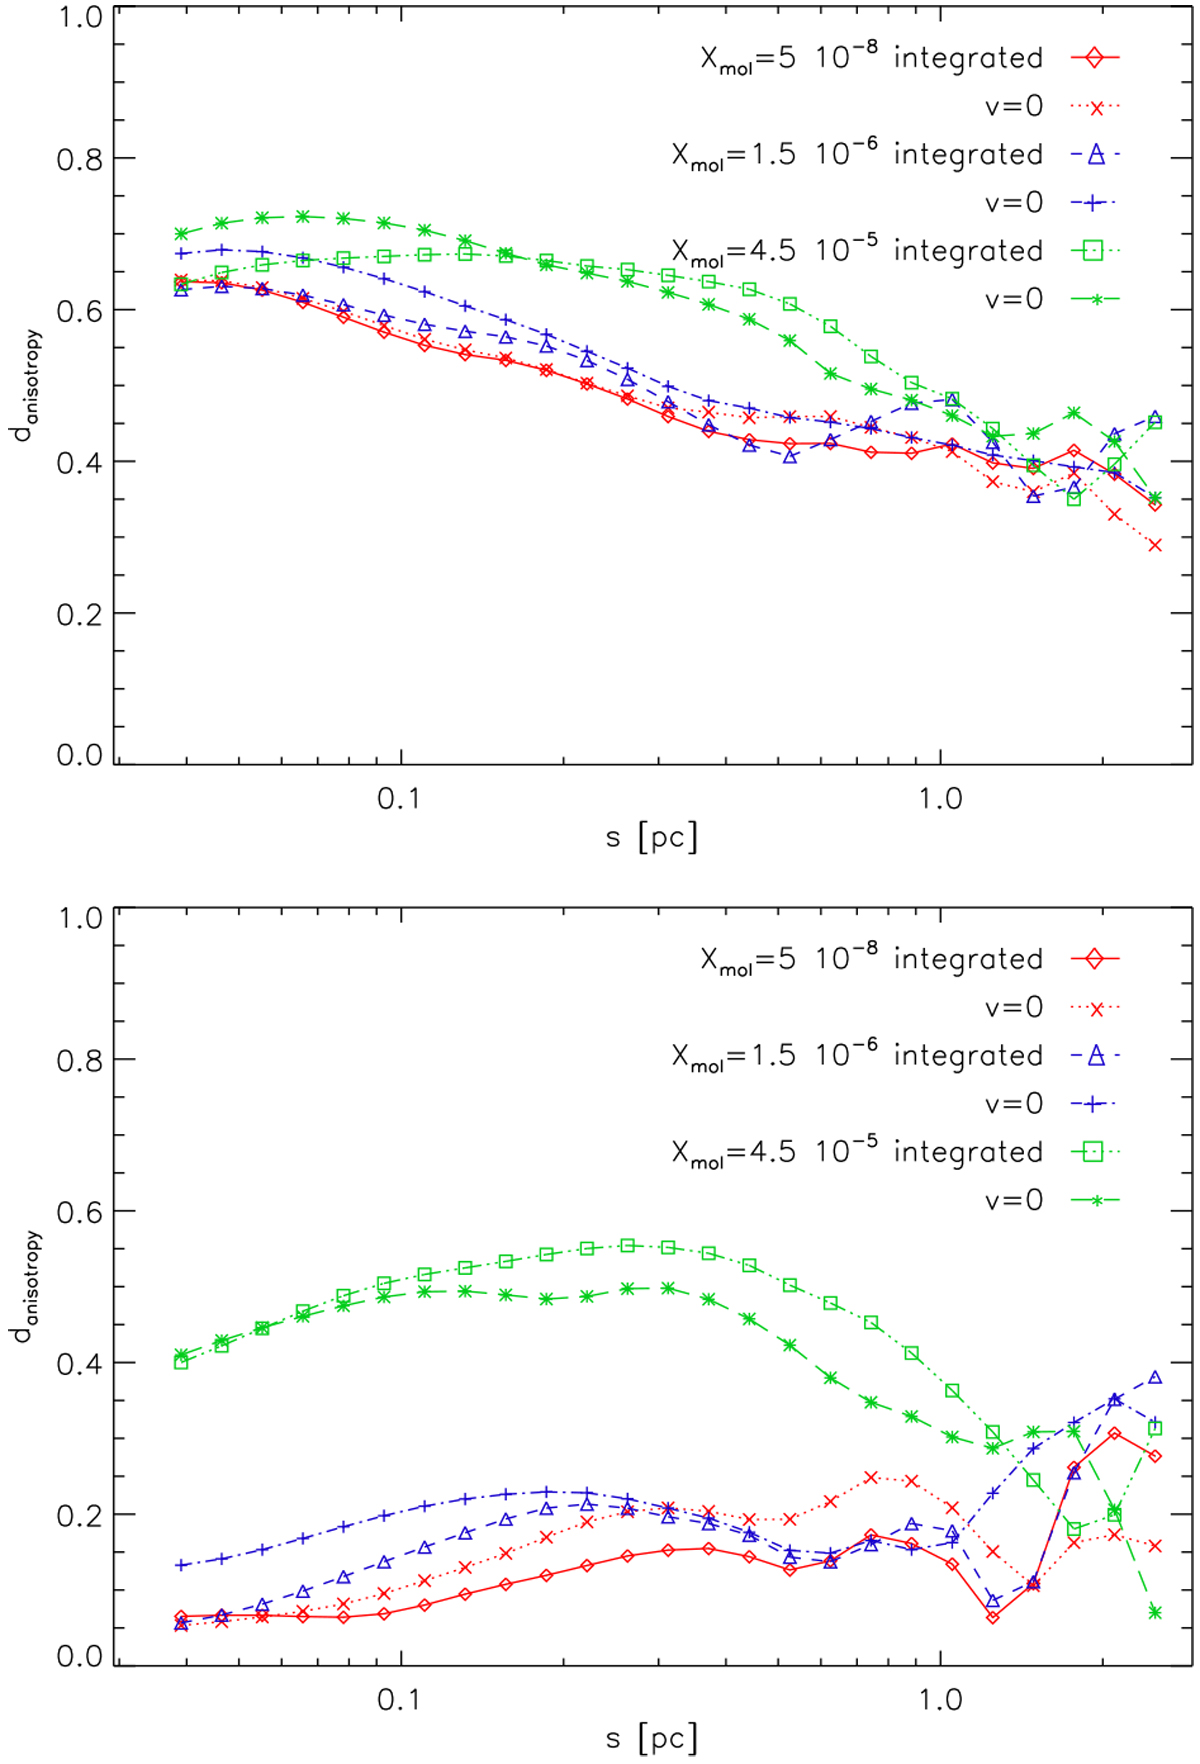
Spectra of the local degree of anisotropy (top panel) and the global degree of anisotropy (bottom panel) for the six maps from Figs. 24 and 25. The filamentary density structure seen at low optical depths provides a high degree of local anisotropy at small scales. But those filaments appear unaligned. For large optical depths (brown and purple curves) the velocity filaments dominate and the global anisotropy in the x direction becomes significant. Following Sect. 3.6, the ![]() filter was used for the degrees.
filter was used for the degrees.
Current usage metrics show cumulative count of Article Views (full-text article views including HTML views, PDF and ePub downloads, according to the available data) and Abstracts Views on Vision4Press platform.
Data correspond to usage on the plateform after 2015. The current usage metrics is available 48-96 hours after online publication and is updated daily on week days.
Initial download of the metrics may take a while.