Free Access
Fig. 24
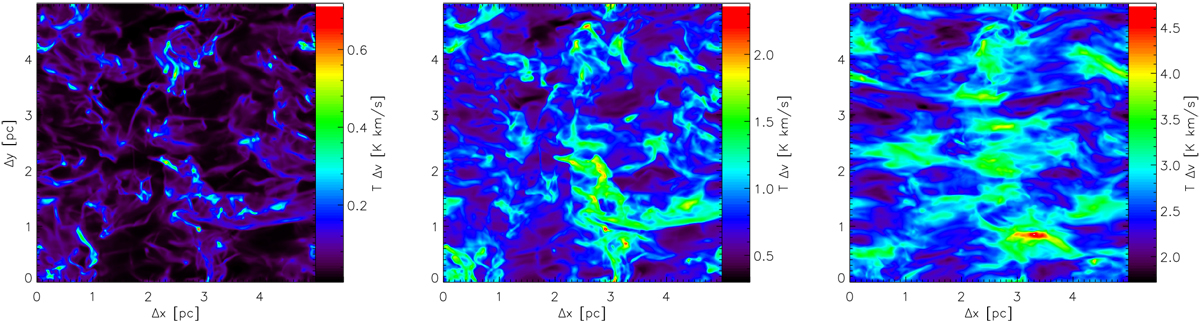
Maps of line-integrated intensities of the J = 2 − 1 transition of CO isotopologs computed for the MHD simulation from Fig. 23. The molecule abundances in the three panels are X = 5 × 10⁻⁸, 1.5 × 10⁻⁶, and 4.5 × 10⁻⁵.
Current usage metrics show cumulative count of Article Views (full-text article views including HTML views, PDF and ePub downloads, according to the available data) and Abstracts Views on Vision4Press platform.
Data correspond to usage on the plateform after 2015. The current usage metrics is available 48-96 hours after online publication and is updated daily on week days.
Initial download of the metrics may take a while.