Fig. 8
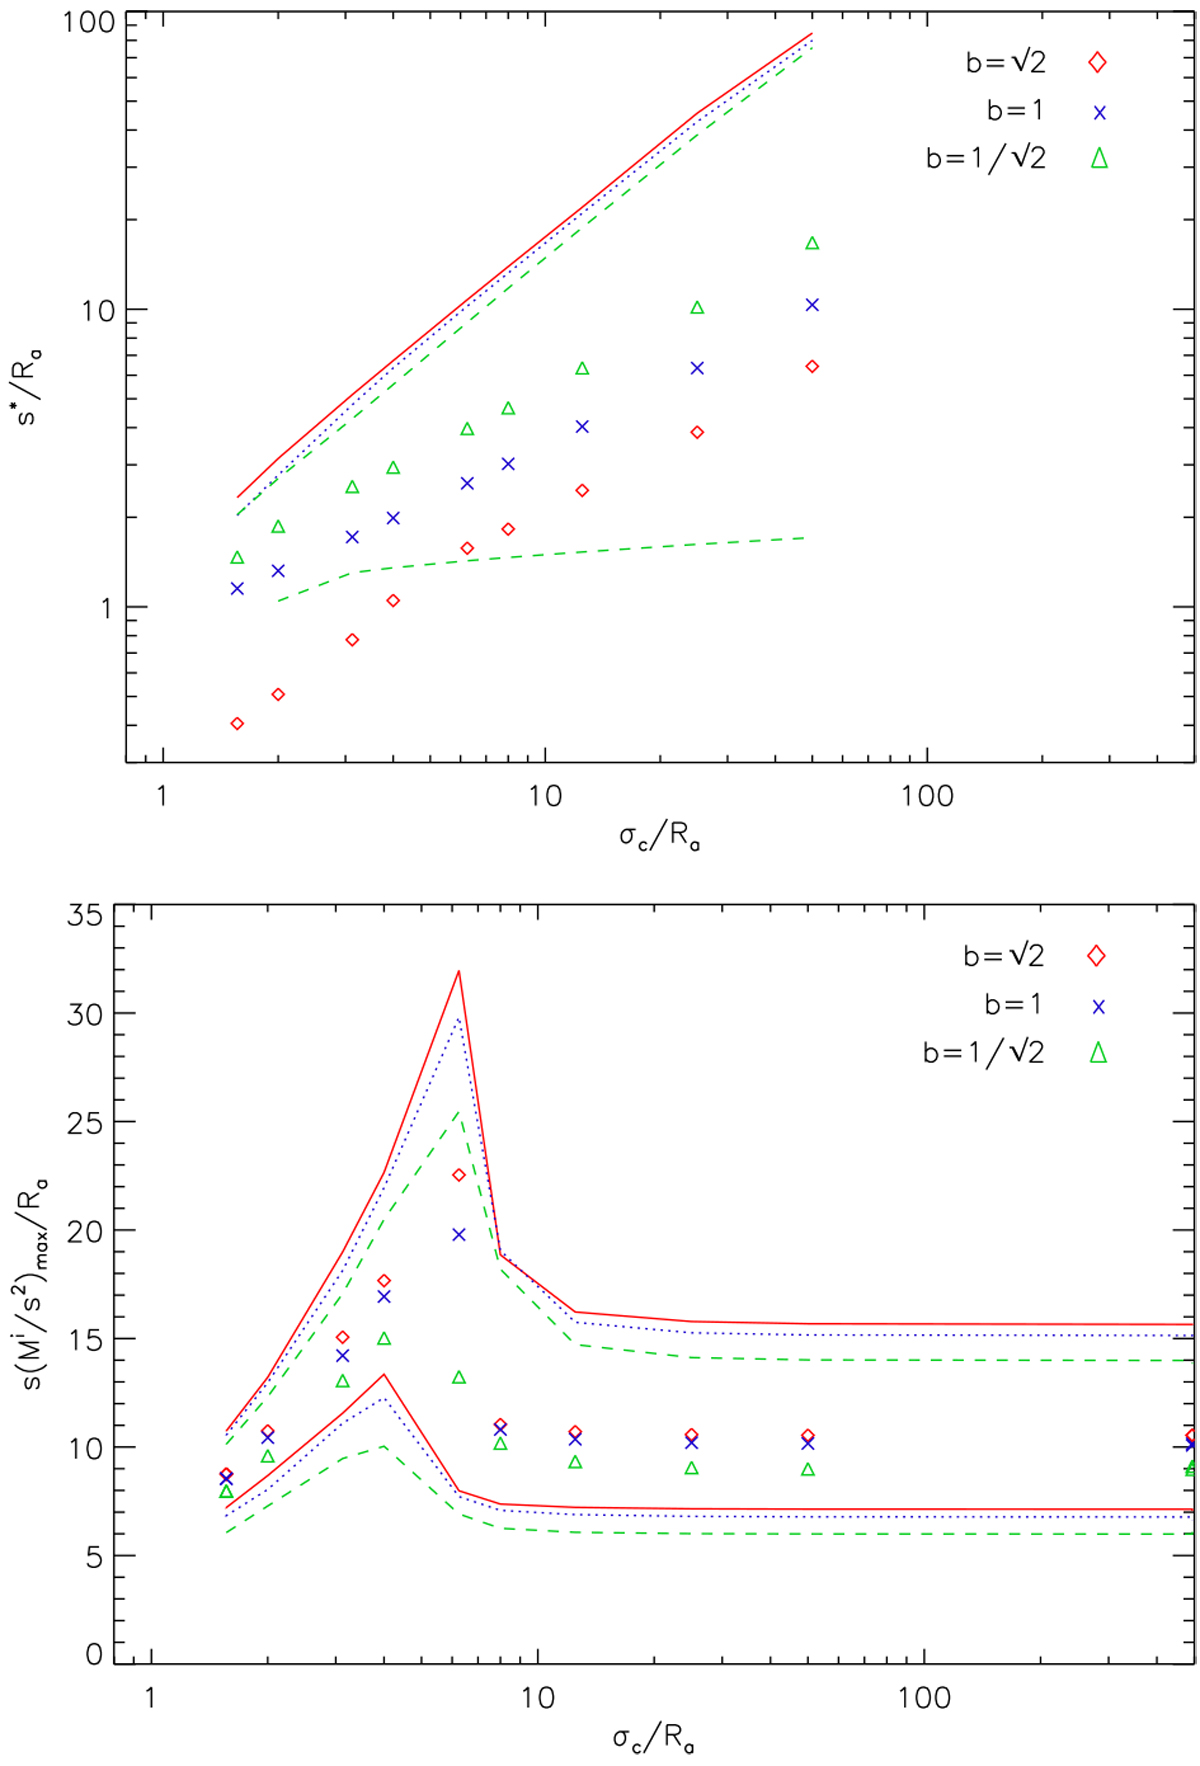
Parameters of the peak plateau regions for the degree of anisotropy (upper plot), and the rescaled spectra of isotropic wavelet coefficients, Mi∕s2 (lower plot), as a function of the aspect ratio of the Plummer ellipses. We labeled the y-axes by the variables for the peak of the two quantities. For every filter, the central dots give the location of the peak and the two outer lines show the plateau edges, at 90% of the peak. For the wavelet coefficients, the dots at the right edge of the plotted range represent the values for an infinite aspect ratio, i.e., a one-dimensional (1D) Plummer profile. In the degree of anisotropy, we were not able to measure the lower edge of the plateau except for the ![]() filter as the peak is extended and close to the minimum scale of the maps.
filter as the peak is extended and close to the minimum scale of the maps.
Current usage metrics show cumulative count of Article Views (full-text article views including HTML views, PDF and ePub downloads, according to the available data) and Abstracts Views on Vision4Press platform.
Data correspond to usage on the plateform after 2015. The current usage metrics is available 48-96 hours after online publication and is updated daily on week days.
Initial download of the metrics may take a while.