Fig. B.1
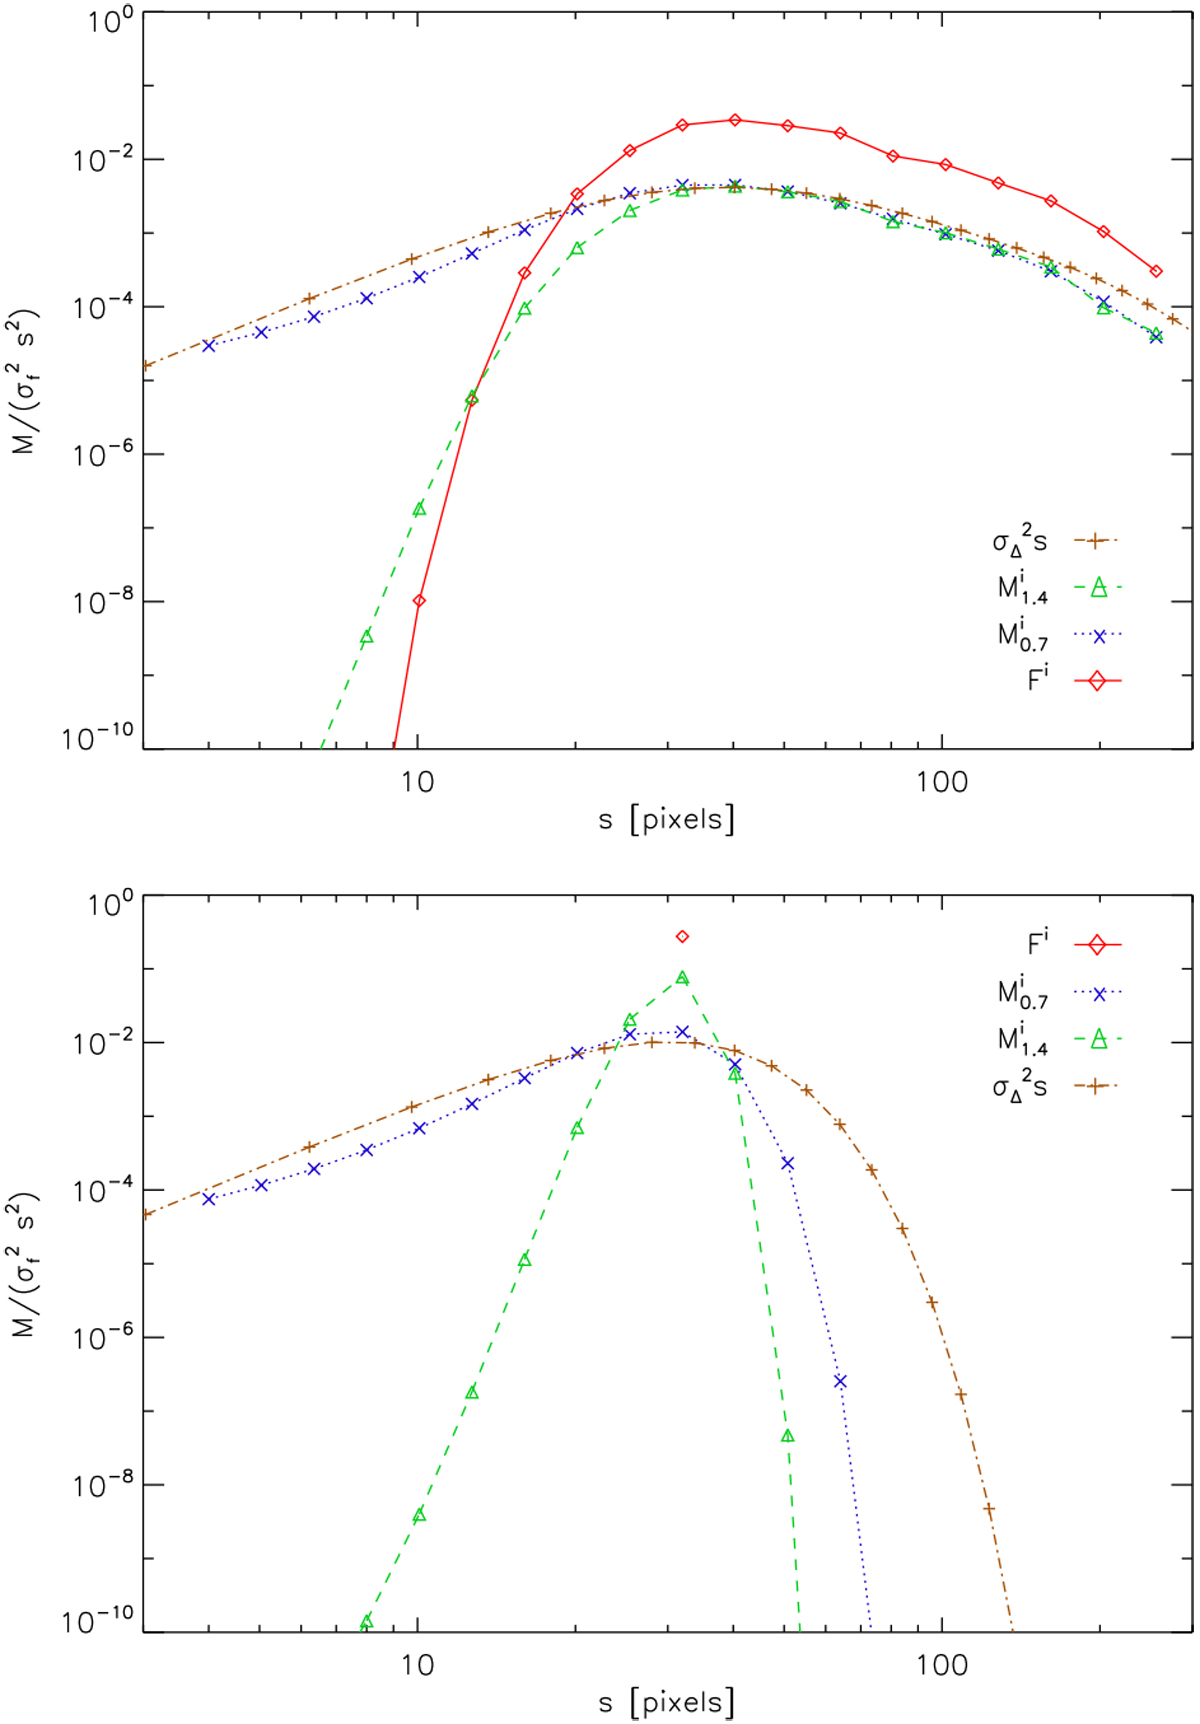
Comparison of the Δ-variance spectra with the isotropic wavelet and Fourier spectra for the test structures from Figs. 11 and 2, i.e., a map containing 10 Gaussian clumps with a standard deviation of
σ = 8 pixels (top panel) and a map containing a sinusoidal stripe pattern with a period of
p = 32 pixels (bottom panel). All spectra are plotted using the amplitude rescaling, M∕s2, that always guarantees a peak. The wavelet spectra were computed for localization parameters
![]() and
and ![]() .
.
Current usage metrics show cumulative count of Article Views (full-text article views including HTML views, PDF and ePub downloads, according to the available data) and Abstracts Views on Vision4Press platform.
Data correspond to usage on the plateform after 2015. The current usage metrics is available 48-96 hours after online publication and is updated daily on week days.
Initial download of the metrics may take a while.