Fig. 9
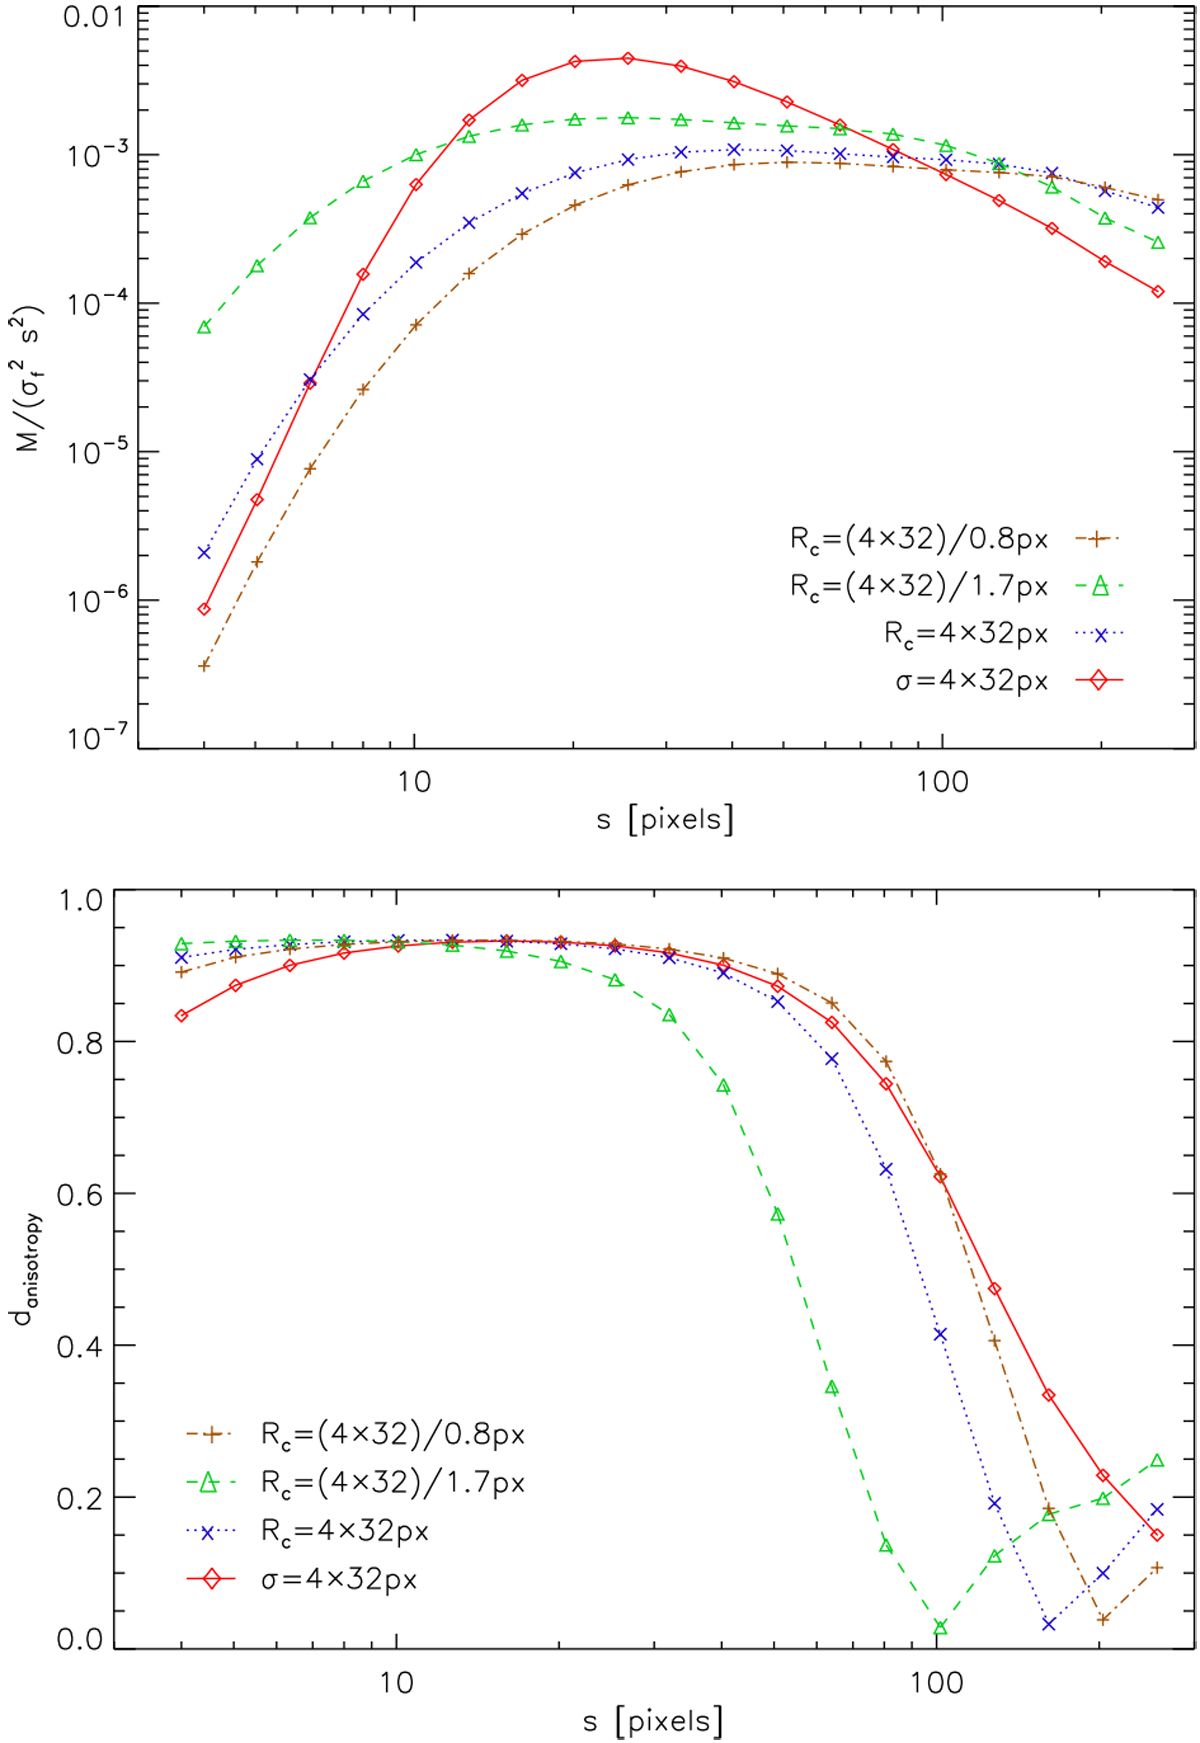
Comparison of the rescaled spectra of the isotropic wavelet coefficients (top panel) and the local degree of anisotropy (bottom panel) for elliptical Gaussian clumps with σa = 4 pixels, σc = 32 pixels and Plummer profile clumps with Ra = 4 pixels and σc = 32 pixels. To test the fit relations for the peaks in the wavelet spectra and the degree of anisotropy, we also show the results for Plummer profile clumps that are smaller by a factor 1/1.7 and larger by the factor 1/0.8.
Current usage metrics show cumulative count of Article Views (full-text article views including HTML views, PDF and ePub downloads, according to the available data) and Abstracts Views on Vision4Press platform.
Data correspond to usage on the plateform after 2015. The current usage metrics is available 48-96 hours after online publication and is updated daily on week days.
Initial download of the metrics may take a while.