Fig. 19
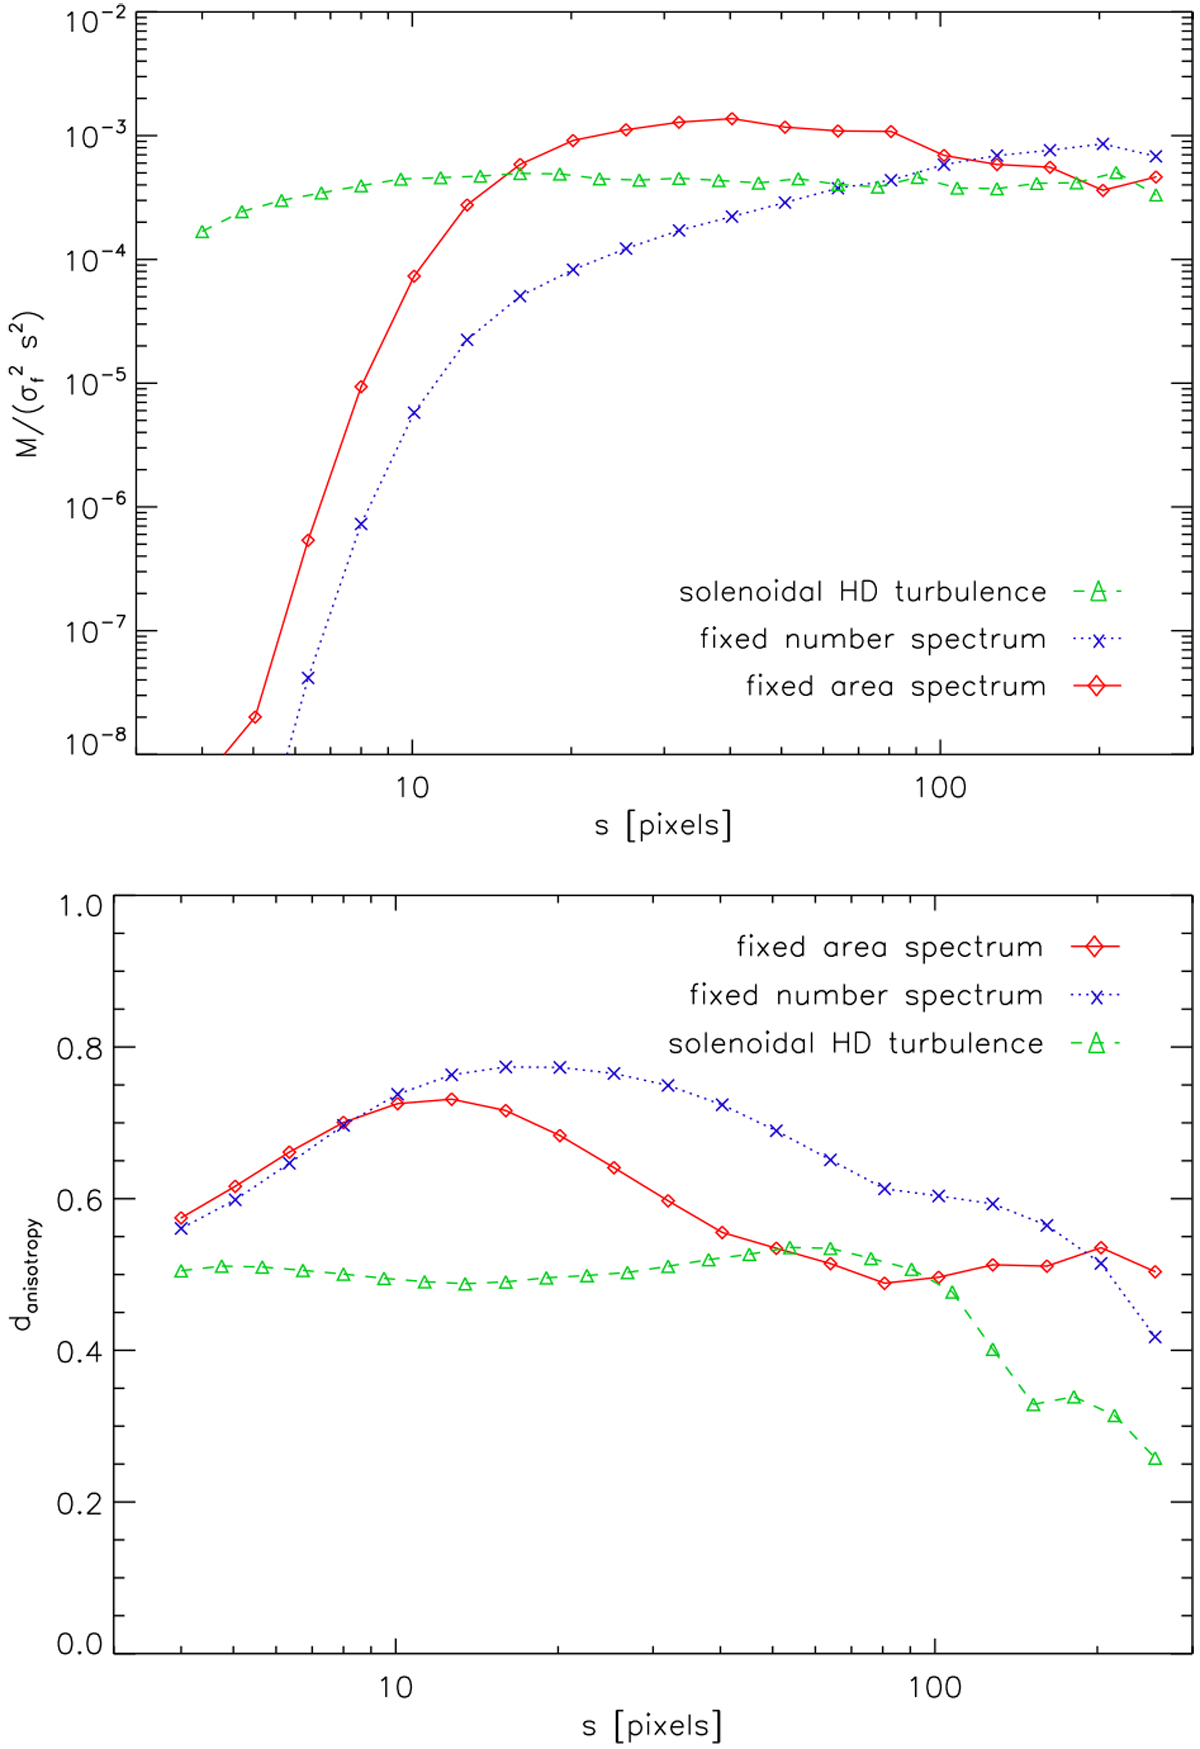
Comparison of the normalized spectra of the isotropic wavelet coefficients (top panel) and the local degree of anisotropy (bottom panel) for maps with a hierarchy of structures of different sizes. The green line represents the projected density structure in a simulation of fully developed hydrodynamic turbulence with a close-to-power-law power spectrum and no preferred direction (Federrath et al. 2010). The blue and red curves show the results for maps composed of a hierarchy of Gaussian clumps with sizes of σ = 4 × 16, 8 × 32, 16 × 64, and 32 ×128 pixels. One map contains two clumps of each size, the other one a fixed area for clumps of different sizes, i.e., 64 clumps of the smallest sizeand one clump of the largest size.
Current usage metrics show cumulative count of Article Views (full-text article views including HTML views, PDF and ePub downloads, according to the available data) and Abstracts Views on Vision4Press platform.
Data correspond to usage on the plateform after 2015. The current usage metrics is available 48-96 hours after online publication and is updated daily on week days.
Initial download of the metrics may take a while.