Fig. 33
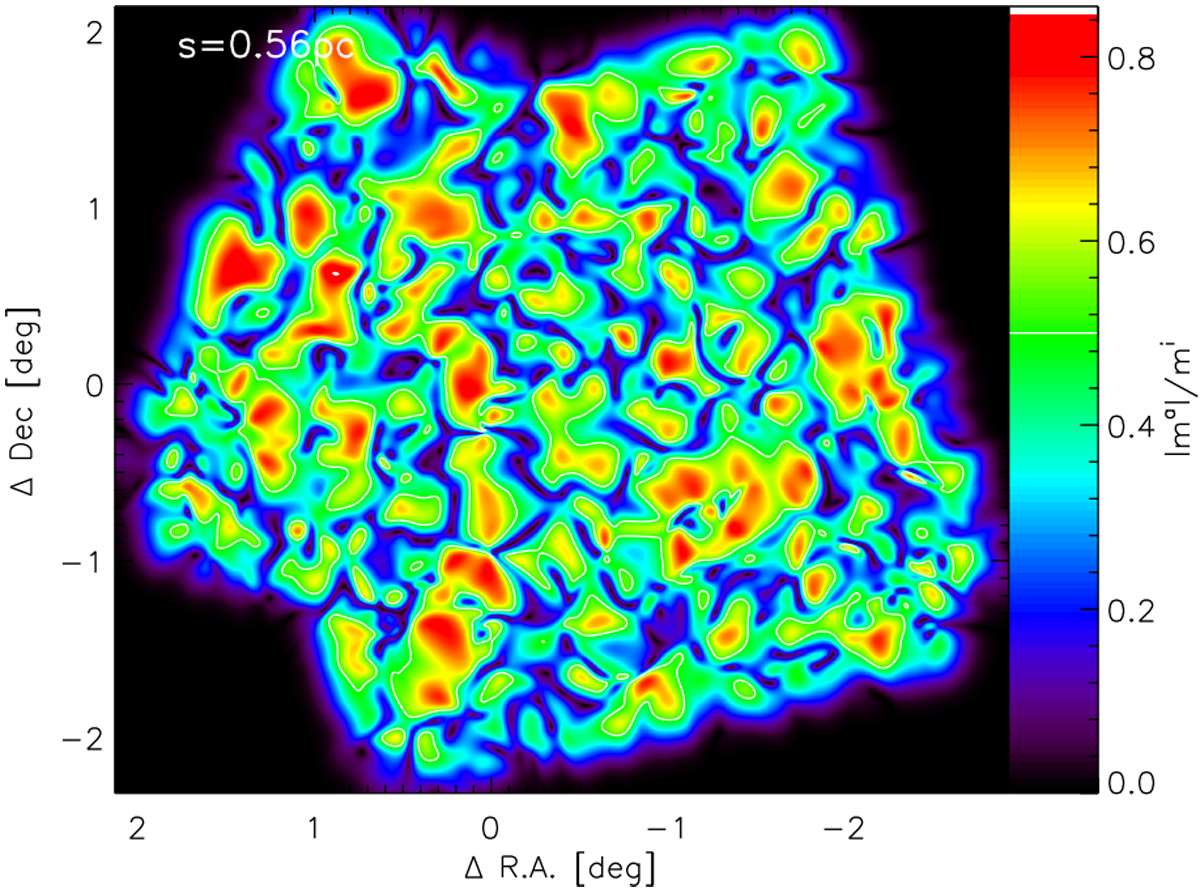
Map of the local degree of anisotropy |ma(s, x)|∕mi(s, x) for the Polaris column-density map when using the ![]() -filter with a size ofs = 0.56 pc = 0.21°. The white contour at a value of 0.5 separates regions dominated by anisotropic fluctuations from those dominated by isotropic fluctuations. There is no obvious correlation to the corresponding map of wavelet coefficients shown in the lower panel of Fig. 29.
-filter with a size ofs = 0.56 pc = 0.21°. The white contour at a value of 0.5 separates regions dominated by anisotropic fluctuations from those dominated by isotropic fluctuations. There is no obvious correlation to the corresponding map of wavelet coefficients shown in the lower panel of Fig. 29.
Current usage metrics show cumulative count of Article Views (full-text article views including HTML views, PDF and ePub downloads, according to the available data) and Abstracts Views on Vision4Press platform.
Data correspond to usage on the plateform after 2015. The current usage metrics is available 48-96 hours after online publication and is updated daily on week days.
Initial download of the metrics may take a while.