Fig. 5
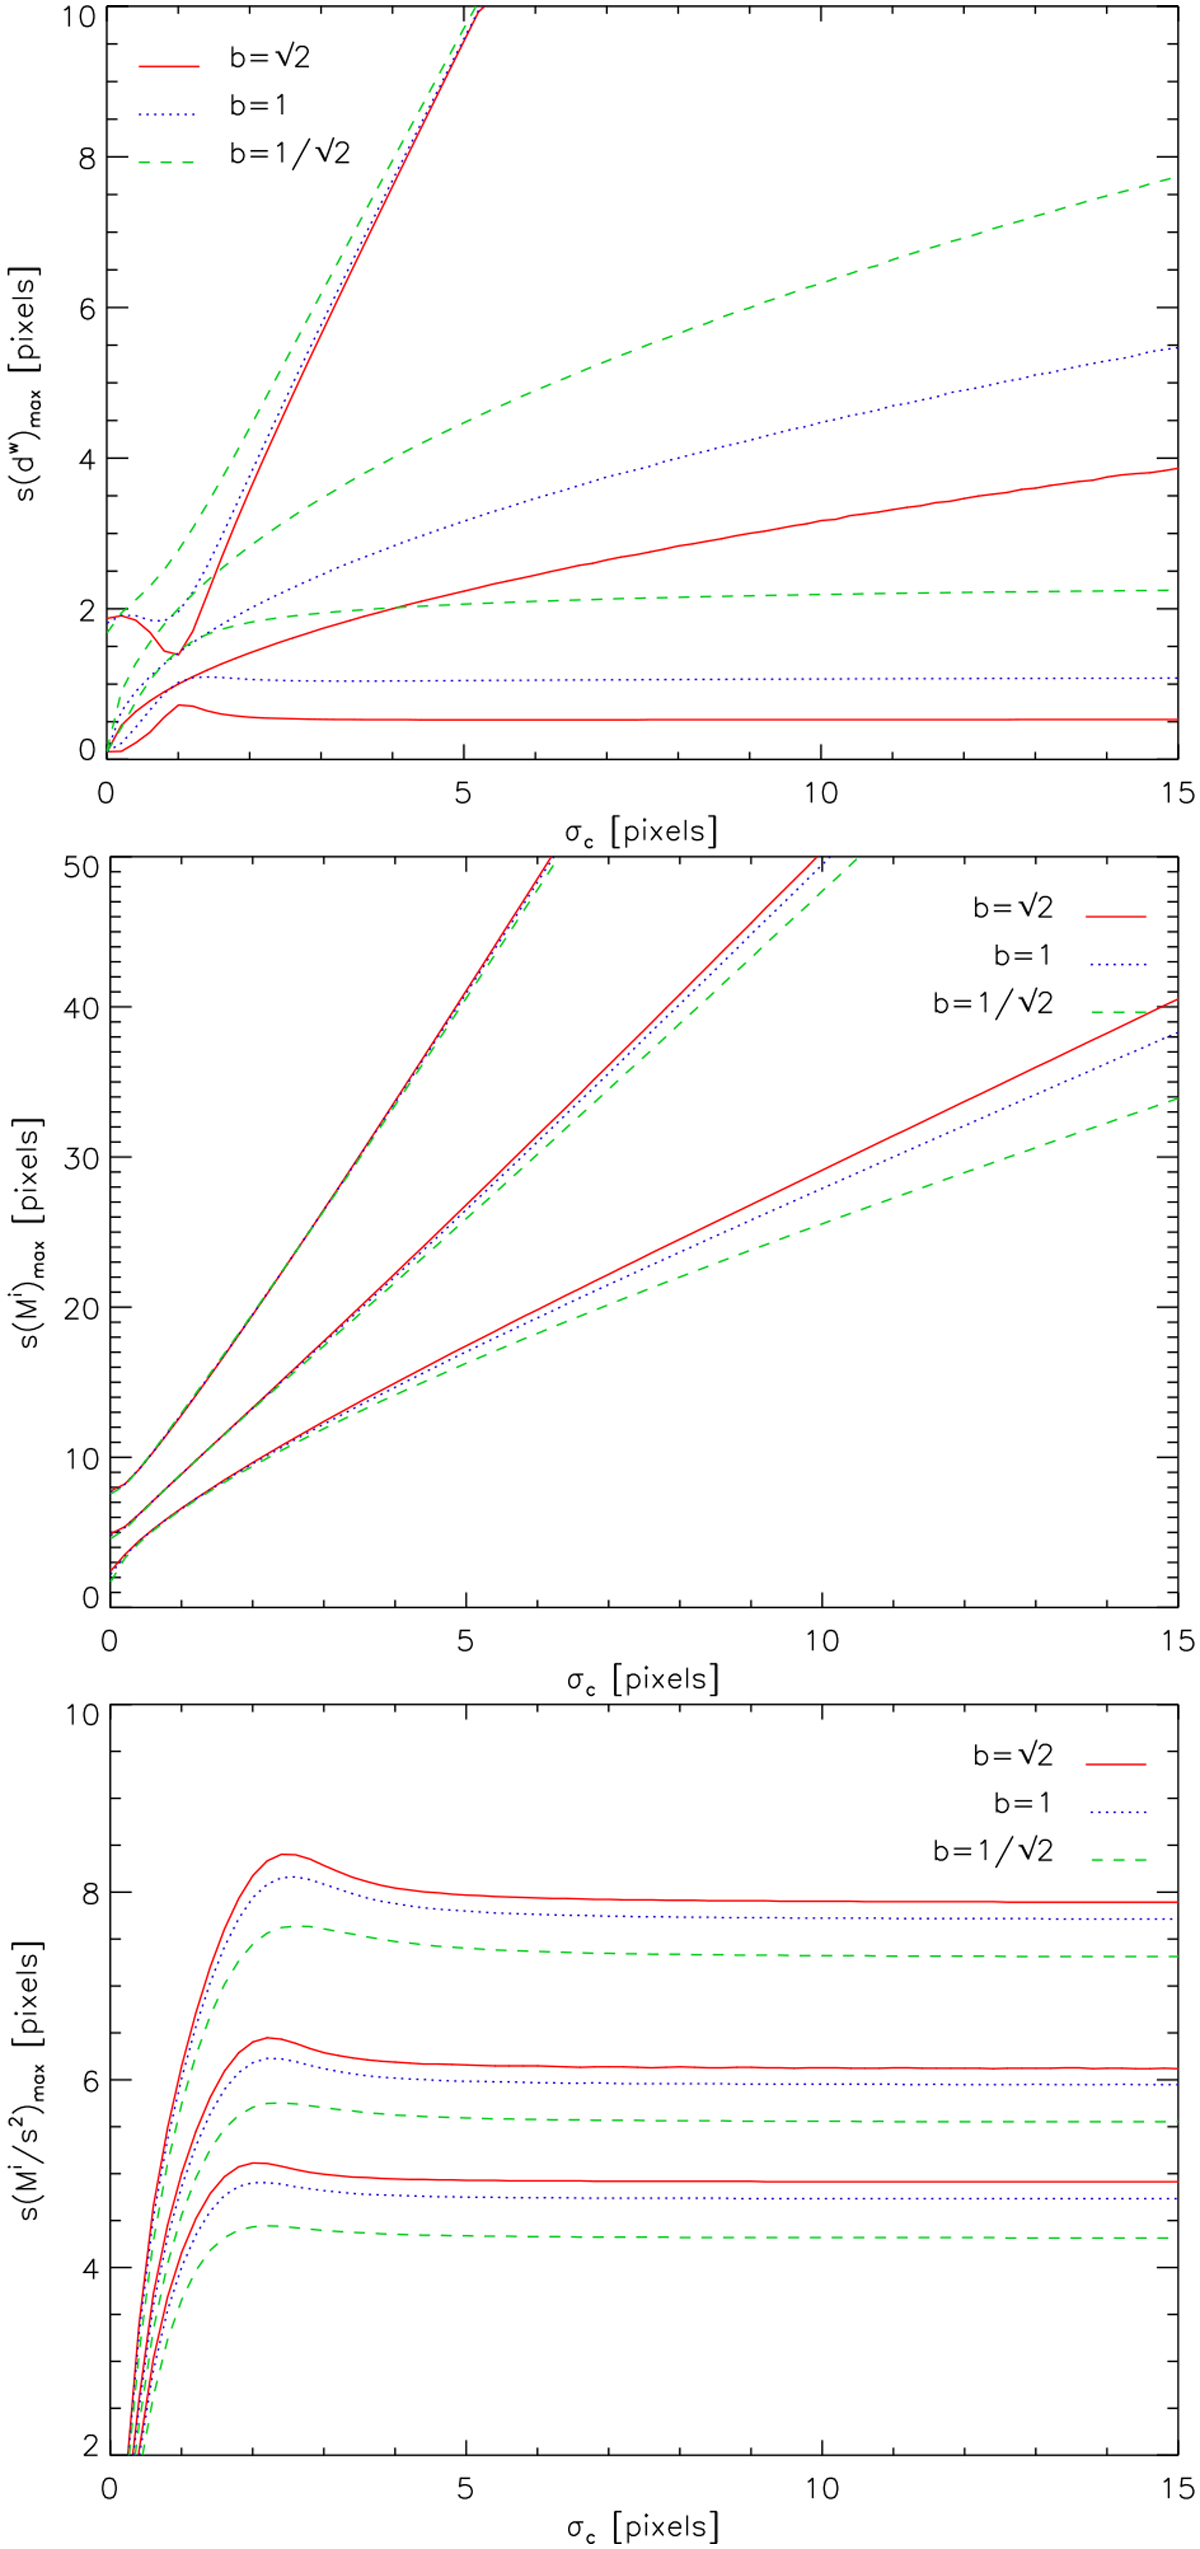
Dependence of the peak region of the degree of anisotropy (upper plot), the spectra of isotropic wavelet coefficients, Mi (central plot), and the quadratic-scale-normalized spectra of isotropic wavelet coefficients, Mi ∕s2 (lower plot), on the aspect ratio of the Gaussian ellipses. We changed the major axis σc of the ellipses while keeping the minor axis σa = 1 pixel constant. For every filter, three curves are plotted giving the location of the peak and the two plateau edges at 90% of the peak.
Current usage metrics show cumulative count of Article Views (full-text article views including HTML views, PDF and ePub downloads, according to the available data) and Abstracts Views on Vision4Press platform.
Data correspond to usage on the plateform after 2015. The current usage metrics is available 48-96 hours after online publication and is updated daily on week days.
Initial download of the metrics may take a while.