Fig. 17
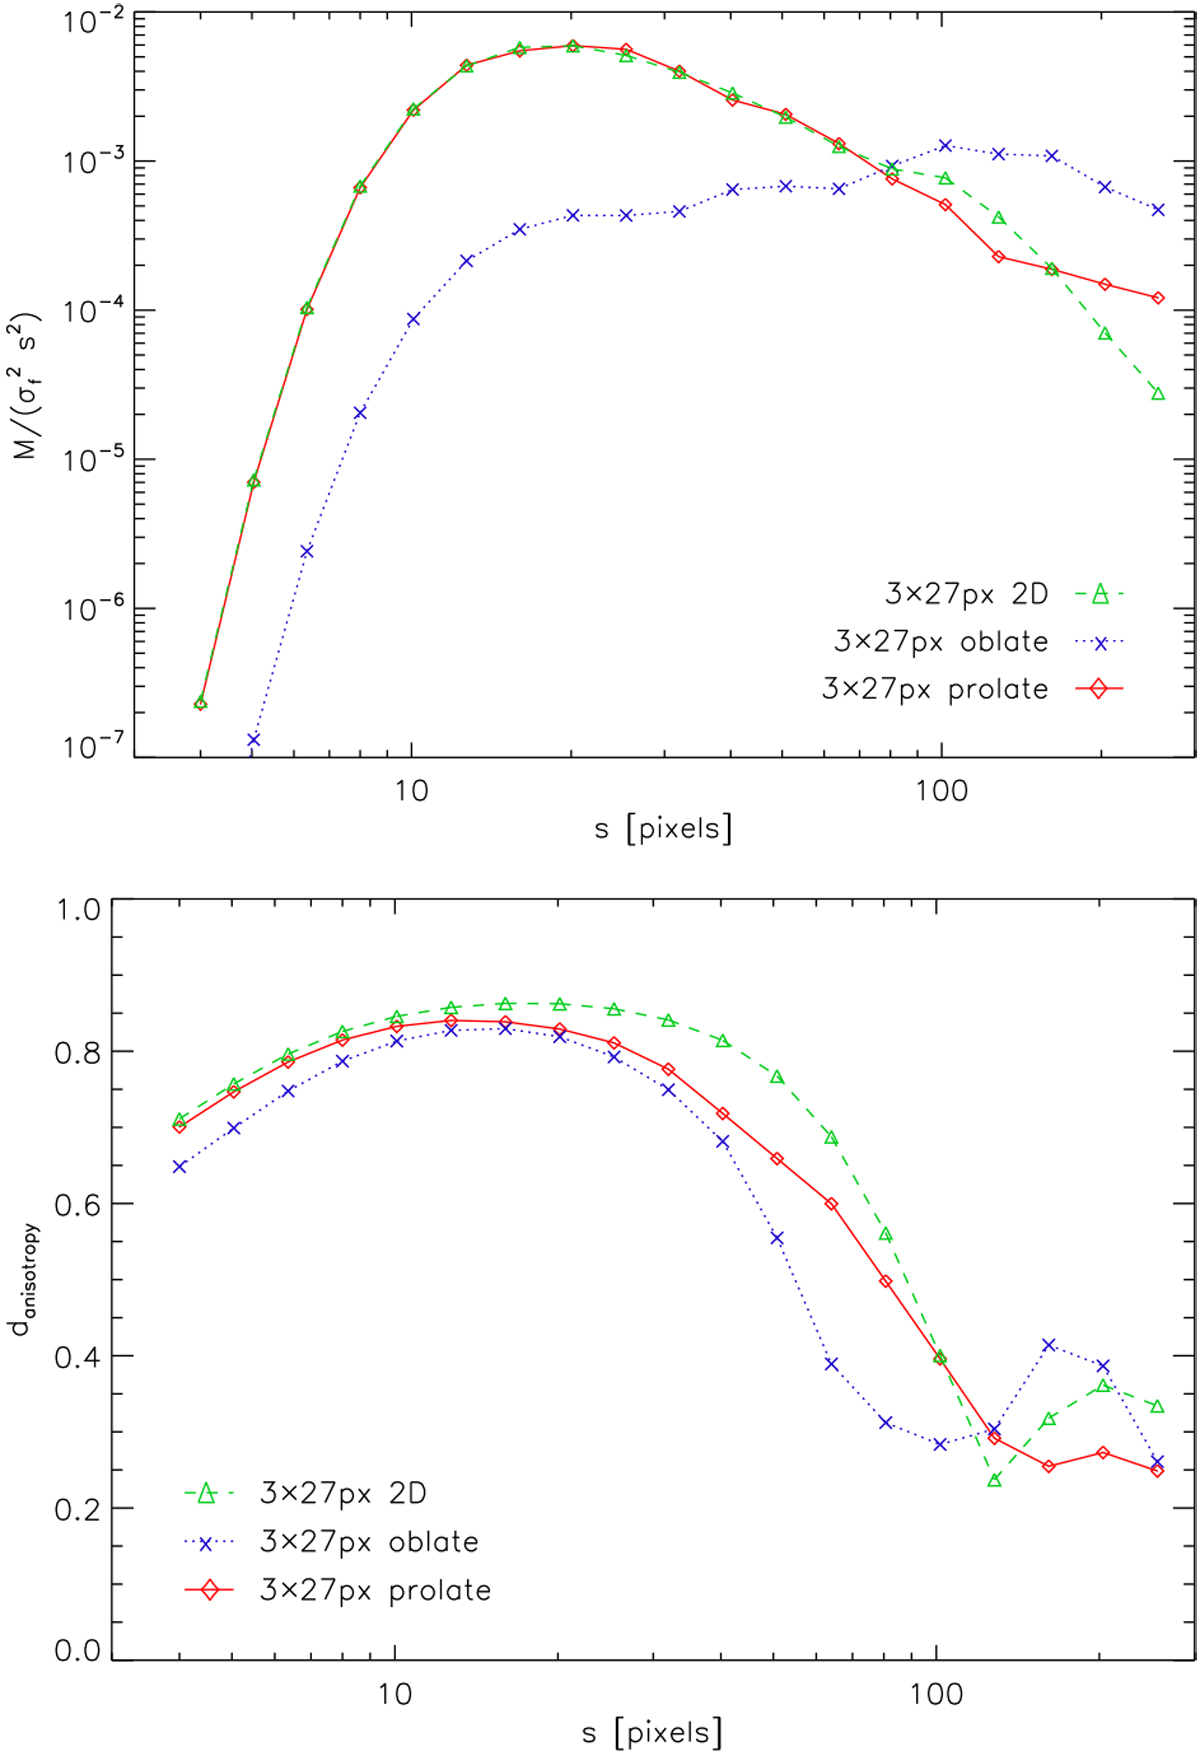
Comparison of the normalized spectra of the isotropic wavelet coefficients (top panel) and the local degree of anisotropy (bottom panel) for maps containing random projections of ten 3D Gaussian rotational ellipsoids with sizes of σ = 3 × 3 × 27 pixels and σ = 3 × 27 × 27 pixels. The green line shows the result for a map consisting of ten 2D Gaussian ellipses with σ = 3 × 27 pixels.
Current usage metrics show cumulative count of Article Views (full-text article views including HTML views, PDF and ePub downloads, according to the available data) and Abstracts Views on Vision4Press platform.
Data correspond to usage on the plateform after 2015. The current usage metrics is available 48-96 hours after online publication and is updated daily on week days.
Initial download of the metrics may take a while.