Free Access
Fig. 3
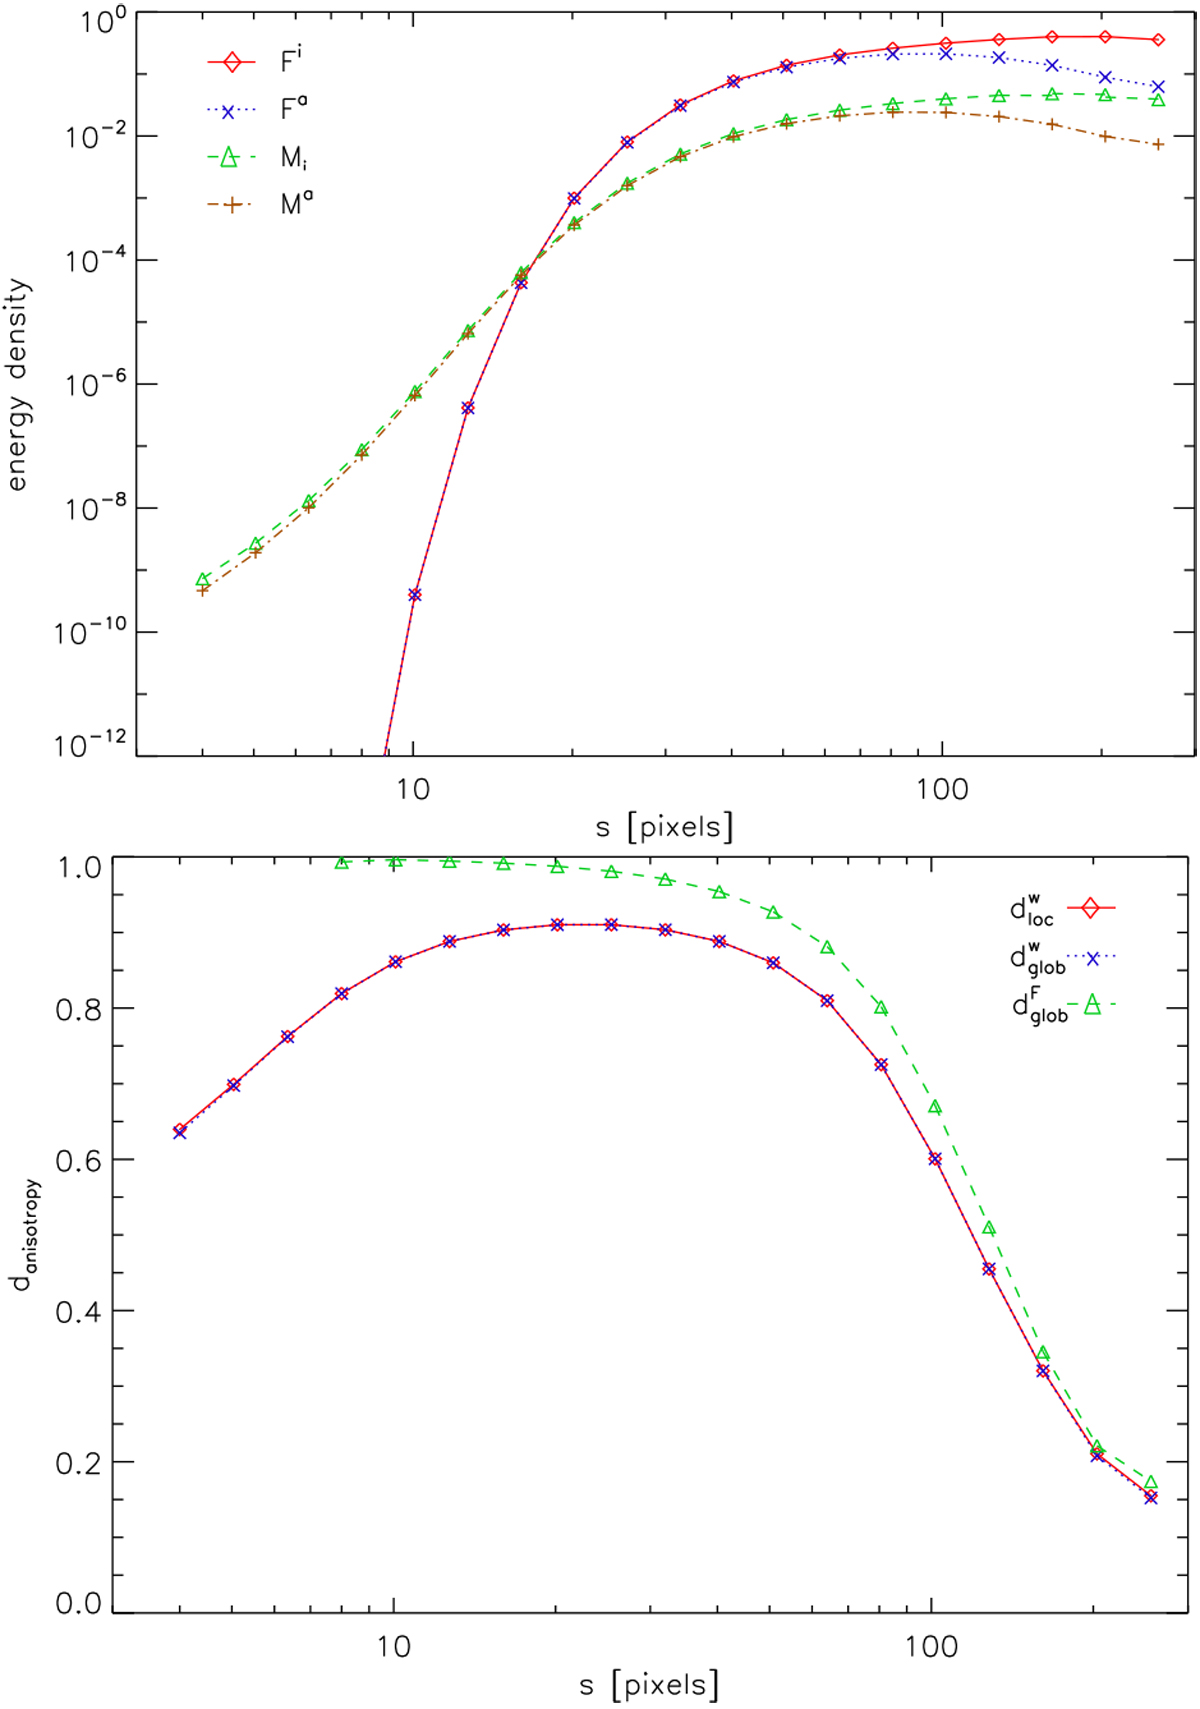
Anisotropic wavelet analysis for a map containing an anisotropic Gaussian clump with standard deviations of σa = 8 pixels, σc = 32 pixels. Top panel: isotropic and anisotropic wavelet and Fourier spectra. Bottom panel: resulting local and global degrees of anisotropy.
Current usage metrics show cumulative count of Article Views (full-text article views including HTML views, PDF and ePub downloads, according to the available data) and Abstracts Views on Vision4Press platform.
Data correspond to usage on the plateform after 2015. The current usage metrics is available 48-96 hours after online publication and is updated daily on week days.
Initial download of the metrics may take a while.