| Issue |
A&A
Volume 699, July 2025
|
|
|---|---|---|
| Article Number | A305 | |
| Number of page(s) | 24 | |
| Section | Interstellar and circumstellar matter | |
| DOI | https://doi.org/10.1051/0004-6361/202554862 | |
| Published online | 16 July 2025 | |
Tracing the ejecta structure of supernova 1987A: Insights and diagnostics from 3D magnetohydrodynamic simulations
1
INAF - Osservatorio Astronomico di Palermo, Piazza del Parlamento 1, 90134 Palermo, Italy
2
Dip. di Fisica e Chimica, Università degli Studi di Palermo, Piazza del Parlamento 1, 90134 Palermo, Italy
3
Institute of Astronomy and Astrophysics, Academia Sinica, No.1, Sec. 4, Roosevelt Road, Taipei 106319, Taiwan
4
Astrophysical Big Bang Laboratory (ABBL), RIKEN Pioneering Research Institute (PRI), 2-1 Hirosawa, Wako, Saitama 351-0198, Japan
5
RIKEN Center for Interdisciplinary Theoretical & Mathematical Sciences (iTHEMS), 2-1 Hirosawa, Wako, Saitama 351-0198, Japan
6
Astrophysical Big Bang Group (ABBG), Okinawa Institute of Science and Technology (OIST), 1919-1 Tancha, Onna-son, Kunigami-gun, Okinawa 904-0495, Japan
7
Departament d’Astonomia i Astrofísca, Universitat de València, 46100 Burjassot (València), Spain
8
Observatori Astronòmic, Universitat de València, 46980 Paterna, Spain
9
Université Paris-Saclay, Université Paris Cité, CEA, CNRS, AIM, 91191 Gif-sur-Yvette, France
10
Department of Astronomy, Kyoto University, Oiwake-cho, Kitashirakawa, Sakyo-ku, Kyoto 606-8502, Japan
11
Institute for Applied Problems in Mechanics and Mathematics, Naukova Str. 3-b, 79060 Lviv, Ukraine
12
School of Astronomy and Space Science, Nanjing University, 163 Xianlin Avenue, Nanjing 210023, China
★ Corresponding author: This email address is being protected from spambots. You need JavaScript enabled to view it.
Received:
29
March
2025
Accepted:
2
May
2025
Abstract
Context. Supernova (SN) 1987A provides a unique window into the aftermath of a massive stellar explosion, offering key insights into the ejecta’s morphology, composition, explosion mechanism, progenitor system, and circumstellar medium (CSM) interaction.
Aims. This study employs high-resolution three-dimensional magnetohydrodynamic (3D MHD) simulations to investigate large-scale ejecta asymmetries in SN 1987A. By comparing the simulations with JWST observations and making predictions for XRISM, we aim to refine our understanding of the explosion mechanism and the remnant’s evolution.
Methods. We performed 3D MHD simulations that trace the evolution of SN 1987A from the SN to its remnant, extending model predictions up to 5000 years into the future, while considering the Ni-bubble effects. We compared the simulation results with JWST observations and used them to predict XRISM spectra in order to provide a means of evaluating the accuracy of the modeled ejecta structure.
Results. Our simulations reproduce the large-scale Fe-rich ejecta morphology observed with JWST, revealing two prominent clumps suggestive of a bipolar explosion. The Ni-bubble effect in the first year enhances Fe-rich ejecta expansion, accelerating their interaction with the reverse shock. However, discrepancies with JWST observations in clump velocities and spatial distribution suggest stronger explosion asymmetries than modeled. According to the simulations, since 2021 the contribution of shocked ejecta to the X-ray emission has steadily increased; it now rivals that of the shocked CSM and is expected to soon dominate as the CSM emission continues to fade. Future XRISM observations will trace the evolution of these ejecta structures and help refine constraints on the explosion geometry. Early remnant asymmetries from CSM interaction may persist for at least 100 years.
Conclusions. Our findings reinforce the role of highly asymmetric core-collapse mechanisms in shaping SN 1987A’s ejecta and provide critical constraints on explosion geometry. Future studies should investigate more extreme explosion asymmetries, potentially arising from stochastic processes in neutrino-driven core collapse or magneto-rotational SN models in order to identify the mechanism that best explains SN 1987A’s nearly bipolar Fe-rich ejecta structure.
Key words: hydrodynamics / instabilities / shock waves / ISM: supernova remnants / supernovae: individual: SN 1987A / X-rays: ISM
© The Authors 2025
 Open Access article, published by EDP Sciences, under the terms of the Creative Commons Attribution License (https://creativecommons.org/licenses/by/4.0), which permits unrestricted use, distribution, and reproduction in any medium, provided the original work is properly cited.
This article is published in open access under the Subscribe to Open model. This email address is being protected from spambots. You need JavaScript enabled to view it. to support open access publication.
1 Introduction
Supernova (SN) 1987A is a unique laboratory, as it provides an unparalleled opportunity to study the connection between a massive progenitor star, its terminal SN explosion, and the subsequent evolution of the SN remnant (SNR) interacting with the surrounding circumstellar medium (CSM). Located in the Large Magellanic Cloud at a distance of ≈51.4 kpc (Panagia 1999) and monitored for nearly four decades (e.g., Sun et al. 2021; Ravi et al. 2024, and references therein), SN 1987A offers critical insights into the physics of core-collapse SNe, the mechanisms shaping their remnants, and the imprints of the progenitor star’s properties on these processes.
Distinct characteristics of SN 1987A are its highly asymmetric ejecta structure (e.g., Larsson et al. 2013, 2016) and its peculiar ring-like morphology observed across multiple wavelengths (e.g., Dwek et al. 2010; Larsson et al. 2011; Maggi et al. 2012; Helder et al. 2013). This morphology is widely attributed to the interaction of the expanding remnant with an inhomogeneous CSM (e.g., Chevalier & Dwarkadas 1995), making it a valuable probe of the progenitor’s mass-loss history. The presence of a characteristic triple-ring nebula (Crotts et al. 1989) and density variations in the surrounding medium suggest episodic, non-uniform mass loss, potentially linked to a binary merger scenario (e.g., Morris & Podsiadlowski 2007).
The unshocked ejecta, which have yet to encounter the reverse shock, provide direct insight into the explosion mechanism and progenitor structure. Observations of iron (Fe; e.g., Haas et al. 1990; Larsson et al. 2023) and titanium (Ti; e.g., Boggs et al. 2015) lines, as well as the elliptical distribution of the inner ejecta (Larsson et al. 2013, 2016) and molecular tracers such as CO and SiO (Abellán et al. 2017), indicate a highly anisotropic explosion, likely shaped by instabilities during core collapse. These features encode key information about explosion dynamics, including the standing accretion shock instability (SASI) and neutrino-driven convection (e.g., Blondin et al. 2003; Janka 2017a; Burrows & Vartanyan 2021; Orlando et al. 2025b). Conversely, shocked ejecta offer crucial insights into the remnant’s interaction with the inhomogeneous CSM and the structure of the outermost ejecta impacted by the reverse shock. This, in turn, provides key information on the progenitor star’s massloss history and its nature (e.g., Orlando et al. 2022, 2025a).
Advances in observational capabilities, particularly with the James Webb Space Telescope (JWST), are providing unprecedented insights into SN 1987A’s ejecta structure and composition. Recent findings have revealed a highly asymmetric [Fe I] distribution, resembling a broken dipole, with clumps moving at ~2300 km s-1 and Fe-rich ejecta interacting with the reverse shock (Larsson et al. 2023). The reverse shock, traced by HeI emission, forms a bubble-like structure with a ~45° half-opening angle. Imaging from the JWST Near Infrared Camera (NIRCam) has identified substructures within the ejecta (“the bar”), faint H2 crescents between the ejecta and the equatorial ring, and bright 3-5 μm continuum emission beyond the ring, driven by synchrotron radiation and dust (Matsuura et al. 2024). Additionally, JWST spectroscopy has detected blueshifted, spatially unresolved infrared emission lines of argon (Ar) and sulfur (S) from the innermost ejecta, which were likely ionized by a cooling neutron star or pulsar wind nebula, with a velocity shift suggestive of a potential neutron star natal kick (Fransson et al. 2024). Complementary observations with XRISM in the X-ray band have started to further constrain high-energy emission of SN 1987A and the interactions between the CSM and shocked ejecta (e.g., Sapienza et al. 2024a).
Interpreting these unprecedented high-quality data requires advanced modeling tools to extract key insights into the parent SN and progenitor star. Neutrino-driven SN explosions generally produce multi-polar asymmetries, but some may result in unipolar or strongly bipolar morphologies (e.g., Wongwathanarat et al. 2015; Bollig et al. 2021; Wang & Burrows 2024; Burrows et al. 2024), potentially explaining the features observed in SN 1987A, including the neutron star’s kick direction (Janka 2017b; Janka et al. 2017). In fact, the development of extended Ni-rich plumes can be influenced by progenitor characteristics, explosion energy, and stochastic processes, resulting in a wide range of ejecta structures. Other theoretical models propose bipolar or jet-like SN explosions driven by alternative mechanisms, including strong magnetic fields and rotation (e.g., Wheeler et al. 2002; Obergaulinger et al. 2006, 2009; Takiwaki et al. 2009; Mösta et al. 2014; Bear & Soker 2018; Soker 2024a,b). Some studies suggest that asymmetric, bipolar-like explosions can efficiently produce Ti at levels of ~10-4 M⊙ (Nagataki et al. 1997) and account for the high-velocity Fe component (~3000 km s-1) observed in SN 1987A (Colgan et al. 1994; Nagataki et al. 1998). On the other hand, comparable Ti yields and Fe ejecta velocities can also be obtained in simulations of neutrino-driven SN explosions (e.g., Utrobin et al. 2015, 2019, 2021; Sieverding et al. 2023; Wang & Burrows 2024). Additionally, the asymmetric Fe line profile in this remnant (Haas et al. 1990) has been linked to a bipolar explosion with asymmetry relative to the equatorial plane, offering a possible explanation for the neutron star’s kick direction (Nagataki 2000).
In more recent years, 3D magnetohydrodynamic (MHD) simulations have proven to be powerful tools for extracting information about the SN explosion and progenitor, and they have played a crucial role in interpreting multi-wavelength observations. These models have successfully reproduced key characteristics of SN 1987A, including: (i) the explosion’s asymmetries and energetics (Ono et al. 2020; Jerkstrand et al. 2020), as well as an estimate of the neutron star’s kick velocity, with the latter in good agreement with recent observations of the point source discovered in SN 1987A (Fransson et al. 2024); (ii) the signatures of the progenitor star on the remnant structure at the age of tens of years (Orlando et al. 2020, hereafter Paper I); (iii) the CSM’s structure (Orlando et al. 2015 and Paper I) and pre-SN magnetic field configuration (Orlando et al. 2019; Petruk et al. 2023); and (iv) non-thermal emission from a putative pulsar wind nebula embedded in cold, dense ejecta near the remnant’s center (Greco et al. 2021, 2022). An alternative scenario to the last point has been proposed by theoretical studies, suggesting that the infrared excess observed near the predicted position of the compact object in SN 1987A may be most plausibly attributed to thermal emission from a young, cooling neutron star (Page et al. 2020; Dohi et al. 2023). The 3D MHD simulations also predicted the current transition to a new evolutionary phase dominated by X-ray emission from shocked ejecta, a prediction recently confirmed by Chandra (Ravi et al. 2024) and XMM-Newton (Sun et al. 2025).
In this work, we expand on previous studies by investigating the complex ejecta structure of SN 1987A through 3D MHD simulations that reproduce most of its observable features. The inclusion of magnetic fields is crucial, as they play a key role in stabilizing the dense equatorial ring against complete disruption by hydrodynamic instabilities that develop at the ring’s boundary following the passage of the forward shock (Orlando et al. 2019). Our primary objective is to compare these models with recent JWST observations, identifying both consistencies and discrepancies that could highlight missing physical processes or provide new constraints on the progenitor SN and CSM properties. This analysis can be crucial for refining our understanding of the SN explosion mechanism and remnant evolution. We also provide detailed predictions for XRISM observations, focusing on the detectability of shocked ejecta and exploring ejecta diagnostics that will soon be testable with XRISM’s high spectral-resolution data. Finally, we investigate the future evolution of SN 1987A by examining whether signatures of its early interaction with a highly inhomogeneous CSM or evidence of an asymmetric explosion may still be observable in older remnants with similar characteristics.
The paper is organized as follows: In Sect. 2 we detail the numerical setup of our 3D MHD simulations; Sect. 3 presents simulation results and their comparison with observations; In Sect. 4, we discuss the implications of our findings and summarize key conclusions.
2 The 3D MHD model
The 3D MHD simulations of SN 1987A, which trace its evolution from the initial explosion to the formation of the SNR over 50 years, were extensively presented in Paper I. These simulations integrate 3D SN models (Ono et al. 2020) that capture the asymmetric explosion from core collapse to shock breakout at the stellar surface, with 3D MHD SNR simulations (e.g., Orlando et al. 2019) that follow the subsequent evolution and interaction with an inhomogeneous CSM. Key physical processes, including the mixing and clumping of chemically homogeneous ejecta layers, their interaction with the structured CSM, and the transition from the SN to the SNR phase, were carefully modeled. Synthetic observables enabled direct comparisons with observations, constraining the explosion dynamics, CSM structure, and progenitor properties
In this paper, we extended the simulations up to an age of 5000 years, providing predictions for the long-term evolution of SN 1987A. Rather than serving as a direct template for future observations of SN 1987A (which will be conducted with much more different observational capabilities), this analysis aims to explore features that may be visible today in other, more evolved remnants shaped by a CSM similar to that of SN 1987A. We also investigated the impact of the “Ni-bubble effect” (Herant & Benz 1992; which was not considered in our previous SN 1987A simulations), driven by the radioactive decay of nickel (Ni) synthesized during the explosion (see Orlando et al. 2021), on the remnant’s dynamics. Below, we summarize the key components and physical processes incorporated into our model. For further details on the underlying physics and numerical implementation, we refer the reader to Paper I.
2.1 Pre-supernova models
The progenitor of SN 1987A, Sanduleak (Sk) -69°202, was a blue supergiant (BSG) with an initial mass of approximately 20 M⊙. In Paper I, we investigated three pre-SN models to explore the evolution of SN 1987A: (i) a 16.3 M⊙ BSG evolved as a single star with a compact hydrogen (H) envelope and a helium (He) core mass consistent with Sk -69°202 (model N16.3; Nomoto & Hashimoto 1988); (ii) a 18.3 M⊙ BSG resulting from the merger of two massive stars with masses of 14 M⊙ and 9 M⊙, respectively (model B18.3; Urushibata et al. 2018); (iii) a 19.8 M⊙ red supergiant (RSG) with an extended H envelope (model S19.8; Sukhbold et al. 2018), representing a progenitor with a structure in the He shell and H envelope significantly different from that of a BSG. This latter model was considered to test whether the imprint of the progenitor star can be identified in the structure of the SNR.
The analysis presented in Ono et al. (2020) and Paper I demonstrated that the merger model B18.3 best reproduces the observed properties of the remnant of SN 1987A. Specifically, the remnant originating from this model most accurately matches the broadening and Doppler shifts of Fe (Haas et al. 1990) and Ti (Boggs et al. 2015) lines observed in the years following the SN explosion. These spectral features provide critical insights into the dynamics of the ejecta and the asymmetries introduced during the explosion (Jerkstrand et al. 2020). Based on these findings, we focused exclusively on the B18.3 model in the present study.
2.2 Modeling the supernova evolution
The SN phase was modeled using the FLASH hydrodynamic code (Fryxell et al. 2000) on a 3D Cartesian grid (see Ono et al. 2020 for details). The simulations employed the pre-SN models described in Sect. 2.1 at the time of core-collapse as initial conditions and considered key physical processes, including gravity (both self-gravity and the gravitational influence of the proto-neutron star), fallback of material onto the protoneutron star, and a nuclear reaction network with 19 species (neutrons, protons, 1H, 3He, 4He, 12C, 14N, 16O, 20Ne, 24Mg, 28Si, 32S, 36Ar, 40Ca, 44Ti, 48Cr, 52Fe, 54Fe, and 56Ni) to track nucleosynthesis. The model also accounted for the feedback of nuclear energy generation and the energy deposition from the radioactive decay of 56Ni synthesized in the explosion. The equation of state was tailored to different physical regimes: the Helmholtz equation of state (Timmes & Swesty 2000) was applied in early phases characterized by high densities and temperatures, while a radiation and ideal gas equation of state was used for later phases (Ono et al. 2013).
The explosion was initiated by injecting thermal and kinetic energy near the interface between the Fe core and silicon (Si) layer. Asymmetries were introduced to emulate anisotropic mechanisms such as the standing accretion shock instability (SASI; Blondin et al. 2003), magnetic jet-driven explosions (Khokhlov et al. 1999; Obergaulinger & Aloy 2020, 2021), or single-lobe SN geometries (Hungerford et al. 2005). Different asymmetry configurations, explored in Ono et al. (2020), were implemented by modulating the initial radial velocity distribution and introducing perturbations. The study demonstrated that a bipolar-like explosion with asymmetry across the equatorial plane (resulting in greater energy release on one side) and a total energy of 2 × 1051 erg (see Table 1 in Paper I) best reproduced the observed shifts and broadening of Fe lines 1-2 years post-core collapse, aligning with the elliptical morphology of the inner ejecta distribution in SN 1987A (Larsson et al. 2013, 2016, 2023).
To resolve the large spatial scales associated with the remnant expansion, a mesh strategy analogous to that employed by Ono et al. (2013) was adopted. The initial computational domain spanned -5000 to 5000 km in the x, y, and z directions, centered on the SN origin, and encompassed the oxygen-rich (O) layer of the progenitor star. The simulations employed adaptive mesh refinement (AMR; MacNeice et al. 2000) to achieve a maximum resolution of ~10 km. As the forward shock approached the domain boundaries, the computational domain was dynamically extended by a factor of 1.2 in all directions, with physical quantities re-mapped onto the new domain and the extended regions initialized to pre-SN conditions. This strategy required approximately 75 re-mappings to track the shock wave propagation through the star and its breakout at the stellar surface, occurring about 20 hours after core collapse. The final domain extended from -2 × 10¹⁴ to 2 × 1014 cm in all directions, with a finest spatial resolution of 2 × 1011 cm.
2.3 Modeling the transition to the SNR phase
The output of the SN simulations, approximately 20 hours after core collapse, was used as the initial condition for 3D MHD simulations of the blast wave interacting with the ambient medium. The numerical setup is described in Paper I. The time-dependent MHD equations for mass, momentum, energy, and magnetic flux conservation are solved using the PLUTO code (Mignone et al. 2007, 2012). The simulations account for deviations from electron-ion temperature equilibration, departures from ionization equilibrium (Orlando et al. 2015), and the chemical evolution of the ejecta using a multi-fluid approach (Orlando et al. 2016). Each fluid tracked a specific species from the SN simulations, while the adopted CSM abundances are those derived from the analysis of X-ray observations (Zhekov et al. 2009).
In addition to the simulations presented in Paper I, a new model (B18.3-Dec; see Table 1) was introduced, based on the setup of model B18.3 presented in Paper I but including energy deposition from the radioactive decay chain 56Ni → 56Co → 56Fe. The decay energy was treated as a local energy source, neglecting neutrino contributions and assuming no γ-ray leakage from the inner part of the remnant (see Orlando et al. 2021 for the details of the implementation).
The adopted CSM model reproduces the highly inhomogeneous triple-ring nebula with its characteristic hourglass shape, as revealed by multiwavelength observations (e.g., Sugerman et al. 2005). Specifically, in the immediate surrounding of the progenitor star (r < 0.08 pc), the CSM was modeled as a spherically symmetric stellar wind with a density profile ∝ r-2, a mass-loss rate Ṁw = 10-7 M⊙ yr-1, and a velocity uw = 500 km s-1 (Morris & Podsiadlowski 2007). Although the CSM structure in the vicinity of the progenitor may, in reality, be more complex, we assumed spherical symmetry. This simplification is justified, as any asymmetries in the tenuous wind at these small scales would have negligible effects on the blast wave dynamics, which remains in the free-expansion phase. At a distance of rHII = 0.08 pc in the equatorial plane, the wind interacts with a nebula consisting of an H II region, a dense equatorial ring, and two less dense polar (outer) rings (Chevalier & Dwarkadas 1995; Sugerman et al. 2005; see also Fig. 1 in Orlando et al. 2015). This CSM component plays a crucial role in the subsequent evolution of the remnant and in shaping its morphology. The equatorial ring contained both a smooth component and high-density clumps, whose parameters were explored around fiducial values from Orlando et al. (2015). Following Sugerman et al. (2005), the polar rings are described as inward-pointing spurs with a density comparable to that of the H II region, located 1.2 × 1018 cm above and below the equatorial plane. This places the innermost regions of the outer rings approximately 1.7 × 1018 cm from the explosion center, consistent with optical observations (Tziamtzis et al. 2011). The density of the H II region declines as r-2 for distances greater than ≈2.2 × 1018 cm. The parameters of the CSM adopted for models B18.3 and B18.3-Dec are the same and are summarized in Table 2 in Paper I. Passive tracers were used to track the evolution of ejecta, H II region, and ring material, as well as shock properties required for synthesizing multi-wavelength emission.
As demonstrated by Orlando et al. (2019), the magnetic field plays a crucial role in the evolution of SN 1987A, particularly in the dynamics of the dense equatorial ring. Specifically, the magnetic field that envelops the ring after the passage of the forward shock serves to limit the growth of Kelvin-Helmholtz instabilities at the ring’s boundary. Since these instabilities are responsible for the fragmentation and eventual destruction of the ring, the presence of the magnetic field allows the ring to persist for a longer duration. Following Orlando et al. (2019), the ambient magnetic field was modeled as a Parker spiral (Parker 1958), with a strength of B ≈ 1 μG at the inner edge of the nebula (rHII = 0.08 pc), consistent with observations (Zanardo et al. 2018). This field stabilizes CSM inhomogeneities (e.g., the clumpy equatorial ring) by suppressing hydrodynamic instabilities that would develop at their boundaries (Orlando et al. 2008), without significantly altering the blast wave evolution.
Following the approach used in the SN model (Ono et al. 2020), a re-mapping technique was employed to track the expansion of the SNR. The initial computational domain spanned 6 × 1014 cm in all directions, consisting of two regions: a uniform high-resolution grid (5123 zones) focused on the metal-rich ejecta and a non-uniform grid (with an additional 768 zones per direction) covering the remaining domain. This setup provided resolutions ranging from ≈2.9 × 1011 cm to ≈5.8 × 1011 cm. As the shock expanded, the domain was iteratively extended, remapping physical quantities to the new grid. In Paper I, over 50 years of evolution, approximately 49 re-mappings were performed, resulting in a final domain of 2.6 × 1018 cm and a spatial resolution of ≈1.3 × 1015 cm in the remnant interior. In the present study, we extended simulations B18.3 and B18.3-Dec to 5000 years post-SN, when the remnant reaches a radius of 13 pc, and performed 70 re-mappings. Boundary conditions were maintained at pre-SN CSM values throughout the evolution.
Setup for the simulated models.
2.4 Synthesis of X-ray emission
From the model results, we synthesized the thermal X-ray emission produced by the interaction of the blast wave with the surrounding nebula, following the approach described in previous studies (Orlando et al. 2015, 2024a; Miceli et al. 2019). In the original simulation domain, the dense equatorial ring lies in the [x, y] plane. To align the ring’s orientation with that observed in SN 1987A, as inferred from optical observations (Sugerman et al. 2005), we rotated the domain around the three axes by ix = 41°, iy = -8°, and iz = -9°. After applying these rotations, the symmetry axis of the bipolar explosion is oriented at an angle of 40° from the line of sight (LoS), consistent with the propagation direction of two Ni-rich clumps ejected during the explosion (e.g., Utrobin et al. 1995; Nagataki et al. 1997; Nagataki 2000). These clumps move in opposite directions at angles ranging from 31° and 45° from the LoS (e.g., Utrobin et al. 1995; Wang et al. 2002). In this configuration, the observer’s LoS corresponds to the negative y-axis, ensuring a consistent perspective with the observed morphology and kinematics of the system (see Fig. 9 in Orlando et al. 2020).
For each cell in the spatial domain, we calculated key physical properties relevant to the X-ray emission. The maximum ionization age is given by τj = ne,jΔtj, where ne,j is the electron number density and Δtj is the time elapsed since the plasma in the cell was shocked. The emission measure is defined as EMj = ne,jnZ,jVj, where nZ,j is the ion number density and Vj is the cell volume. The electron temperature, Te,j, is initially set to kT = 0.3 keV at the shock front due to instantaneous heating by lower hybrid waves (Ghavamian et al. 2007; Orlando et al. 2015) and is subsequently determined based on the ion temperature, plasma density, and Δtj, assuming Coulomb collisions.
The X-ray emission in the [0.1, 10] keV band was synthesized based on the values of τj, EMj, and Tej, assuming a source distance of D = 51.4 kpc (Panagia 1999). We employed the non-equilibrium ionization (NEI) emission model VPSHOCK, available in the XSPEC package, using atomic data from ATOMDB (Smith et al. 2001). In this way, the final ion fraction distribution per species comes out as a result from the XSPEC model. Metal abundances for the CSM were taken from deep Chandra observations of SN 1987A (Zhekov et al. 2009), while those for the ejecta were derived from the simulated evolution of the post-core-collapse ejecta. To account for interstellar photoelectric absorption, we applied a column density of NH = 2.35 × 1021 cm-2 (Park et al. 2006) to the X-ray spectrum from each computational cell. The spectra were then convolved with the instrumental response of XRISM Resolve for a comparison with new observations collected with this instrument1.
3 Results
A detailed description of the evolution from the SN event to the fully developed remnant at 50 years is provided in two previous studies. Ono et al. (2020) analyzed the SN blast wave’s evolution, from shock revival to breakout, exploring progenitor models (Sect. 2.1) and parameterizing an aspherical, bipolar SN explosion. Our study identified a binary merger progenitor (Urushibata et al. 2018) with an asymmetric, highly collimated explosion as the best match to observations, particularly in reproducing the [Fe II] line profiles detected 1-2 years after the SN and the 56Ni mass, providing insights into the explosion mechanism and progenitor’s final stages.
In Paper I, we extended the blast wave evolution to 50 years, tracing its transition to the SNR phase as it interacts with the inhomogeneous CSM. By exploring SNR models and progenitor scenarios, we identified a CSM configuration that best matches key observables. Our preferred model (B18.3; Table 1) reproduces the 44Ti decay line profile observed by NuSTAR ~25 years after the SN (Boggs et al. 2015), and the spatial distribution of SiO and CO (ALMA; Abellán et al. 2017). Molecular formation calculations (Ono et al. 2024) based on the B18.3 model (b18.3-high; Ono et al. 2020) further support the consistency with observations. The model also matches the remnant’s X-ray morphology, light curves, and spectra from 1990 to 2016 (Haberl et al. 2006; Maggi et al. 2012; Helder et al. 2013; Frank et al. 2016), which helped reconstruct the CSM structure, determine the optimal bipolar explosion orientation with respect to the LoS, and reinforce the binary merger scenario as the most consistent progenitor model.
Although model B18.3 was constrained using observations collected before 2016, it has accurately predicted the subsequent remnant’s X-ray evolution. It reproduced the soft and hard X-ray light curves up to the present day and captured changes in the expansion rate as the blast wave interacts with the inhomogeneous CSM (Sun et al. 2021; Ravi et al. 2021, 2024). Notably, it also anticipated the emergence of dominant emission from the outermost shocked ejecta around 2021, a prediction recently confirmed by XMM-Newton (Sun et al. 2025) observations.
Here, we investigate the structure of both unshocked and shocked ejecta in SN 1987A, evaluating the impact of Ni-bubble effects, by comparing our preferred SNR models (B18.3 and B18.3-Dec) with recent JWST observations to identify potential discrepancies. Identifying mismatches between simulations and observations will guide improvements in the model, shedding light on potentially overlooked physics and enabling a more accurate reconstruction of the remnant’s structure, dynamics, and underlying processes. Additionally, we make predictions for XRISM observations, evaluating the detectability of shocked ejecta and outlining key ejecta diagnostics that will soon be testable with XRISM’s high spectral-resolution data. Finally, we provide predictions for the remnant’s future evolution, offering insights into its long-term behavior and evolution over the coming millennia. These predictions may help identify features in present-day evolved remnants that reveal early interactions with an inhomogeneous CSM similar to that of SN 1987A.
3.1 Impact of Ni-bubble on the ejecta properties
As an initial step, we explored the impact of the Ni-bubble effect on the dynamical evolution of the ejecta (see also Gabler et al. 2021). In model B18.3, the ejecta are characterized by an extended H and He envelope, with the large-scale asymmetry of the bipolar SN explosion reflected in the distribution of innermost metal-rich ejecta. Notably, the Fe-rich ejecta exhibit a distinctive morphology, with two prominent clumps: one propagating northward toward the observer and the other moving southward, away from the observer (see Fig. 4 in Paper I). These structures result from the explosion geometry and the subsequent hydrodynamic interactions, which shape the overall ejecta distribution.
To assess potential signatures of the Ni-bubble effect, we analyzed the mass of shocked species composing the ejecta over time relative to the mass of shocked CSM, considering contributions from both the H II region and the equatorial ring. Figure 1 shows the evolution of shocked ejecta mass for various chemical species during the first 50 years post-explosion, as predicted by models B18.3 (upper panel) and B18.3-Dec (lower panel). The black solid, dashed, and dotted lines represent the total shocked ejecta mass, the shocked CSM mass (including the H II region and the rings), and the mass of shocked material from the equatorial ring, respectively.
The evolution of shocked material in both models follows three distinct phases (also discussed in Paper I). During the first ~2-3 years post-explosion, most of the shocked material originates from the outermost ejecta, which expand nearly freely through the low-density wind of the BSG progenitor. In this phase, the effects of the Ni-bubble manifest primarily in the unshocked ejecta, while the outermost ejecta remain largely unaffected. This is driven by the inflation of initially Ni-rich material due to local energy deposition from the radioactive decay of 56Ni to 56Co, and subsequently to 56Fe (see Orlando et al. 2021; Gabler et al. 2021 for a detailed discussion of the effects of Ni-bubble). As a result, the Fe-rich ejecta in model B18.3-Dec appear more extended than in model B18.3, while the outermost ejecta layers remain essentially unchanged from those in model B18.3. This additional expansion in model B18.3-Dec displaces the surrounding ejecta enriched in heavy and intermediate-mass elements, eventually promoting mixing between chemically distinct layers and leading to a more complex and stratified structure in the innermost regions of the remnant. Approximately one year after shock breakout, the energy input from radioactive decay becomes negligible, and the ejecta in both models continue to expand ballistically.
The second phase begins when the SN blast wave encounters the surrounding H II region, leading to a rapid increase in shocked CSM mass, which dominates until ~30 years (see dashed line in Fig. 1). During this period, the shocked equatorial ring plays a key role in maintaining a higher total shocked CSM mass than shocked ejecta (as indicated by the dashed line exceeding the solid line in the figure). The third phase, starting around 2018 according to our models, sees the shocked ejecta mass surpass the shocked CSM, becoming the dominant component. This transition aligns with the findings from the analysis of synthetic X-ray light curves based on model B18.3 in Paper I and is further supported by the comparison between synthetic and observed X-ray light curves (Ravi et al. 2024) and from the analysis of the distribution of emission measure inferred from XMM-Newton observations (Sun et al. 2025).
The colors in Fig. 1 represent the chemical composition of the shocked ejecta. As expected, H and He dominate during the whole evolution, originating from the outermost progenitor layers interacting with the reverse shock. This is consistent with the presence of a massive H and He envelope in the progenitor of SN 1987A (see Urushibata et al. 2018; Ono et al. 2020). Over time, the shocked ejecta become increasingly enriched in intermediate-mass and Fe-group elements as deeper layers are processed by the reverse shock.
The impact of the Ni-bubble effect is most evident in the evolution of shocked Fe (see Fig. 1). While the evolution of other species remains largely similar between the two models, the interaction of pure Fe ejecta with the reverse shock progresses at different rates in the two models. In model B18.3-Dec, the mass of shocked Fe begins to rise sharply at 38 years (2025), while in model B18.3, this increase is delayed until 41 years (2028) and occurs more gradually. This sharp rise marks the moment when the bulk of the pure Fe-rich ejecta, concentrated in the two clumps propagating in opposite directions, encounters the reverse shock, leading to enhanced mixing with other species.
We further investigated the impact of the Ni-bubble effect on the dynamics of the ejecta by analyzing the asymmetries in the LoS velocity distributions of various species, and computing their mass distributions as a function of LoS velocity. Figure 2 shows these distributions for models B18.3 and B18.3-Dec at a remnant age of 37 years (2024), the first epoch observed with XRISM (OBS ID 300021010). However, we found that the profiles remain largely consistent in the near future, indicating that the analysis is applicable to ejecta observed from 2024 through 2037. In the figure, DMi represents the mass of the i-th element within the velocity range [u; u + Δu], normalized by the total mass Mi of that element. The velocity bins are 200 km s-1 wide, providing a detailed view of the velocity distribution across the remnant.
The upper panels of Fig. 2 show that, in both models, light elements (H, He, and N) maintain mass-weighted average LoS velocities near zero across the entire remnant. Their LoS velocity distributions are broad, with ejecta containing more than 50% of the peak mass fraction spanning from approximately -2000 to 2Οθ0 km s-1, and extending to even higher velocities in the wings. This behavior is consistent with the location of these light elements in the outermost ejecta layers, which are relatively unaffected by the asymmetries induced by the explosion.
For intermediate-mass elements (C, O, Ne, Ar, Mg, S, and Si) and heavier elements (Cr, Ca, Ti, and Fe), a slight redshift is seen in the mass-weighted average LoS velocities. These elements exhibit mass-weighted average velocities ranging from ~300 km s-1 for intermediate-mass elements to ~500 km s-1 for heavier elements. Their velocity distributions show a moderate spread, generally between -1000 and 1500 km s-1. A key distinction between the models lies in the shape of these velocity distributions. In model B18.3, two distinct peaks (one redshifted and one blueshifted) are present, whereas in model B18.3-Dec, these peaks merge into a single dominant redshifted peak. The peaks in B18.3 arise from the two Fe-rich ejecta clumps formed by the bipolar explosion (see Fig. 4 in Paper I) and influencing the surrounding ejecta layers. In contrast, the Ni-bubble effect in model B18.3-Dec enhances the expansion of these Fe-rich clumps, leading to their partial merging and resulting in a broader redshifted peak in the velocity distribution.
A more detailed analysis of the northern and southern hemispheres (middle and lower panels in Fig. 2) reveals that the light elements (H, He, and N) show no significant hemispheric asymmetry, as their velocity distributions remain broad and centered around zero. In contrast, intermediate-mass elements (C, O, Ne, Ar, Mg, S, and Si) exhibit predominantly redshifted distributions in both hemispheres, except for Ar (and marginally S and Si) in model B18.3, which is blueshifted in the northern hemisphere. The mass-weighted velocities of these elements are approximately 300 km s-1 in the northern hemisphere, while in the southern hemisphere, they reach values up to 1000 km s-1.
The behavior of heavy elements (Cr, Ca, Ti, and Fe) is more striking, as they exhibit a clear hemispheric asymmetry. In the northern hemisphere, these elements are predominantly blueshifted, with velocities ranging from -500 to -1000 km s-1, while in the southern hemisphere, they are redshifted, with velocities ranging from 1000 to 1500 km s-1. This pronounced asymmetry highlights the significant role of explosion-induced asymmetries (likely tied to the explosion mechanism itself) in driving the expansion of Fe-rich ejecta and shaping the surrounding layers. The impact of the Ni-bubble effect is most evident in the broader distribution of the mass fractions of these species across LoS velocities. This results in the merging of the two distinct peaks observed in model B18.3 into a single dominant redshifted peak in model B18.3-Dec, further emphasizing the influence of the Ni-bubble on the remnant’s dynamical evolution.
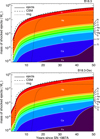 |
Fig. 1 Evolution of the shocked ejecta mass (in units of M⊙) in log scale for various species as derived from models B18.3 (top panel) and B18.3-Dec (bottom). Different colors represent specific elements, as indicated by the labels. The black solid, dashed, and dotted lines represent the total shocked ejecta mass, the shocked CSM mass (including the H II region and the rings), and the mass of shocked material from the equatorial ring, respectively. Due to their low mass content, Ar, Cr, and Ti are barely visible in the figure. |
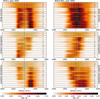 |
Fig. 2 Mass distributions of ejecta species as a function of LoS velocity, derived from models B18.3 (left panels) and B18.3-Dec (right panels) at a remnant age of 37 years (2024). The color bars at the bottom of the figure correspond to their respective columns and are specific to the model represented in each column. The upper panels show the velocity distributions across the entire remnant, while the middle and lower panels correspond to the northern and southern hemispheres, respectively. Crosses mark the mass-weighted average LoS velocity for each species, while the horizontal lines indicate the velocity range where the ejecta mass fraction exceeds 50% of the peak mass fraction. |
3.2 Unshocked ejecta: Comparison with JWST data
The primary interest in the unshocked ejecta lies in their potential to preserve signatures of the physical processes that governed the SN explosion. Identifying these signatures is essential for constraining the explosion mechanism (e.g., Orlando et al. 2025b). Recent JWST observations of SN 1987A provide valuable insights into the properties and spatial distribution of the ejecta. A comparison with our models can further clarify the asymmetries present at the onset of the explosion, offering a deeper understanding of the underlying dynamics.
Figure 3 compares deep near-infrared imaging of SN 1987A obtained with JWST/NIRCam on September 1-2, 2022 (Matsuura et al. 2024), with 3D volumetric renderings of the density distribution of shocked plasma, as well as the unshocked Fe-rich ejecta, predicted by the two models in Table 1, as of February 20232. The upper panels provide an unobstructed comparison between models and observations. The lower panels show the same images with identical ellipsoids overlaid, providing a common reference frame to facilitate the comparison of the remnant’s large-scale morphology between the JWST observations and the simulations. The dashed line at the center of the remnant indicates the approximate projected inclination of the elongated distribution of the inner ejecta, which is visible in cyan in the JWST image.
It is important to note that while the model-derived images combine the distributions of shocked plasma and unshocked Fe-rich ejecta to create an analog of the JWST observations (left panels of Fig. 3), they are not intended to precisely replicate the observational data. Instead, these images illustrate the remnant’s structure and emphasize key morphological features. A direct match between model-derived images and observations would require detailed emission modeling in the specific bands observed by JWST. For example, the infrared image exhibits a “halo” around the brightest structures due to radiative ionization from photons, an effect not accounted for in the sharp density maps. Incorporating such a halo around density structures could make the model images appear more extended and better resemble the observations. Despite this limitation, the strong similarity between the model-derived images and JWST observations underscores the model’s ability to reproduce the global structure and dimensions of the remnant, capturing many of the key features observed in SN 1987A.
However, as discussed below, some discrepancies remain between the models and observations, highlighting the need for further refinements to achieve a better match. The remnant’s morphology is dominated by the bright, shocked equatorial ring, which appears in projection as a slightly inclined, clumpy ellipsoid. Observations indicate that the ring is more radially extended than predicted by the models, likely due to the sharper appearance of the density maps, as discussed above. Additionally, JWST observations have revealed the emergence of new bright knots (e.g., Matsuura et al. 2024) that are not present in the models. These structures likely form as the blast wave propagates through the CSM, unveiling previously undetectable inhomogeneities (and, therefore, not included in the model developed before these observations). Their appearance suggests that the CSM is more complex than currently modeled, possibly containing finer-scale density variations or unresolved clumps that can influence the remnant’s evolution and emission properties.
The models successfully reproduce the diffuse emission observed beyond the equatorial ring, as indicated by the largest ellipsoid in Fig. 3. This emission appears more elongated in the north-south direction, consistent with the blast wave propagating through the hourglass-shaped cavity carved by the fast wind from the BSG progenitor. However, differences in the fine structure and distribution of the shocked material suggest that additional physical processes, such as small-scale instabilities or variations in the CSM, may play a role in shaping the observed remnant.
The most striking discrepancies between the models and observations arise in the distribution of the innermost ejecta, which are rich in heavy elements such as Si, S, Ti, and Fe. In the models, these ejecta exhibit an elongated morphology, consistent with the observed structure in SN 1987A, as a consequence of the bipolar explosion implemented in the SN model. As expected, the structure of the innermost Fe-rich ejecta differs depending on whether Ni-bubble effects are considered during the first year of evolution. In model B18.3-Dec (right column in Fig. 3), the Fe-rich ejecta appear more expanded than in model B18.3 (center column), reflecting the additional pressure-driven expansion induced by the decay of radioactive 56Ni (see also Gabler et al. 2021).
The orientation of the modeled elongated ejecta also aligns well with observations (see the reference dashed line at the center of the lower panels in Fig. 3). However, the modeled metal-rich ejecta appear significantly less extended than those observed (compare the modeled distributions with the observed one in the left column of the figure). This discrepancy is evident even in model B18.3-Dec, suggesting that Ni-bubble effects alone cannot account for the observed degree of expansion. Additional factors, such as a more pronounced asymmetry in the SN explosion, may help produce the observed ejecta distribution.
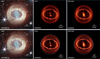 |
Fig. 3 Upper panels: Comparison between JWST observations of SN 1987A from September 1-2, 2022 (left column), and the density distribution of the remnant-including both shocked plasma and unshocked Fe-rich ejecta-predicted by models B18.3 (Paper I; center column) and B18.3-Dec (right column) as of February 2023. Lower panels: Same as the upper panels but with identical ellipsoids overlaid on all images as a reference for comparing the large-scale morphology of the remnant across observations and models. The dashed line at the remnant’s center marks the approximate orientation of the homunculus’ major axis. While the model-generated images reproduce the general structure of the remnant, they are not intended to exactly match the observed appearance. The original JWST image was created by Alyssa Pagan (STScI), and the image credits belong to NASA, ESA, CSA, Mikako Matsuura (Cardiff University), Richard Arendt (NASA-GSFC, UMBC), Claes Fransson (Stockholm University), and Josefin Larsson (KTH). |
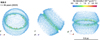 |
Fig. 4 Three-dimensional volume rendering of He-rich ejecta near the reverse shock, with opacity scaled to reflect density variations, shown from different viewing angles. The visualization is based on model B18.3 at t = 36 years after the SN (corresponding to February 2023). The color bar in the upper right indicates the He density. The blue circle indicates the nominal position of the equatorial ring. Earth’s vantage point corresponds to the negative y-axis. |
3.2.1 3D structure of reverse shock and Fe-rich ejecta
The structure of the innermost ejecta as observed with JWST was extensively analyzed by Larsson et al. (2023), who reconstructed 3D emissivity maps of the [Fe I] 1.443 μm and He I 1.083 μm line. Their study revealed a highly asymmetric distribution of Fe-rich material, characterized by a distinct broken-dipole morphology. More specifically, the ejecta structure is dominated by two large, spatially separated clumps of Fe-rich ejecta expanding at velocities of approximately 2300 km s-1, highlighting significant deviations from spherical symmetry (see Fig. 3 in Larsson et al. 2023). These findings provide crucial constraints on the explosion geometry and suggest that the metal-rich ejecta experienced strong directional asymmetries during the SN event.
The distribution of Fe-rich ejecta in relation to the reverse shock in our models is shown in Figs. 4 and 5. The reverse shock’s morphology is inferred from the distribution of freshly shocked He-rich ejecta (see Fig. 4). We found that both models analyzed exhibit the same overall structure of the reverse shock, as shown in the figure for model B18.3. This similarity arises because the Ni-bubble effects do not significantly impact the dynamics of the outermost ejecta, particularly the H and He envelope interacting with the reverse shock at the time of the JWST observations. Interestingly, the modeled structure of the reverse shock closely resembles that reconstructed from the analysis of He I 1.083 μm emission in JWST data (compare Fig. 4 with Fig. 6 in Larsson et al. 2023).
The reverse shock is only partially visible in Fig. 4, extending up to latitudes of approximately 45° above and below the equatorial ring, with the He density gradually decreasing toward higher latitudes. According to our models, the visibility of the reverse shock depends on the density of the shocked ejecta. In polar directions, where the blast wave expands almost freely through the tenuous wind of the BSG progenitor, the reverse shock penetrates less into the ejecta, affecting lower-density regions. As a result, it is less prominent in these directions. In contrast, the reverse shock is most evident in regions where the forward shock propagates through the H II region. Consequently, the overall geometry of the reverse shock is nearly spherical, except in regions where the forward shock expands rapidly at the poles, resulting in a lack of visible structure, and in a bottleneck feature at the interaction site with the dense equatorial ring. In this region, the reverse shock appears more recessed due to the remnant’s interaction with the ring, while the He density is enhanced by the strong reflected shock (see Fig. 4). We conclude that the similar morphology of the reverse shock observed in JWST data provides direct evidence of interaction with aCSM whose geometry and density distribution closely match the predictions of our models.
Figure 5 illustrates the distribution of Fe-rich ejecta in relation to the reverse shock and the equatorial ring for the two models analyzed. As discussed above, model B18.3 predicts the presence of two distinct Fe-rich clumps resulting from the bipolar explosion (see upper panels in Fig. 5), while model B18.3-Dec predicts a continuous, elongated structure formed by the merging of the original Fe-rich clumps (lower panels in the figure). The position and propagation direction of these structures show a rough agreement with observations. However, the modeled Fe-rich ejecta appear more interior to the remnant than observed, suggesting that additional factors should be considered. For instance, the explosion asymmetry in the model may not be sufficient to fully reproduce the large-scale asymmetry observed in SN 1987A. Other potential contributors to this discrepancy include the structure of the progenitor star at the time of collapse or the degree of mixing and clumping in the ejecta, which affects their expansion and deceleration.
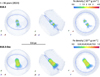 |
Fig. 5 Three-dimensional volume rendering of Fe-rich ejecta, with opacity scaled to reflect density variations, shown from different viewing angles. The visualization is based on model B18.3 (upper panels) and B18.3-Dec (lower panels) at t = 36 years after the SN (corresponding to February 2023). The color bars on the right indicate the Fe density for each case. The blue circle marks the nominal position of the equatorial ring, while the semi-transparent diffuse structure represents the distribution of He-rich ejecta near the reverse shock, as shown in Fig. 4. Earth’s vantage point corresponds to the negative y-axis. |
3.2.2 Dynamical properties of Fe-rich ejecta
The analysis of the dynamical properties of shocked ejecta presented in Sect. 3.1 has revealed significant asymmetries in the velocity distributions of metal-rich ejecta. Similar asymmetries are expected in the unshocked ejecta. To investigate these and enable a more quantitative comparison with JWST observations, we adopted a method that allows for a direct comparison between the model predictions and the observational data. Specifically, we generated column density maps of the modeled Fe-rich ejecta as a function of Doppler shift, providing a detailed visualization of the ejecta’s distribution in velocity space. This allows for a direct comparison with the observational data, presented in an analogous format (e.g., Fig. 3 in Larsson et al. 2023).
Figures 6 and 7 present the distributions of Fe-rich ejecta from models B18.3 and B18.3-Dec, respectively, as a function of velocity along the y-axis, which corresponds to the LoS velocity. Negative values indicate blueshifted material (approaching the observer), while positive values correspond to redshifted material (receding from the observer). The spatial scale is mapped onto a velocity scale, where vx represents east-to-west motion, and vz represents south-to-north motion.
Each panel in Figs. 6 and 7 displays the integrated ejecta density over 500 km s-1 intervals in vy, covering the velocity range vy = [-2500, 3500] km s-1. This representation allows for a detailed examination of how Fe-rich ejecta are distributed along the LoS, providing insights into the 3D structure of the innermost ejecta. Since Earth is positioned along the negative y-axis, this approach effectively distinguishes ejecta located on the near side (blueshifted) from those on the far side (redshifted), offering a direct comparison with observational velocity maps (compare with Fig. 3 in Larsson et al. 2023).
The maps are qualitatively in agreement with the results from JWST observations, showing two distinct clumps of Fe-rich ejecta. One clump is traveling toward the north, approaching the observer (blueshifted) with a small velocity component eastward (negative vx), while the other, more massive clump is traveling south, receding from the observer (redshifted) with a small westward component (positive vx). The mass asymmetry between the two clumps originates from the explosion’s asymmetry across the equatorial plane, as established in Ono et al. 2020 (see also Fig. 2 of Paper I). However, both models predict significantly lower velocities for the two clumps compared to the observed values.
In model B18.3, the bulk of Fe-rich ejecta exhibit LoS velocities, vy, ranging from -1500 to +2500 km s-1, with a faint tail extending up to +3500 km s-1. The velocity components vz range between -1000 and -1500 km s-1 for the clump propagating to the north, and between +1000 and +1500 km s-1 for the clump propagating to the south. In total, the two modeled Fe-rich clumps travel at velocities of approximately 1500 km s-1, whereas JWST observations report values of approximately 2300 km s-1 (Larsson et al. 2023).
The inclusion of the Ni-bubble in model B18.3-Dec does not significantly alter the overall results. Its primary effect is the inflation of ejecta initially rich in Ni, leading to more extended Fe-rich clumps (see lower panels in Fig. 5). Consequently, while the tails of Fe-rich ejecta can reach velocities up to ≈3500 km s-1, the bulk of the ejecta exhibit velocities similar to those found in model B18.3 (compare Figs. 6 and 7). Another key difference from model B18.3 is that, while the latter shows two clumps connected by a tenuous distribution of Fe-rich material, the inclusion of Ni-bubble effects leads to a significant amount of Fe-rich material between the two clumps, within the velocity range of-500 to 500 km s-1.
The above effect is evident in Fig. 8, which presents the normalized mass distributions of Fe-rich ejecta as a function of the LoS velocity (upper panel) and radial velocity (lower panel) for both models. The distributions in the two models peak at nearly the same LoS velocities, though the inclusion of the Ni-bubble results in broader distributions in model B18.3-Dec (upper panel), leading to a partial blending of the two peaks (as also noted in Fig. 2). The effects of the Ni-bubble are also evident in the distributions of the radial velocities (lower panel). The broader radial velocity distributions in model B18.3-Dec result in a non-negligible fraction of Fe-rich ejecta reaching velocities above 2000 km s-1 . Additionally, the figure shows that, in both models, the Fe-rich clump in the southern hemisphere is more massive than the one propagating in the northern hemisphere, as indicated by the more prominent red peaks compared to the blue ones. This is in agreement with observations.
It is worth noting that model B18.3-Dec incorporates Ni-bubble effects under the assumption of no γ-ray leakage from the inner regions of the remnant (see Sect. 2). Consequently, the Ni-bubble influence is likely overestimated in this model. A more realistic treatment, accounting for partial γ-ray escape, would likely result in a Fe-rich ejecta distribution intermediate between those predicted by models B18.3 (no Ni-bubble) and B18.3-Dec (maximum Ni-bubble effect). Furthermore, escaping γ-rays could contribute to photoionization in the surrounding material, potentially leading to the formation of a halo around emitting structures. Future investigations incorporating improved radiative transport and mixing processes will be crucial for refining these predictions.
The emission line profiles from the inner Fe-rich ejecta are expected to partially reflect the total mass distribution of unshocked Fe-rich ejecta as a function of the LoS velocity. Figure 9 presents the continuum-subtracted profiles of [Fe II] (25.99 μm; black line) and [Fe I] (1.44 μm; red line) emission lines from the inner ejecta of SN 1987A, as observed on July 16, 2022, with JWST (Jones et al. 2023). For comparison, the figure also includes the modeled Fe mass distribution profile (solid blue line), derived from model B18.3-Dec by summing the contributions from both the southern and northern hemispheres, as shown in Fig. 8. As expected, the modeled profile is narrower than the observed emission lines, indicating that the simulated Fe-rich ejecta expand more slowly than observed. Additionally, there is an excess of Fe mass at velocities between 0 and 2000 km s-1, suggesting that the dynamics of the modeled clump receding from the observer differ from those inferred from observations. To further explore this velocity discrepancy, we artificially increased the expansion velocity of the Fe-rich ejecta by 35% to match the observed values (dashed blue line). This adjustment brings the blueshifted modeled profile into remarkable agreement with observations, but significant discrepancies persist on the redshifted side. This suggests that while the modeled blueshifted clump (moving toward the observer in the northern hemisphere) primarily suffers from an underestimated velocity, the modeled redshifted clump has more fundamental differences in its dynamical properties compared to observations.
The discrepancy in the redshifted clump may be related to another significant mismatch between the models and observations, specifically the propagation direction of the two Fe-rich clumps. JWST observations indicate that the Doppler shifts of the clumps suggest they are not aligned along the same axis passing through the explosion center (Larsson et al. 2023). The blueshifted velocity of the northern clump suggests that it lies close to the plane of the equatorial ring, while the smaller red-shifted velocity of the southern clump implies that its trajectory is inclined at a larger angle relative to this plane (see also Kjær et al. 2010; Larsson et al. 2016). In contrast, our models predict that both Fe-rich clumps are aligned along the same axis and positioned near the plane of the equatorial ring (see Fig. 5). This alignment arises from the idealized bipolar explosion geometry assumed in the initial conditions of the SN model (Ono et al. 2020). As a result, while the trajectory of the northern clump is consistent with observations, that of the southern clump deviates from the observed structure.
Interestingly, Larsson et al. (2023) also identified an isolated Fe-rich clump interacting with the reverse shock in the southern hemisphere. This clump is located nearly in the plane of the equatorial ring and closely aligned with the axis passing through the explosion center and the blueshifted Fe-rich clump. This evidence fits well in the general scenario described in our models but suggests a more asymmetric explosion. The misalignment of Fe clumps along a single symmetry axis, combined with discrepancies in the expansion velocity of Fe-rich ejecta, indicates that further refinements in modeling early-time explosion asymmetries and ejecta evolution are necessary to improve agreement between simulations and observations.
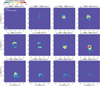 |
Fig. 6 Distribution of Fe-rich ejecta from model B18.3 at t ≈ 36 years after core collapse (corresponding to February 2023) as a function of velocity along the y-axis (LoS), ranging from vy = -2500 km s-1 (top-left panel, near side of the remnant) to vy = 3500 km s-1 (bottom-right panel, far side of the remnant). Each panel shows the Fe-mass density integrated over a 500 km s-1 velocity interval along vy , with the corresponding range labeled above each frame. The color scale (top left of the figure) indicates the normalized column density of Fe. The axes represent velocity components in the plane of the sky: vx (east-west direction) and vz (south-north direction). |
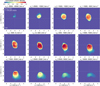 |
Fig. 7 Same as Fig. 6, but for model B18.3-Dec. The figure illustrates the impact of Ni-bubble effects on the distribution and expansion of Fe-rich ejecta. The normalization of the column density differs from that in Fig. 6. |
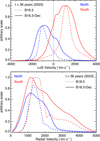 |
Fig. 8 Mass distributions of Fe-rich ejecta as a function of the velocity component along the LoS (upper panel) and the radial velocity (lower panel) at t ≈ 36 years after core collapse (corresponding to February 2023) for models B18.3 (dashed lines) and B18.3-Dec (solid lines). Red and blue curves represent the results for the southern and northern hemispheres, respectively. |
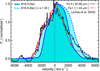 |
Fig. 9 Profiles of continuum-subtracted [Fe II] (25.99 μm; black line) and [Fe I] (1.44 μm; red line) emission lines from the inner ejecta of SN 1987A, as observed on July 16, 2022, with JWST (Jones et al. 2023). These are compared with the total mass distribution of unshocked Fe-rich ejecta as a function of the LoS velocity, predicted by model B18.3-Dec for February 2023 (solid blue line). The dashed blue line represents the Fe mass distribution with an artificially increased LoS velocity (by 35%) to better match the JWST observations (Larsson et al. 2023). The Fe mass distributions have been normalized to roughly match the peak of [Fe I] line. |
3.3 Shocked ejecta: Ppotential insights from XRISM spectra
While JWST enables the investigation of the structure of the unshocked innermost ejecta, XRISM spectra allow us to probe the regions where the outermost ejecta interact with the inhomogeneous CSM. These observations thus provide valuable insights into the density distribution and geometry of the CSM, as well as the structure of the outermost ejecta. In particular, constraining the properties of freshly shocked ejecta can offer crucial information about the progenitor star by revealing characteristics of its outer envelope. Additionally, the detection of emerging metal-rich ejecta can place important constraints on explosion asymmetries, as demonstrated by the Fe-rich regions observed in Cas A (Orlando et al. 2021).
According to our models, the contribution of shocked ejecta to the X-ray emission in SN 1987A became comparable to that of shocked CSM around 2018 (Paper I; see also Sect. 3.1). In the coming years, the models predict that this contribution will continue to increase, while the emission from the shocked CSM will gradually decline (see Fig. 6 in Paper I). We therefore evaluated the observability of shocked ejecta in the X-ray band, providing insights for interpreting current and future observations. In particular, we explored the diagnostic potential of high-spectral-resolution data from the XRISM satellite, identifying key spectral features that trace ejecta properties, shock dynamics, and mixing processes within the remnant.
3.3.1 Emission measure distribution versus ionization age and electron temperature
As discussed in Paper I, the X-ray-emitting plasma can be characterized by deriving its EM distribution as a function of electron temperature (kTe) and ionization timescale (τ). Figure 10 presents the evolution of the EM distribution for models B18.3 and B18.3-Dec from 2024 (the year of the first XRISM observations of SN 1987A) to 2037, covering the next 13 years of evolution. The figure reveals a complex structure of the EM distribution spanning temperatures from 0.1 to ≈5 keV. This distribution suggests that a significant fraction of the emitting plasma deviates from ionization equilibrium, with ionization timescales ranging from 109 to 1013 s cm-3. It also highlights contributions from both shocked CSM (red) and shocked ejecta (green), along with the specific contribution of shocked Fe (blue).
The distributions in both models are similar, with the ejecta and CSM components generally remaining spatially distinct, reflecting their differing thermal and ionization histories (see Fig. 10). The shocked CSM, which surrounds the reverse-shocked ejecta (green/blue region in the figure), exhibits different characteristics depending on its environment: in the dense equatorial ring, it typically has longer ionization timescales (clumpy red structure at τ > 1012 s cm-3 in Fig. 10), whereas in the H II region, it shows shorter ionization timescales (red region with τ < 1011 s cm-3). This difference primarily arises from the significantly higher densities of the equatorial ring compared to the surrounding H II region. The temperature of the shocked CSM, initially distributed over a broad range from 0.1 to 5 keV in 2024 (left panels in Fig. 10), gradually increases over time. By 2037, it exceeds 0.5 keV, driven by the progressive thermalization of electrons with ions (right panels). Notably, the electron temperature exhibits an inverse relationship with the ionization timescale in the shocked ring. This correlation reflects the presence of multiple CSM clumps with varying densities when the shocked plasma approaches thermal equilibrium: denser clumps have a higher ionization timescale and a lower electron temperature, while less dense clumps exhibit a lower ionization timescale and a higher electron temperature.
The shocked ejecta (green/blue region in Fig. 10) exhibit a broad distribution of temperatures and ionization ages, positioned between the two CSM components. In general, the EM distribution of the ejecta shows a gradual expansion toward higher ionization timescales (τ), while the range of temperatures remains nearly unchanged. A more significant evolution occurs in the chemical composition of the shocked ejecta, which become increasingly enriched in metals as the innermost layers begin to interact with the reverse shock. A notable example is Fe (highlighted by the contours and the blue region in the figure), which progressively contributes more to the EM distribution over time. This effect is particularly pronounced in model B18.3-Dec, where the expansion of Fe-rich ejecta is enhanced by the action of the Ni-bubble. As a result, the contribution of shocked Fe becomes distinctly visible in 2037, as evidenced by the prominent blue region in the lower right panel of Fig. 10.
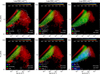 |
Fig. 10 Distributions of EM as a function of electron temperature (kTe) and ionization timescale (τ = net) at the labeled times for models B18.3 (upper panels) and B18.3-Dec (lower panels). The panels present three-color composite images of the EM distributions, where different colors represent contributions from distinct shocked plasma components: shocked CSM (red), shocked material from the H envelope (green), and shocked Fe-rich ejecta (blue). White contours highlight the regions dominated by Fe. |
3.3.2 Dynamical properties of the shocked ejecta
In Sect. 3.2, the comparison between our models and recent JWST observations revealed that the modeled Fe-rich clumps are slower and located deeper within the ejecta than observed. This suggests that, in our simulations, the interaction between these clumps and the reverse shock occurs later than in SN 1987A. In fact, Larsson et al. (2023) have provided evidence of the first interaction between Fe-rich ejecta and the reverse shock in the southern hemisphere, indicating that this process was already underway in 2022. In contrast, model B18.3-Dec predicts this interaction to begin around 2027, implying a delay of at least five years. As discussed in Sect. 3.2, this discrepancy indicates that our models may underestimate the outward expansion of Fe-rich ejecta, possibly due to an underestimation of the initial explosion asymmetries.
In previous studies, we used model B18.3 to predict the XRISM Resolve spectrum of SN 1987A as observed during the allocated performance verification phase in 2024 (Sapienza et al. 2024a,b). This analysis demonstrated that shocked ejecta play already a key role in shaping the emission line profiles, significantly broadening them. According to our interpretation, the observed broadening results from the bulk motion of rapidly expanding ejecta along the LoS, contributing to the overall velocity dispersion of the emitting shocked ejecta.
It is therefore insightful to compare the LoS velocity profiles of ejecta species with those of the same elements in the shocked CSM, with the aim to investigate the detectability of shocked ejecta in future observations. For the ejecta, we differentiate between elements originating from the H envelope (assuming similar abundances as the CSM) and those from the metal-rich (in the following “pure”) ejecta. Figure 11 shows the EM distribution as a function of LoS velocity for shocked O, Si, S, Ar, and Fe, as derived from models B18.3 and B18.3-Dec in different epochs. The figure distinguishes between contributions from the CSM, the H envelope, and the pure ejecta, providing a comprehensive view of how these components shape the velocity structure of the remnant.
Although these EM profiles cannot be directly compared to the emission line profiles observed with high-spectral-resolution instruments such as XRISM Resolve, they provide valuable insights into the expected line broadening due to dynamical effects. In particular, they highlight the influence of shock interaction on the velocity dispersion of different plasma components and help to identify potential spectral features that could be used to diagnose ejecta properties. Furthermore, comparing the contributions of shocked CSM and shocked ejecta enables us to distinguish ejecta-dominated emission in observed line profiles, which is critical for interpreting upcoming high-resolution X-ray spectra (see Sect. 3.3.3).
As noted by Sapienza et al. (2024a), our models indicate that the emission from shocked ejecta (both the H envelope and pure ejecta) is significantly broader than that from the shocked CSM (compare the green/violet lines with the blue lines in Fig. 11). Before 2021, the X-ray emission was primarily dominated by the shocked CSM (see Paper I), with line profiles reflecting the distribution of LoS velocities within this component. By 2021, the contribution from shocked ejecta became comparable, and in subsequent years, it continued to grow relative to the shocked CSM, eventually becoming the dominant component (see Paper I).
By 2024 (left panels in Fig. 11), at the time of the XRISM observations of SN 1987A (OBS ID 300021010), the shocked CSM still dominated the core of the velocity distributions for all species, with velocities ranging between -2000 and 2000 km s-1. However, the wings of the distributions were increasingly influenced by the contribution from the shocked H envelope, which extended to higher velocities. Similar results were found for both models B18.3 and B18.3-Dec, as the shocked ejecta have not yet been significantly influenced by either the asymmetry of the SN explosion or the effects of the Ni-bubble (compare the solid and dashed lines in the left panels of the figure). The contribution of shocked ejecta is expected to manifest as an additional broadening in both redshifted and blueshifted wings of X-ray emission lines (Sapienza et al. 2024a,b).
In the coming years, the contribution from shocked ejecta will continue to increase, leading to further broadening of the wings in X-ray emission lines. By 2027 (center panels in Fig. 11), the overall distributions remain similar to those of 2024, but with a noticeable rise in the contribution from the shocked H envelope. The most intriguing development is the emergence of a small shocked pure Fe component at velocities between 2000 and 3000 km s-1, visible in model B18.3-Dec. This feature results from the interaction of the reverse shock with the Fe-rich clump propagating southward and receding from the observer (see Sect. 3.2). In contrast, this feature is less prominent in model B18.3 (see dashed lines in the right panels of Fig. 11), as the Fe-rich ejecta remain more compact due to the absence of Ni-bubble effects, which would otherwise enhance their expansion. It is also worth noting that a similar contribution at negative velocities is absent, as the Fe-rich clump propagating northward towards the observer (blueshifted) is less extended and has not yet interacted with the reverse shock in the epoch considered.
By 2037 (right panels in Fig. 11), the EM distributions of all species will be almost entirely dominated by shocked ejecta, primarily originating from the H envelope. Additionally, the contribution from shocked pure ejecta will become increasingly significant, particularly in the redshifted wing of the distributions, where a secondary bump will emerge at velocities around 3000 km s-1. This feature is more pronounced in the distributions of Fe, Si, and S and is stronger in model B18.3-Dec compared to model B18.3 (compares dashed and solid lines in Fig. 11). The effect results from the interaction of the reverse shock with the Fe-rich clump, which is mixed with surrounding ejecta and propagates southward, receding from the observer. A similar contribution at negative velocities remains absent also at this epoch, as the Fe-rich clump moving northward toward the observer has not yet significantly interacted with the reverse shock. The contrasting behavior of the two clumps, a direct consequence of the asymmetric bipolar explosion, underscores the lasting influence of the explosion geometry on the remnant’s evolution.
3.3.3 Properties of X-ray spectra in the coming years
The above findings highlight the need for a detailed assessment of XRISM’s diagnostic capabilities in studying the shocked ejecta in SN 1987A. To this end, we synthesized XRISM Resolve spectra from our models at the three epochs analyzed in Fig. 11: 2024 (remnant age of 37 years), 2027 (40 years), and 2037 (50 years). For this analysis, we assumed an exposure time of 500 ks for the synthetic spectra, approximately 30% longer than the ~350 ks allocated for the performance verification phase in 2024 (OBS ID 300021010). The resulting synthetic spectra, covering the full [1.0, 10.0] keV energy band, are presented in Fig. 12. We note that emission below 1.8 keV is significantly attenuated due to a technical issue related to XRISM Resolve’s gate valve, which failed to open as originally planned. This anomaly leads to a reduced soft X-ray response, limiting the spectral coverage at lower energies.
Before to proceed, it is important to note that the CSM geometry and density distribution in our models are constrained by X-ray observations collected before 2016 (see Paper I). Consequently, only the shocked CSM as of 2016 is well constrained, while the regions still unshocked at that epoch were extrapolated. This means that if the remnant begins interacting with a CSM that deviates significantly from our extrapolation, substantial differences from our predictions may arise. Such discrepancies would be crucial for refining the models and achieving a more accurate characterization of the CSM.
For our purposes, we focused here on a selection of emission lines that can serve as important diagnostics of the shocked ejecta: Si XIV (2.1 keV), SXV (2.46 keV), Ar XVII (3.14 keV), Fe XXV (6.7 keV). Figure 13 shows these lines at the three epochs for model B18.3-Dec; a corresponding figure for model B18.3 would yield nearly identical results, except for differences in the Fe lines (as also suggested by Fig. 11). Therefore, our analysis primarily focuses on model B18.3-Dec, highlighting any relevant discrepancies observed in model B18.3.
The figure illustrates the distinct contributions to the emission, particularly from the shocked CSM, the shocked H envelope (assuming CSM-like abundances), and the shocked pure (metal-rich) ejecta, with abundances derived from the simulated evolution of the post-core-collapse ejecta. By examining the evolution of these spectral features across the three epochs, we assessed how XRISM Resolve (and, more broadly, high-resolution X-ray spectroscopy) can differentiate between shocked ejecta and shocked CSM while tracking the progressive enrichment of the X-ray-emitting plasma by metal-rich material. These insights will be valuable for interpreting future highresolution X-ray observations of SN 1987A and other young SNRs.
Figure 12 clearly demonstrates that, in the coming years, the contribution from shocked ejecta will gradually increase. This trend is particularly evident in spectral lines below 3.5 keV, such as Si XIV and S XV, where the ejecta already make a significant contribution in 2024 and are expected to dominate by 2027 (see the top two rows of Fig. 13). For these lines, the majority of the ejecta contribution originates from pure ejecta, with the contribution from the H envelope remaining relatively minor (compare violet and green lines in the figure).
At higher energies, the contribution from shocked ejecta is less pronounced but still detectable. This is primarily due to the smaller contribution from pure ejecta compared to low-energy lines (see the bottom two rows of Fig. 13), as ejecta rich in Ar and Fe are located in the innermost regions of the remnant and interact with the reverse shock at later times. By 2027, the ejecta contribution is expected to become comparable to that of shocked CSM in lines as Ar XVII (compare yellow and blue lines in the figure), mainly driven by the shocked H envelope (green line). By 2037, the emission will be largely dominated by shocked pure ejecta. Beyond this point, it is also expected to dominate in high-energy lines (violet line).
As noted by Sapienza et al. (2024a), according to our models, the contribution from shocked ejecta can be revealed in spectra collected at the present time by analyzing the line profiles. While the core of the lines remains dominated by the contribution from shocked CSM, the wings show the emerging influence of the broader component from shocked ejecta (see Fig. 13). This effect is particularly evident in lines such as Si XIV and S XV, whereas lines at higher energies (e.g., Ar XVII and Fe XXV) show a less pronounced broadening. The broader wings are a direct consequence of the dynamical properties of shocked ejecta, which exhibit a greater spread of LoS velocities compared to the shocked CSM (see Sect. 3.3.2 and Fig. 11). Notably, the centroids of the lines are generally redshifted, with the redshifted wing extending further than the blueshifted counterpart, consistently with our findings in Sect. 3.1. This effect is most prominent in the Fe XXV line, which remains definitively redshifted at all epochs, with velocities ranging between 1000 and 2000 km s-1. This asymmetry mirrors the spatial imbalance of the SN explosion, which released more energy in the direction of the Fe-rich clump receding from the observer (see Sect. 3.2).
In the coming years, line broadening is expected to increase as the contribution from shocked ejecta grows, introducing additional asymmetries and velocity shifts in the line profiles. This evolution will enhance the distinct signatures of the ejecta, particularly in the line wings, offering deeper insights into the remnant’s ejecta dynamics and asymmetries. Notably, a prominent redshifted component with a velocity of around 2500 km s-1, attributed to pure ejecta, is expected to emerge in the Si XIV and S XV lines, eventually becoming their dominant peak by 2037.
These developments will provide a new means to probe the 3D structure of ejecta and kinematics of the remnant. As the contribution from shocked ejecta increases, elemental abundances derived from spectral analysis will likely become more pronounced, further distinguishing shocked ejecta from shocked CSM. The evolving line profiles will serve as key diagnostics for tracking the dynamics and composition of the shocked material over time. These findings underscore the critical role of high-resolution X-ray spectroscopy in disentangling the contributions of shocked ejecta and CSM, offering a powerful tool to investigate both the explosion physics and the properties of the surrounding medium (see also Orlando et al. 2024b).
The effect of the Ni-bubble is not particularly evident in the spectra at the three epochs analyzed, except for Fe lines. In model B18.3-Dec, the contribution from pure Fe ejecta becomes significant between 2027 and 2037 (see lower panels in Fig. 13), leading to a pronounced redshifted Fe XXV line. In contrast, in model B18.3, the contribution from pure Fe ejecta remains negligible until 2037 (see Fig. 14). This difference arises because, in model B18.3-Dec, the bulk of Fe-rich plume propagating southward, away from the observer, starts to interact with the reverse shock around 2027, whereas in model B18.3, the bulk of Fe-rich clumps is still far from the reverse shock in 2037.
In Sect. 3.2, we demonstrated that our model underestimates both the expansion velocity and the extent of the Fe-rich ejecta toward the reverse shock, when compared to JWST observations. As a result, the interaction between the pure Fe-rich ejecta and the reverse shock is delayed by more than 5 years in our models. This suggests that the contribution from this ejecta component, expected to appear between 2027 and 2037, might already be detectable in current data. Based on our previous findings, we anticipate that our model underestimates the flux of the Fe XXV line because the Fe-rich ejecta have already begun interacting with the reverse shock, contrary to our model’s predictions. This interpretation is supported by JWST observations, which show Fe-rich material engaging with the reverse shock (Larsson et al. 2023). Future models addressing this discrepancy in the distribution of innermost Fe-group elements are unlikely to significantly alter the structure of light and intermediate-mass elements. Therefore, we expect the predicted profiles and fluxes of lines from intermediate-mass elements to remain unchanged.
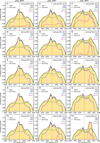 |
Fig. 11 Normalized EM distributions (in log scale, with the maximum value indicated in the upper-right corner of each panel; the EM is in units of cm-3) as a function of LoS velocity for (from top to bottom) shocked O, Si, S, Ar, and Fe, as derived from models B18.3 (dashed lines) and B18.3-Dec (solid lines) at three epochs: 2024 (left panels), 2027 (center panels), and 2037 (right panels). Each panel displays the total distribution (black line) along with individual contributions from the species in the shocked CSM (blue), the shocked H envelope (assuming CSM-like abundances; green), and the shocked inner (pure) ejecta (violet). |
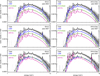 |
Fig. 12 Full XRISM Resolve spectra in the [1.0, 10.0] keV energy range synthesized from models B18.3 (on the left) and B18.3-Dec (on the right) at the labeled times. The spectra (shown as gray crosses) were computed assuming an exposure time of 500 ks. For reference, the figure also shows the ideal synthetic spectra (black lines) along with the contributions from individual plasma components: shocked CSM (blue), shocked H envelope (green), and shocked pure ejecta (violet). No significant signal is detected below 1.8 keV due to the XRISM gate valve remaining closed, which prevents soft X-ray photons from reaching the detector. |
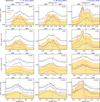 |
Fig. 13 XRISM Resolve spectra synthesized from model B18.3-Dec at three epochs: 2024 (left panels), 2027 (center panels), and 2037 (right panels). The figure presents close-up views of selected emission lines: Si XIV (2.1 keV), S XV (2.46 keV), Ar XVII (3.14 keV), Fe XXV (6.7 keV). Each panel shows the synthetic spectra of SN 1987A as observed with XRISM Resolve (shown as gray crosses), assuming an exposure time of 500 ks. Also included are the ideal synthetic spectra (black lines) and the contributions from different plasma components: shocked CSM (blue), shocked H envelope (green), and shocked pure ejecta (violet). The total contribution from shocked ejecta (H envelope + pure ejecta) is highlighted by the shaded yellow region. The top axis of each panel indicates the corresponding Doppler shift velocities relative to the rest-frame wavelength of each line. |
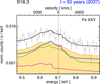 |
Fig. 14 Same as the bottom-right panel in Fig. 13 at the age of 50 years (corresponding to 2037) but for the Fe XXV line synthesized from model B18.3. |
3.4 Predicted long-term evolution over the next 5000 years
We extended our simulations to cover the next 5000 years of evolution, providing insights into the future development of SN 1987A. However, some caution is necessary when interpreting these results. The structure of the CSM beyond the hourglassshaped H II nebula remains largely unknown. As a result, we had to make an arbitrary assumption regarding the extended medium through which the blast wave propagates. To minimize additional uncertainties, we adopted the simplest possible configuration: a surrounding environment with a density profile decreasing as r-2 beyond ≈2.2 × 1018 cm (see Sect. 2.3). This choice, which excludes possible inhomegeneities in the CSM and the transition from the CSM to the interstellar medium, prevents the introduction of additional asymmetries in the remnant morphology that could arise from interactions with an arbitrary inhomogeneous medium.
By following this approach, we were able to evaluate how long the remnant retains the imprint of the initial asymmetries introduced by the bipolar explosion, as well as those shaped by its interaction with the highly structured CSM (i.e., the triplering nebula around SN 1987A) immediately surrounding the SN. These extended simulations provide a framework for understanding the possible long-term evolution of SN 1987A and enables comparisons between its predicted future morphology and that of more evolved SNRs observed today. Identifying features in the morphology of present-day evolved remnants analogous to those predicted for the future of SN 1987A could signal early interactions between the blast wave and a highly inhomogeneous CSM similar to that of SN 1987A.
Figure 15 illustrates the evolution of SN 1987A at four selected epochs, spanning from 100 to 5000 years after the explosion, as predicted by model B18.3. The results for model B18.3-Dec are qualitatively similar, so we primarily focused on model B18.3. The left panels in the figure display 2D slices of the remnant, taken in a plane perpendicular to the equatorial ring and passing through the explosion center. These slices provide insight into the internal structure of the remnant, including the evolution of the shocked ejecta and the mixing region between the forward and reverse shocks. The center and right panels show the corresponding synthetic X-ray images in the [0.5, 2] and [3, 10] keV bands, modeled as they would appear in Chandra observations, assuming an orientation consistent with that of SN 1987A. These images highlight the changing morphology of the remnant over time and allow for direct comparison with the present X-ray morphology of SN 1987A and other more evolved SNRs.
At an age of 100 years, the remnant still retains the imprint of its interaction with the dense equatorial ring and the surrounding H II region (see upper right panel in Fig. 15). At this stage, the two outer rings above and below the equatorial plane are partially shocked (see the 2D slice in the upper left panel of Fig. 15). The remnant’s X-ray morphology remains similar to its present-day appearance, dominated by a bright ring-like structure resulting from the shock interaction with the dense equatorial material. In contrast, emission from the shocked outer rings remains too faint to be detected in X-rays. As the remnant continues to evolve, the contribution of the outer rings to the overall X-ray emission will remain marginal.
As the remnant expands into a progressively lower-density CSM, its morphology undergoes a gradual transformation, shifting from the highly asymmetric structure observed at 100 years (upper panels in the figure) to a more spherically symmetric shape predicted at the age of 5000 years (lower panels). This transition occurs as the expansion reduces density contrasts between different regions and variations in shock velocity average out over larger scales. This process is particularly effective in a CSM with a density profile decreasing as r-2, as assumed here, where differences in shock propagation speed naturally diminish over time, further contributing to the remnant’s increasing symmetry (see also Ustamujic et al. 2021).
Meanwhile, the reverse shock steadily propagates inward, progressively shocking intermediate-mass and Fe-group elements. By the age of 500 years, Fe-rich regions become prominent as the reverse shock interacts with the two Fe-rich plumes. As an example, Fig. 16 presents the synthetic XRISM Resolve spectrum derived from model B18.3 at an age of 500 years, assuming an exposure time of 500 ks. At this epoch, the contribution of shocked ejecta is significant across all emission lines and becomes the dominant component in softer-energy lines (e.g., Si XVI and S XV). Notably, a prominent Fe Ka line at 6.7 keV appears, significantly redshifted, and originating from the shocked ejecta. This feature emerges despite the fact that the model considered (B18.3) does not account for Ni-bubble effects. The Fe line is primarily due to the interaction of a substantial fraction of the Fe-rich clumps with the reverse shock at this epoch.
The imprint of the remnant’s early interaction with the dense equatorial ring and the surrounding H II region remains visible in X-ray images for up to approximately 1000 years (see second and third rows in Fig. 15). The central bar-shaped structure, most prominent at 500 years (particularly in the [3, 10] keV band), originates from this early interaction with the dense equatorial material. Although it becomes less pronounced over time, this feature remains partially visible at 1000 years, highlighting the lasting influence of the asymmetric CSM on the remnant’s morphology.
Similar structures in older SNRs offer valuable clues about their early evolution. Such features may indicate interactions between the SN shock and a circumbinary disk, similar to what is observed in SN 1987A, emphasizing the role of pre-SN mass loss in shaping SNR structures. Notable examples include: G292.0+1.8, which exhibits a central bar-like structure, likely shaped by circumstellar interactions; E0102-72.3 (1E 0102.27219), whose morphology suggests the progenitor exploded within a disk of material, denser in the equatorial plane; SNR 0540-69.3, characterized by an outer shell and bright central structures, likely influenced by interactions with surrounding material.
In 5000 years, the remnant’s X-ray morphology is predicted to become nearly spherically symmetric, with no discernible traces of its early interaction with the equatorial ring. This will mark the transition to a more uniform expansion phase.
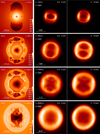 |
Fig. 15 Predicted long-term evolution of SN 1987A over the next 5000 years based on model B18.3. The left panels show cross-sections of the mass density distribution (in log scale, in units of g cm-3) in a plane perpendicular to the equatorial ring, passing through the explosion center, at four different epochs (see labeled times). The right panels present the corresponding synthetic thermal X-ray emission maps in the [0.5, 2.0] keV (on the left) and [3.0, 10.0] keV (on the right) bands, assuming an orientation consistent with that of SN 1987A. Each X-ray image is normalized to its maximum for visibility, and the maps are convolved with a Gaussian of 0.1 arcsec to approximate the spatial resolution of Chandra. |
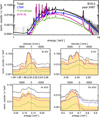 |
Fig. 16 XRISM Resolve spectra synthesized from model B18.3 at an age of 500 years (corresponding to the year 2487). The upper panel displays the full spectrum in the [1.0, 10.0] keV energy range, while the four lower panels provide close-up views of selected emission lines: Si XIV (2.1 keV), SXV (2.46 keV), Ar XVII (3.14 keV), Fe XXV (6.7 keV). The top axis of each lower panel represents the corresponding Doppler shift velocities relative to the rest-frame wavelength of each line. The figure includes the ideal synthetic spectra (black lines) and the contributions from individual plasma components: shocked CSM (blue), shocked H envelope (green), and shocked pure ejecta (violet). The lower panels emphasize the contribution from shocked ejecta (H envelope + pure ejecta) using a shaded yellow region. |
4 Summary and conclusions
In this study, we analyzed high-resolution 3D MHD simulations to investigate the evolution of SN 1987A’s ejecta structure, focusing on explosion asymmetries and ejecta-CSM interactions. By comparing our models with recent JWST observations and making predictions for XRISM data, we examined how the initial asymmetric explosion shaped the observed ejecta structure, identifying constraints for future modeling. We also explored the impact of Ni-bubble effects on Fe-rich ejecta expansion and predicted future X-ray signatures for diagnostic purposes. Additionally, we extended our simulations to 5000 years to determine how long the remnant retains imprints of the explosion and its early interaction with the inhomogeneous CSM. Our key findings are summarized below:
Fe-rich plumes and bipolar explosion. The simulations successfully reproduced the large-scale Fe-rich ejecta morphology, revealing the formation of two prominent Fe-rich plumes or clumps. According to our models, these clumps originate from an asymmetric bipolar explosion, which is able to reproduce Fe line profiles observed 1-2 years after the SN (e.g., Haas et al. 1990). Their motion is consistent with JWST observations, where one clump is moving to the north toward the observer (blueshifted) and the other, more massive clump is moving to the south away from the observer (redshifted);
Impact of Ni-bubble on ejecta evolution. The Ni-bubble effect significantly influences the dynamics of Fe-rich ejecta, enhancing their expansion and accelerating their interaction with the reverse shock. In the model incorporating the Ni-bubble effect (B18.3-Dec), the interaction of shocked Fe with the reverse shock occurs approximately three years earlier than in models without this effect (B18.3). Furthermore, the Ni-bubble contributes to a broader, smoother LoS velocity distribution of Fe, which peaks at redshifted velocities and partially merges the two Fe-rich clumps into a single, more unified structure;
X-ray diagnostics and future observations. Our models predict that shocked ejecta have contributed increasingly to X-ray emission since 2021 and will soon dominate as emission from the shocked CSM fades. According to these results, XRISM spectra in 2024 can reveal broad Fe, Si, and S line profiles characteristic of shocked ejecta interactions. We anticipate that future XRISM observations will track the expansion and evolution of these structures, refining constraints on explosion geometry and mixing. These diagnostics will provide key insights into explosion asymmetries, mixing processes, and remnant dynamics, highlighting the crucial role of X-ray spectroscopy in probing both the parent SN and its surrounding environment;
Long-term evolution of the remnant. Over the next 5000 years, the remnant is expected to evolve from its current asymmetric structure, shaped by interactions with the equatorial ring and H II region, to a nearly spherically symmetric morphology, provided it does not encounter significant CSM asymmetries. At 100 years, the remnant will still exhibit a bright, ring-like X-ray structure, due to the early shock interaction with the dense triple-ring nebula. As expansion continues into a lower-density medium (arbitrarily modeled with a simple r-2 profile), density contrasts will diminish, promoting symmetry. By 500 years, the emission of a central bar-like feature (the relic of the early interaction with the dense ring) will peak before fading by 1000 years. Finally, by 5000 years, all memory of the early explosion asymmetries and CSM interaction will be lost, leaving behind a nearly homogeneous remnant structure. Similar features may be observed in older SNRs, providing clues about possible early interactions with a structured CSM or circumbinary disk, similar to what is observed in SN 1987A.
Tension between current models and JWST observations
The overall good agreement between our simulations and observations provides compelling evidence that the large-scale structure of SN 1987A’s ejecta was shaped by a highly asymmetric core-collapse SN. However, while some aspects are captured by the adopted model (see also Ono et al. 2020), others suggest the need for more extreme or different ejecta properties. Discrepancies that remain include: the underprediction of Fe-rich ejecta velocities of the Fe-rich ejecta by about 35% compared to those inferred from JWST data, failure to reproduce the observed broken-dipole morphology, and the absence of clearly separated Fe-rich clumps evident in the observations. These tensions suggest that additional physical factors or conditions may need to be incorporated to fully reconcile models with observations.
The question of the too slow ejecta could be related to more extreme explosion asymmetries than considered in our models, which could stem from large-scale instabilities present in neutrino-driven SNe. These include processes such as convective overturn driven by neutrino heating and the SASI in the first seconds after core collapse (e.g., Blondin et al. 2003; Janka et al. 2016; Müller 2016, 2020; Janka 2025). These processes are inherently stochastic and can seed diverse and highly asymmetric structures in the expanding ejecta. In addition, the subsequent evolution of the extended Ni-rich plumes is influenced by progenitor properties, which may enhance the acceleration of clumps via Rayleigh-Taylor instabilities, and by interactions with the reverse shock and other reflected shocks that can re-energize the ejecta (Gabler et al. 2021). Increasing the explosion energy could in principle lead to higher velocities; however, our models already employ an energy of ~2 × 1051 erg, which is at the high end of values inferred for SN 1987A (e.g., Perego et al. 2015). Furthermore, our B18.3-Dec model accounts for the acceleration induced by radioactive ß-decay heating, which is expected to provide an upper limit to this effect. Nonetheless, all these factors may collectively contribute to higher ejecta velocities and warrant further investigation through dedicated simulations.
The broken-dipole morphology may naturally arise from the intrinsic asymmetries in neutrino-driven explosions. Although multipolar asymmetries are typical, simulations sometimes result in unipolar or approximately bipolar morphologies (e.g., Wongwathanarat et al. 2015; Utrobin et al. 2021; Wang & Burrows 2024; Burrows et al. 2024), which may offer a potential explanation for the Fe-rich clumps observed by JWST. However, it remains to be demonstrated whether such structures can accurately reproduce the specific distribution of clumps and expansion velocities observed in SN 1987A.
As an alternative to neutrino-driven models, magneto-rotational SNe (MR-SNe) may help to explain some of the observed features better (Wheeler et al. 2002; Akiyama et al. 2003; Takiwaki et al. 2004, 2009; Obergaulinger et al. 2006, 2009; Mösta et al. 2014). These core-collapse explosions are driven by the rapid rotation and strong magnetic fields of their progenitor stars. In MR-SNe, differential rotation amplifies magnetic fields through the magnetorotational instability, generating powerful magnetic stresses that launch highly energetic and often asymmetric Ni-rich jet-like structures (e.g., Obergaulinger & Aloy 2021). While MR-SNe can produce hypernova-like energies, potentially contrasting with those observed in SN 1987A, their distinct bipolar ejecta morphologies could provide a plausible explanation for the fast Fe-rich ejecta and the apparent separation of clumps observed by JWST. However, MR-SNe tend to produce well-aligned, collimated bipolar structures. The observed broken-dipole morphology of SN 1987A, consisting of two main clumps separated by approximately 135° and an additional smaller clump interacting with the reverse shock (Larsson et al. 2023), appears more complex than standard MR-SN predictions. Further simulations are required to investigate whether MR-SNe can accommodate such deviations from symmetry.
A further challenge for neutrino-driven models is the existence of two clearly distinct Fe-rich clumps in the JWST data (Larsson et al. 2023). Whether this apparent separation reflects an intrinsic feature of the ejecta or arises from observational limitations (e.g., limited sensitivity to the remnant’s central regions) remains an open question. In general, neutrino-driven simulations predict centrally peaked Fe distributions, without persistent large-scale separations. Even the B18.3-Dec model presented here, which initially shows two clumps due to asymmetric ejection, ultimately yields a merged structure after expansion and decay heating. In contrast, early (t < 10 s) MR-SN simulations (e.g., Obergaulinger & Aloy 2021; Reichert et al. 2023) reveal highly asymmetric ejecta, with Fe-rich components concentrated in apparently well-separated lobes, which may account for the two Fe-rich clumps observed by JWST. However, the long-term evolution of these structures beyond t ~ 10 s remains largely unexplored and it is unclear whether the observed clumpiness can persist on the age of SN 1987A.
Taken together, these considerations suggest that the Fe distribution in the central regions of the remnant may provide a key diagnostic for discriminating between competing explosion scenarios. Neutrino-driven explosions typically leave behind a centrally concentrated Fe-rich component, while MR-SNe may produce reduced central Fe abundance due to efficient evacuation by jets. Thus, future high-resolution observations of the remnant’s center could be decisive in discriminating between these scenarios for SN 1987A.
Despite their potential to explain several features of SN 1987A, MR-SNe also present substantial challenges. First, the progenitor of SN 1987A (a BSG likely resulting from binary evolution; Morris & Podsiadlowski 2007) does not satisfy the typical conditions associated with MR-SNe, which usually require rapidly rotating progenitors with strong pre-collapse magnetic fields (e.g., Woosley 2010; Mösta et al. 2015; Aloy & Obergaulinger 2021). Second, SN 1987A behaves similarly to a standard Type IIP SN in terms of its explosion properties, with the unusual light curve originating from the loss of H during the progenitor’s merger (Utrobin et al. 2021). Third, the observed ejecta morphology, while suggestive of bipolarity, does not conform to the highly collimated jets expected from MR-SNe. Finally, MR-SNe are thought to produce highly magnetized compact remnants (magnetars; e.g., Mösta et al. 2014; Aloy & Obergaulinger 2021). Although recent studies suggest the presence of a compact object near the remnant’s center (e.g., Cigan et al. 2019; Greco et al. 2021, 2022; Fransson et al. 2024), the observed emission is less energetic than expected from magnetars, which typically exhibit high spin-down energy outputs (Kaspi & Beloborodov 2017; Rea & De Grandis 2025). Such a source would either be too bright at present or would have already spun down, depositing its energy earlier and making SN 1987A significantly brighter than observed.
In summary, while both neutrino-driven and magnetorota-tional explosion models offer viable pathways to account for several observed features of SN 1987A, neither scenario fully captures the complexity revealed by current observations. This tension underscores the necessity for more advanced simulations and complementary observational efforts. High-resolution, multi-dimensional models exploring a broader range of explosion geometries, including more extreme asymmetries (Ono et al., in prep.), will be key to resolving the discrepancies between existing models and the JWST data. Unraveling the origin of the nearly bipolar morphology of SN 1987A will critically depend on these developments.
In the coming years, the synergy between next-generation instruments, including JWST and XRISM (along with future missions such as AXIS and NewAthena), and increasingly sophisticated theoretical models will offer unprecedented constraints on the kinematics, morphology, and composition of the ejecta in SN 1987A. In particular, monitoring the evolution of Fe-rich clumps as they interact with the reverse shock, characterizing the X-ray emission from shocked ejecta, and investigating potential non-thermal emission from a pulsar wind nebula will be crucial diagnostics. These efforts will not only shed light on the origin of the explosion asymmetries in SN 1987A but also provide valuable insights into the physical mechanisms driving core-collapse SNe more broadly.
Data availability
JWST NIRCam data in Fig. 3 (Program ID: 1726; PI: Dr. Mikako Matsuura) were retrieved from the MAST archive, and can be found in https://doi.org/10.17909/nnwr-ea73. Interactive graphics and datasets related to Figs. 4, 5, and 15 are available on Zenodo at https://doi.org/10.5281/zenodo.15350875
Acknowledgements
We thank an anonymous referee for the useful suggestions that allowed us to improve the manuscript. S.O. is grateful to Thomas Janka (Max-Planck-Institut für Astrophysik) for insightful discussions on the physics of neutrino-driven supernovae and the evolution of SN 1987A. The PLUTO code is developed at the Turin Astronomical Observatory (Italy) in collaboration with the Department of General Physics of Turin University (Italy) and the SCAI Department of CINECA (Italy). We acknowledge that part of the results of this research have been achieved using the PRACE Research Infrastructure resource Marconi based in Italy at CINECA (PRACE Award No. 2016153460). Additional computations were carried out on the HPC system Leonardo hosted at CINECA (HP10BUMIQR) and on the HPC system MEUSA at the SCAN (Sistema di Calcolo per l’Astrofisica Numerica) facility for HPC at INAF-Osservatorio Astronomico di Palermo. S.O., M.M., F.B., and V.S. acknowledge financial contribution from the PRIN 2022 (20224MNC5A) -“Life, death and after-death of massive stars” funded by European Union - Next Generation EU. S.O., M.M., F.B., E.G., and O.P. acknowledge financial contribution from the INAF Theory Grant “Supernova remnants as probes for the structure and mass-loss history of the progenitor systems”. M.M. acknowledges support by the Fondazione ICSC, Spoke 3 Astrophysics and Cosmos Observations. National Recovery and Resilience Plan (Piano Nazionale di Ripresa e Resilienza, PNRR) Project ID CN_00000013 “Italian Research Center on High-Performance Computing, Big Data and Quantum Computing” funded by MUR Missione 4 Componente 2 Investimento 1.4: Potenziamento strutture di ricerca e creazione di “campioni nazionali di R&S (M4C2-19 )” - Next Generation EU (NGEU). S.N. is supported by the JST ASPIRE project for top scientists, “RIKEN-Berkeley Mathematical Quantum Science Initiative”. SHL is supported by JSPS grant No. JP24K07092 and the World Premier International Research Center Initiative (WPI), MEXT, Japan. O.P. acknowledges partial support through the MSCA4Ukraine project from the European Union. Views and opinions expressed are however those of the authors only and do not necessarily reflect those of the European Union. Neither the European Union nor the MSCA4Ukraine Consortium as a whole nor any individual member institutions of the MSCA4Ukraine Consortium can be held responsible for them. M.-A.A., M.G., G.L.M., M.Obe. and B.G. acknowledge the support through the grant PID2021-127495NB-I00 funded by MCIN/AEI/10.13039/501100011033 and by the European Union, and the Astrophysics and High Energy Physics programme of the Generalitat Valenciana ASFAE/2022/026 funded by MCIN and the European Union NextGenerationEU (PRTR-C17.I1). M.-A.A. and M.Ono further acknowledge the support through the Generalitat Valenciana via Prometeo excellence programme grant CIPROM/2022/13. M.G., G.L.M., and B.G. further acknowledge the support through the Generalitat Valenciana via the grant CIDEGENT/2019/031.
References
- Abellán, F. J., Indebetouw, R., Marcaide, J. M., et al. 2017, ApJ, 842, L24 [Google Scholar]
- Akiyama, S., Wheeler, J. C., Meier, D. L., & Lichtenstadt, I. 2003, ApJ, 584, 954 [NASA ADS] [CrossRef] [Google Scholar]
- Aloy, M. Á., & Obergaulinger, M. 2021, MNRAS, 500, 4365 [Google Scholar]
- Bear, E., & Soker, N. 2018, MNRAS, 478, 682 [NASA ADS] [Google Scholar]
- Blondin, J. M., Mezzacappa, A., & DeMarino, C. 2003, ApJ, 584, 971 [NASA ADS] [CrossRef] [Google Scholar]
- Boggs, S. E., Harrison, F. A., Miyasaka, H., et al. 2015, Science, 348, 670 [Google Scholar]
- Bollig, R., Yadav, N., Kresse, D., et al. 2021, ApJ, 915, 28 [NASA ADS] [CrossRef] [Google Scholar]
- Burrows, A., & Vartanyan, D. 2021, Nature, 589, 29 [CrossRef] [PubMed] [Google Scholar]
- Burrows, A., Wang, T., & Vartanyan, D. 2024, ApJ, 964, L16 [NASA ADS] [CrossRef] [Google Scholar]
- Chevalier, R. A., & Dwarkadas, V. V. 1995, ApJ, 452, L45 [Google Scholar]
- Cigan, P., Matsuura, M., Gomez, H. L., et al. 2019, ApJ, 886, 51 [NASA ADS] [CrossRef] [Google Scholar]
- Colgan, S. W. J., Haas, M. R., Erickson, E. F., Lord, S. D., & Hollenbach, D. J. 1994, ApJ, 427, 874 [Google Scholar]
- Crotts, A. P. S., Kunkel, W. E., & McCarthy, P. J. 1989, ApJ, 347, L61 [Google Scholar]
- Dohi, A., Greco, E., Nagataki, S., et al. 2023, ApJ, 949, 97 [Google Scholar]
- Dwek, E., Arendt, R. G., Bouchet, P., et al. 2010, ApJ, 722, 425 [NASA ADS] [CrossRef] [Google Scholar]
- Frank, K. A., Zhekov, S. A., Park, S., et al. 2016, ApJ, 829, 40 [Google Scholar]
- Fransson, C., Barlow, M. J., Kavanagh, P. J., et al. 2024, Science, 383, 898 [NASA ADS] [CrossRef] [Google Scholar]
- Fryxell, B., Olson, K., Ricker, P., et al. 2000, ApJS, 131, 273 [Google Scholar]
- Gabler, M., Wongwathanarat, A., & Janka, H.-T. 2021, MNRAS, 502, 3264 [CrossRef] [Google Scholar]
- Ghavamian, P., Laming, J. M., & Rakowski, C. E. 2007, ApJ, 654, L69 [NASA ADS] [CrossRef] [Google Scholar]
- Greco, E., Miceli, M., Orlando, S., et al. 2021, ApJ, 908, L45 [NASA ADS] [CrossRef] [Google Scholar]
- Greco, E., Miceli, M., Orlando, S., et al. 2022, ApJ, 931, 132 [Google Scholar]
- Haas, M. R., Colgan, S. W. J., Erickson, E. F., et al. 1990, ApJ, 360, 257 [NASA ADS] [CrossRef] [Google Scholar]
- Haberl, F., Geppert, U., Aschenbach, B., & Hasinger, G. 2006, A&A, 460, 811 [NASA ADS] [CrossRef] [EDP Sciences] [Google Scholar]
- Helder, E. A., Broos, P. S., Dewey, D., et al. 2013, ApJ, 764, 11 [Google Scholar]
- Herant, M., & Benz, W. 1992, ApJ, 387, 294 [Google Scholar]
- Hungerford, A. L., Fryer, C. L., & Rockefeller, G. 2005, ApJ, 635, 487 [NASA ADS] [CrossRef] [Google Scholar]
- Janka, H.-T. 2017a, “Neutrino-Driven Explosions” chapter in Handbook of Supernovae, eds. A. W. Alsabti & P. Murdin (Switzerland: Springer International Publishing), 1095, ISBN 978-3-319-21845-8 [Google Scholar]
- Janka, H.-T. 2017b, ApJ, 837, 84 [Google Scholar]
- Janka, H. T. 2025, Annual Review of Nuclear and Particle Science, submitted [arXiv:2502.14836] [Google Scholar]
- Janka, H.-T., Melson, T., & Summa, A. 2016, Annu. Rev. Nucl. Part. Sci., 66, 341 [Google Scholar]
- Janka, H.-T., Gabler, M., & Wongwathanarat, A. 2017, in IAU Symposium, 331, Supernova 1987A:30 years later - Cosmic Rays and Nuclei from Supernovae and their Aftermaths, eds. A. Marcowith, M. Renaud, G. Dubner, A. Ray, & A. Bykov, 148 [Google Scholar]
- Jerkstrand, A., Wongwathanarat, A., Janka, H. T., et al. 2020, MNRAS, 494, 2471 [Google Scholar]
- Jones, O. C., Kavanagh, P. J., Barlow, M. J., et al. 2023, ApJ, 958, 95 [CrossRef] [Google Scholar]
- Kaspi, V. M., & Beloborodov, A. M. 2017, ARA&A, 55, 261 [Google Scholar]
- Khokhlov, A. M., Höflich, P. A., Oran, E. S., et al. 1999, ApJ, 524, L107 [NASA ADS] [CrossRef] [Google Scholar]
- Kjær, K., Leibundgut, B., Fransson, C., Jerkstrand, A., & Spyromilio, J. 2010, A&A, 517, A51 [NASA ADS] [CrossRef] [EDP Sciences] [Google Scholar]
- Larsson, J., Fransson, C., Östlin, G., et al. 2011, Nature, 474, 484 [Google Scholar]
- Larsson, J., Fransson, C., Kjaer, K., et al. 2013, ApJ, 768, 89 [NASA ADS] [CrossRef] [Google Scholar]
- Larsson, J., Fransson, C., Spyromilio, J., et al. 2016, ApJ, 833, 147 [NASA ADS] [CrossRef] [Google Scholar]
- Larsson, J., Fransson, C., Sargent, B., et al. 2023, ApJ, 949, L27 [NASA ADS] [CrossRef] [Google Scholar]
- MacNeice, P., Olson, K. M., Mobarry, C., de Fainchtein, R., & Packer, C. 2000, Comput. Phys. Commun., 126, 330 [NASA ADS] [CrossRef] [Google Scholar]
- Maggi, P., Haberl, F., Sturm, R., & Dewey, D. 2012, A&A, 548, L3 [NASA ADS] [CrossRef] [EDP Sciences] [Google Scholar]
- Matsuura, M., Boyer, M., Arendt, R. G., et al. 2024, MNRAS, 532, 3625 [Google Scholar]
- Miceli, M., Orlando, S., Burrows, D. N., et al. 2019, Nat. Astron., 3, 236 [Google Scholar]
- Mignone, A., Bodo, G., Massaglia, S., et al. 2007, ApJS, 170, 228 [Google Scholar]
- Mignone, A., Zanni, C., Tzeferacos, P., et al. 2012, ApJS, 198, 7 [Google Scholar]
- Morris, T., & Podsiadlowski, P. 2007, Science, 315, 1103 [Google Scholar]
- Mösta, P., Richers, S., Ott, C. D., et al. 2014, ApJ, 785, L29 [CrossRef] [Google Scholar]
- Mösta, P., Ott, C. D., Radice, D., et al. 2015, Nature, 528, 376 [CrossRef] [Google Scholar]
- Müller, B. 2016, PASA, 33, e048 [Google Scholar]
- Müller, B. 2020, Liv. Rev. Computat. Astrophys., 6, 3 [Google Scholar]
- Nagataki, S. 2000, ApJS, 127, 141 [NASA ADS] [CrossRef] [Google Scholar]
- Nagataki, S., Hashimoto, M., Sato, K., & Yamada, S. 1997, ApJ, 486, 1026 [Google Scholar]
- Nagataki, S., Shimizu, T. M., & Sato, K. 1998, ApJ, 495, 413 [Google Scholar]
- Nomoto, K., & Hashimoto, M. 1988, Phys. Rep., 163, 13 [CrossRef] [Google Scholar]
- Obergaulinger, M., & Aloy, M. Á. 2020, MNRAS, 492, 4613 [Google Scholar]
- Obergaulinger, M., & Aloy, M. Á. 2021, MNRAS, 503, 4942 [NASA ADS] [CrossRef] [Google Scholar]
- Obergaulinger, M., Aloy, M. A., & Müller, E. 2006, A&A, 450, 1107 [NASA ADS] [CrossRef] [EDP Sciences] [Google Scholar]
- Obergaulinger, M., Cerdá-Durán, P., Müller, E., & Aloy, M. A. 2009, A&A, 498, 241 [NASA ADS] [CrossRef] [EDP Sciences] [Google Scholar]
- Ono, M., Nagataki, S., Ito, H., et al. 2013, ApJ, 773, 161 [Google Scholar]
- Ono, M., Nagataki, S., Ferrand, G., et al. 2020, ApJ, 888, 111 [NASA ADS] [CrossRef] [Google Scholar]
- Ono, M., Nozawa, T., Nagataki, S., et al. 2024, ApJS, 271, 33 [Google Scholar]
- Orlando, S., Bocchino, F., Reale, F., Peres, G., & Pagano, P. 2008, ApJ, 678, 274 [NASA ADS] [CrossRef] [Google Scholar]
- Orlando, S., Miceli, M., Pumo, M. L., & Bocchino, F. 2015, ApJ, 810, 168 [NASA ADS] [CrossRef] [Google Scholar]
- Orlando, S., Miceli, M., Pumo, M. L., & Bocchino, F. 2016, ApJ, 822, 22 [Google Scholar]
- Orlando, S., Miceli, M., Petruk, O., et al. 2019, A&A, 622, A73 [NASA ADS] [CrossRef] [EDP Sciences] [Google Scholar]
- Orlando, S., Ono, M., Nagataki, S., et al. 2020, A&A, 636, A22 [NASA ADS] [CrossRef] [EDP Sciences] [Google Scholar]
- Orlando, S., Wongwathanarat, A., Janka, H. T., et al. 2021, A&A, 645, A66 [EDP Sciences] [Google Scholar]
- Orlando, S., Wongwathanarat, A., Janka, H. T., et al. 2022, A&A, 666, A2 [NASA ADS] [CrossRef] [EDP Sciences] [Google Scholar]
- Orlando, S., Greco, E., Hirai, R., et al. 2024a, ApJ, 977, 118 [Google Scholar]
- Orlando, S., Miceli, M., Patnaude, D. J., et al. 2024b, arXiv e-prints [arXiv:2408.12462] [Google Scholar]
- Orlando, S., Janka, H. T., Wongwathanarat, A., et al. 2025a, A&A, 696, A188 [NASA ADS] [CrossRef] [EDP Sciences] [Google Scholar]
- Orlando, S., Janka, H. T., Wongwathanarat, A., et al. 2025b, A&A, 696, A108 [NASA ADS] [CrossRef] [EDP Sciences] [Google Scholar]
- Page, D., Beznogov, M. V., Garibay, I., et al. 2020, ApJ, 898, 125 [Google Scholar]
- Panagia, N. 1999, in IAU Symposium, 190, New Views of the Magellanic Clouds, eds. Y.-H. Chu, N. Suntzeff, J. Hesser, & D. Bohlender, 549 [Google Scholar]
- Park, S., Zhekov, S. A., Burrows, D. N., et al. 2006, ApJ, 646, 1001 [NASA ADS] [CrossRef] [Google Scholar]
- Parker, E. N. 1958, ApJ, 128, 664 [Google Scholar]
- Perego, A., Hempel, M., Fröhlich, C., et al. 2015, ApJ, 806, 275 [NASA ADS] [CrossRef] [Google Scholar]
- Petruk, O., Beshley, V., Orlando, S., et al. 2023, MNRAS, 518, 6377 [Google Scholar]
- Ravi, A. P., Park, S., Zhekov, S. A., et al. 2021, ApJ, 922, 140 [Google Scholar]
- Ravi, A. P., Park, S., Zhekov, S. A., et al. 2024, ApJ, 966, 147 [Google Scholar]
- Rea, N., & De Grandis, D. 2025, arXiv e-prints [arXiv:2503.04442] [Google Scholar]
- Reichert, M., Obergaulinger, M., Aloy, M. Á., et al. 2023, MNRAS, 518, 1557 [Google Scholar]
- Sapienza, V., Miceli, M., Bamba, A., et al. 2024a, ApJ, 961, L9 [Google Scholar]
- Sapienza, V., Miceli, M., Bamba, A., et al. 2024b, RNAAS, 8, 156 [Google Scholar]
- Sieverding, A., Kresse, D., & Janka, H.-T. 2023, ApJ, 957, L25 [NASA ADS] [CrossRef] [Google Scholar]
- Smith, R. K., Brickhouse, N. S., Liedahl, D. A., & Raymond, J. C. 2001, ApJ, 556, L91 [Google Scholar]
- Soker, N. 2024a, Galaxies, 12, 29 [Google Scholar]
- Soker, N. 2024b, Res. Astron. Astrophys., 24, 075006 [Google Scholar]
- Sugerman, B. E. K., Crotts, A. P. S., Kunkel, W. E., Heathcote, S. R., & Lawrence, S. S. 2005, ApJS, 159, 60 [NASA ADS] [CrossRef] [Google Scholar]
- Sukhbold, T., Woosley, S. E., & Heger, A. 2018, ApJ, 860, 93 [NASA ADS] [CrossRef] [Google Scholar]
- Sun, L., Vink, J., Chen, Y., et al. 2021, ApJ, 916, 41 [NASA ADS] [CrossRef] [Google Scholar]
- Sun, L., Orlando, S., Greco, E., et al. 2025, ApJ, 981, 26 [Google Scholar]
- Takiwaki, T., Kotake, K., Nagataki, S., & Sato, K. 2004, ApJ, 616, 1086 [Google Scholar]
- Takiwaki, T., Kotake, K., & Sato, K. 2009, ApJ, 691, 1360 [NASA ADS] [CrossRef] [Google Scholar]
- Timmes, F. X., & Swesty, F. D. 2000, ApJS, 126, 501 [NASA ADS] [CrossRef] [Google Scholar]
- Tziamtzis, A., Lundqvist, P., Gröningsson, P., & Nasoudi-Shoar, S. 2011, A&A, 527, A35 [NASA ADS] [CrossRef] [EDP Sciences] [Google Scholar]
- Urushibata, T., Takahashi, K., Umeda, H., & Yoshida, T. 2018, MNRAS, 473, L101 [CrossRef] [Google Scholar]
- Ustamujic, S., Orlando, S., Miceli, M., et al. 2021, A&A, 654, A167 [NASA ADS] [CrossRef] [EDP Sciences] [Google Scholar]
- Utrobin, V. P., Chugai, N. N., & Andronova, A. A. 1995, A&A, 295, 129 [NASA ADS] [Google Scholar]
- Utrobin, V. P., Wongwathanarat, A., Janka, H. T., & Müller, E. 2015, A&A, 581, A40 [NASA ADS] [CrossRef] [EDP Sciences] [Google Scholar]
- Utrobin, V. P., Wongwathanarat, A., Janka, H. T., et al. 2019, A&A, 624, A116 [NASA ADS] [CrossRef] [EDP Sciences] [Google Scholar]
- Utrobin, V. P., Wongwathanarat, A., Janka, H. T., et al. 2021, ApJ, 914, 4 [NASA ADS] [CrossRef] [Google Scholar]
- Wang, T., & Burrows, A. 2024, ApJ, 974, 39 [Google Scholar]
- Wang, L., Wheeler, J. C., Höflich, P., et al. 2002, ApJ, 579, 671 [Google Scholar]
- Wheeler, J. C., Meier, D. L., & Wilson, J. R. 2002, ApJ, 568, 807 [Google Scholar]
- Wongwathanarat, A., Müller, E., & Janka, H.-T. 2015, A&A, 577, A48 [NASA ADS] [CrossRef] [EDP Sciences] [Google Scholar]
- Woosley, S. E. 2010, ApJ, 719, L204 [NASA ADS] [CrossRef] [Google Scholar]
- Zanardo, G., Staveley-Smith, L., Gaensler, B. M., et al. 2018, ApJ, 861, L9 [NASA ADS] [CrossRef] [Google Scholar]
- Zhekov, S. A., McCray, R., Dewey, D., et al. 2009, ApJ, 692, 1190 [NASA ADS] [CrossRef] [Google Scholar]
SN 1987A was observed on 2024-06-17 for a total of 348 866 s (OBS ID 300021010) during the performance verification phase.
The simulations produced one snapshot per year; the selected snapshot is the one nearest in time to the observational data.
All Tables
All Figures
|
Fig. 1 Evolution of the shocked ejecta mass (in units of M⊙) in log scale for various species as derived from models B18.3 (top panel) and B18.3-Dec (bottom). Different colors represent specific elements, as indicated by the labels. The black solid, dashed, and dotted lines represent the total shocked ejecta mass, the shocked CSM mass (including the H II region and the rings), and the mass of shocked material from the equatorial ring, respectively. Due to their low mass content, Ar, Cr, and Ti are barely visible in the figure. |
| In the text | |
|
Fig. 2 Mass distributions of ejecta species as a function of LoS velocity, derived from models B18.3 (left panels) and B18.3-Dec (right panels) at a remnant age of 37 years (2024). The color bars at the bottom of the figure correspond to their respective columns and are specific to the model represented in each column. The upper panels show the velocity distributions across the entire remnant, while the middle and lower panels correspond to the northern and southern hemispheres, respectively. Crosses mark the mass-weighted average LoS velocity for each species, while the horizontal lines indicate the velocity range where the ejecta mass fraction exceeds 50% of the peak mass fraction. |
| In the text | |
|
Fig. 3 Upper panels: Comparison between JWST observations of SN 1987A from September 1-2, 2022 (left column), and the density distribution of the remnant-including both shocked plasma and unshocked Fe-rich ejecta-predicted by models B18.3 (Paper I; center column) and B18.3-Dec (right column) as of February 2023. Lower panels: Same as the upper panels but with identical ellipsoids overlaid on all images as a reference for comparing the large-scale morphology of the remnant across observations and models. The dashed line at the remnant’s center marks the approximate orientation of the homunculus’ major axis. While the model-generated images reproduce the general structure of the remnant, they are not intended to exactly match the observed appearance. The original JWST image was created by Alyssa Pagan (STScI), and the image credits belong to NASA, ESA, CSA, Mikako Matsuura (Cardiff University), Richard Arendt (NASA-GSFC, UMBC), Claes Fransson (Stockholm University), and Josefin Larsson (KTH). |
| In the text | |
|
Fig. 4 Three-dimensional volume rendering of He-rich ejecta near the reverse shock, with opacity scaled to reflect density variations, shown from different viewing angles. The visualization is based on model B18.3 at t = 36 years after the SN (corresponding to February 2023). The color bar in the upper right indicates the He density. The blue circle indicates the nominal position of the equatorial ring. Earth’s vantage point corresponds to the negative y-axis. |
| In the text | |
|
Fig. 5 Three-dimensional volume rendering of Fe-rich ejecta, with opacity scaled to reflect density variations, shown from different viewing angles. The visualization is based on model B18.3 (upper panels) and B18.3-Dec (lower panels) at t = 36 years after the SN (corresponding to February 2023). The color bars on the right indicate the Fe density for each case. The blue circle marks the nominal position of the equatorial ring, while the semi-transparent diffuse structure represents the distribution of He-rich ejecta near the reverse shock, as shown in Fig. 4. Earth’s vantage point corresponds to the negative y-axis. |
| In the text | |
|
Fig. 6 Distribution of Fe-rich ejecta from model B18.3 at t ≈ 36 years after core collapse (corresponding to February 2023) as a function of velocity along the y-axis (LoS), ranging from vy = -2500 km s-1 (top-left panel, near side of the remnant) to vy = 3500 km s-1 (bottom-right panel, far side of the remnant). Each panel shows the Fe-mass density integrated over a 500 km s-1 velocity interval along vy , with the corresponding range labeled above each frame. The color scale (top left of the figure) indicates the normalized column density of Fe. The axes represent velocity components in the plane of the sky: vx (east-west direction) and vz (south-north direction). |
| In the text | |
|
Fig. 7 Same as Fig. 6, but for model B18.3-Dec. The figure illustrates the impact of Ni-bubble effects on the distribution and expansion of Fe-rich ejecta. The normalization of the column density differs from that in Fig. 6. |
| In the text | |
|
Fig. 8 Mass distributions of Fe-rich ejecta as a function of the velocity component along the LoS (upper panel) and the radial velocity (lower panel) at t ≈ 36 years after core collapse (corresponding to February 2023) for models B18.3 (dashed lines) and B18.3-Dec (solid lines). Red and blue curves represent the results for the southern and northern hemispheres, respectively. |
| In the text | |
|
Fig. 9 Profiles of continuum-subtracted [Fe II] (25.99 μm; black line) and [Fe I] (1.44 μm; red line) emission lines from the inner ejecta of SN 1987A, as observed on July 16, 2022, with JWST (Jones et al. 2023). These are compared with the total mass distribution of unshocked Fe-rich ejecta as a function of the LoS velocity, predicted by model B18.3-Dec for February 2023 (solid blue line). The dashed blue line represents the Fe mass distribution with an artificially increased LoS velocity (by 35%) to better match the JWST observations (Larsson et al. 2023). The Fe mass distributions have been normalized to roughly match the peak of [Fe I] line. |
| In the text | |
|
Fig. 10 Distributions of EM as a function of electron temperature (kTe) and ionization timescale (τ = net) at the labeled times for models B18.3 (upper panels) and B18.3-Dec (lower panels). The panels present three-color composite images of the EM distributions, where different colors represent contributions from distinct shocked plasma components: shocked CSM (red), shocked material from the H envelope (green), and shocked Fe-rich ejecta (blue). White contours highlight the regions dominated by Fe. |
| In the text | |
|
Fig. 11 Normalized EM distributions (in log scale, with the maximum value indicated in the upper-right corner of each panel; the EM is in units of cm-3) as a function of LoS velocity for (from top to bottom) shocked O, Si, S, Ar, and Fe, as derived from models B18.3 (dashed lines) and B18.3-Dec (solid lines) at three epochs: 2024 (left panels), 2027 (center panels), and 2037 (right panels). Each panel displays the total distribution (black line) along with individual contributions from the species in the shocked CSM (blue), the shocked H envelope (assuming CSM-like abundances; green), and the shocked inner (pure) ejecta (violet). |
| In the text | |
|
Fig. 12 Full XRISM Resolve spectra in the [1.0, 10.0] keV energy range synthesized from models B18.3 (on the left) and B18.3-Dec (on the right) at the labeled times. The spectra (shown as gray crosses) were computed assuming an exposure time of 500 ks. For reference, the figure also shows the ideal synthetic spectra (black lines) along with the contributions from individual plasma components: shocked CSM (blue), shocked H envelope (green), and shocked pure ejecta (violet). No significant signal is detected below 1.8 keV due to the XRISM gate valve remaining closed, which prevents soft X-ray photons from reaching the detector. |
| In the text | |
|
Fig. 13 XRISM Resolve spectra synthesized from model B18.3-Dec at three epochs: 2024 (left panels), 2027 (center panels), and 2037 (right panels). The figure presents close-up views of selected emission lines: Si XIV (2.1 keV), S XV (2.46 keV), Ar XVII (3.14 keV), Fe XXV (6.7 keV). Each panel shows the synthetic spectra of SN 1987A as observed with XRISM Resolve (shown as gray crosses), assuming an exposure time of 500 ks. Also included are the ideal synthetic spectra (black lines) and the contributions from different plasma components: shocked CSM (blue), shocked H envelope (green), and shocked pure ejecta (violet). The total contribution from shocked ejecta (H envelope + pure ejecta) is highlighted by the shaded yellow region. The top axis of each panel indicates the corresponding Doppler shift velocities relative to the rest-frame wavelength of each line. |
| In the text | |
|
Fig. 14 Same as the bottom-right panel in Fig. 13 at the age of 50 years (corresponding to 2037) but for the Fe XXV line synthesized from model B18.3. |
| In the text | |
|
Fig. 15 Predicted long-term evolution of SN 1987A over the next 5000 years based on model B18.3. The left panels show cross-sections of the mass density distribution (in log scale, in units of g cm-3) in a plane perpendicular to the equatorial ring, passing through the explosion center, at four different epochs (see labeled times). The right panels present the corresponding synthetic thermal X-ray emission maps in the [0.5, 2.0] keV (on the left) and [3.0, 10.0] keV (on the right) bands, assuming an orientation consistent with that of SN 1987A. Each X-ray image is normalized to its maximum for visibility, and the maps are convolved with a Gaussian of 0.1 arcsec to approximate the spatial resolution of Chandra. |
| In the text | |
|
Fig. 16 XRISM Resolve spectra synthesized from model B18.3 at an age of 500 years (corresponding to the year 2487). The upper panel displays the full spectrum in the [1.0, 10.0] keV energy range, while the four lower panels provide close-up views of selected emission lines: Si XIV (2.1 keV), SXV (2.46 keV), Ar XVII (3.14 keV), Fe XXV (6.7 keV). The top axis of each lower panel represents the corresponding Doppler shift velocities relative to the rest-frame wavelength of each line. The figure includes the ideal synthetic spectra (black lines) and the contributions from individual plasma components: shocked CSM (blue), shocked H envelope (green), and shocked pure ejecta (violet). The lower panels emphasize the contribution from shocked ejecta (H envelope + pure ejecta) using a shaded yellow region. |
| In the text | |
Current usage metrics show cumulative count of Article Views (full-text article views including HTML views, PDF and ePub downloads, according to the available data) and Abstracts Views on Vision4Press platform.
Data correspond to usage on the plateform after 2015. The current usage metrics is available 48-96 hours after online publication and is updated daily on week days.
Initial download of the metrics may take a while.