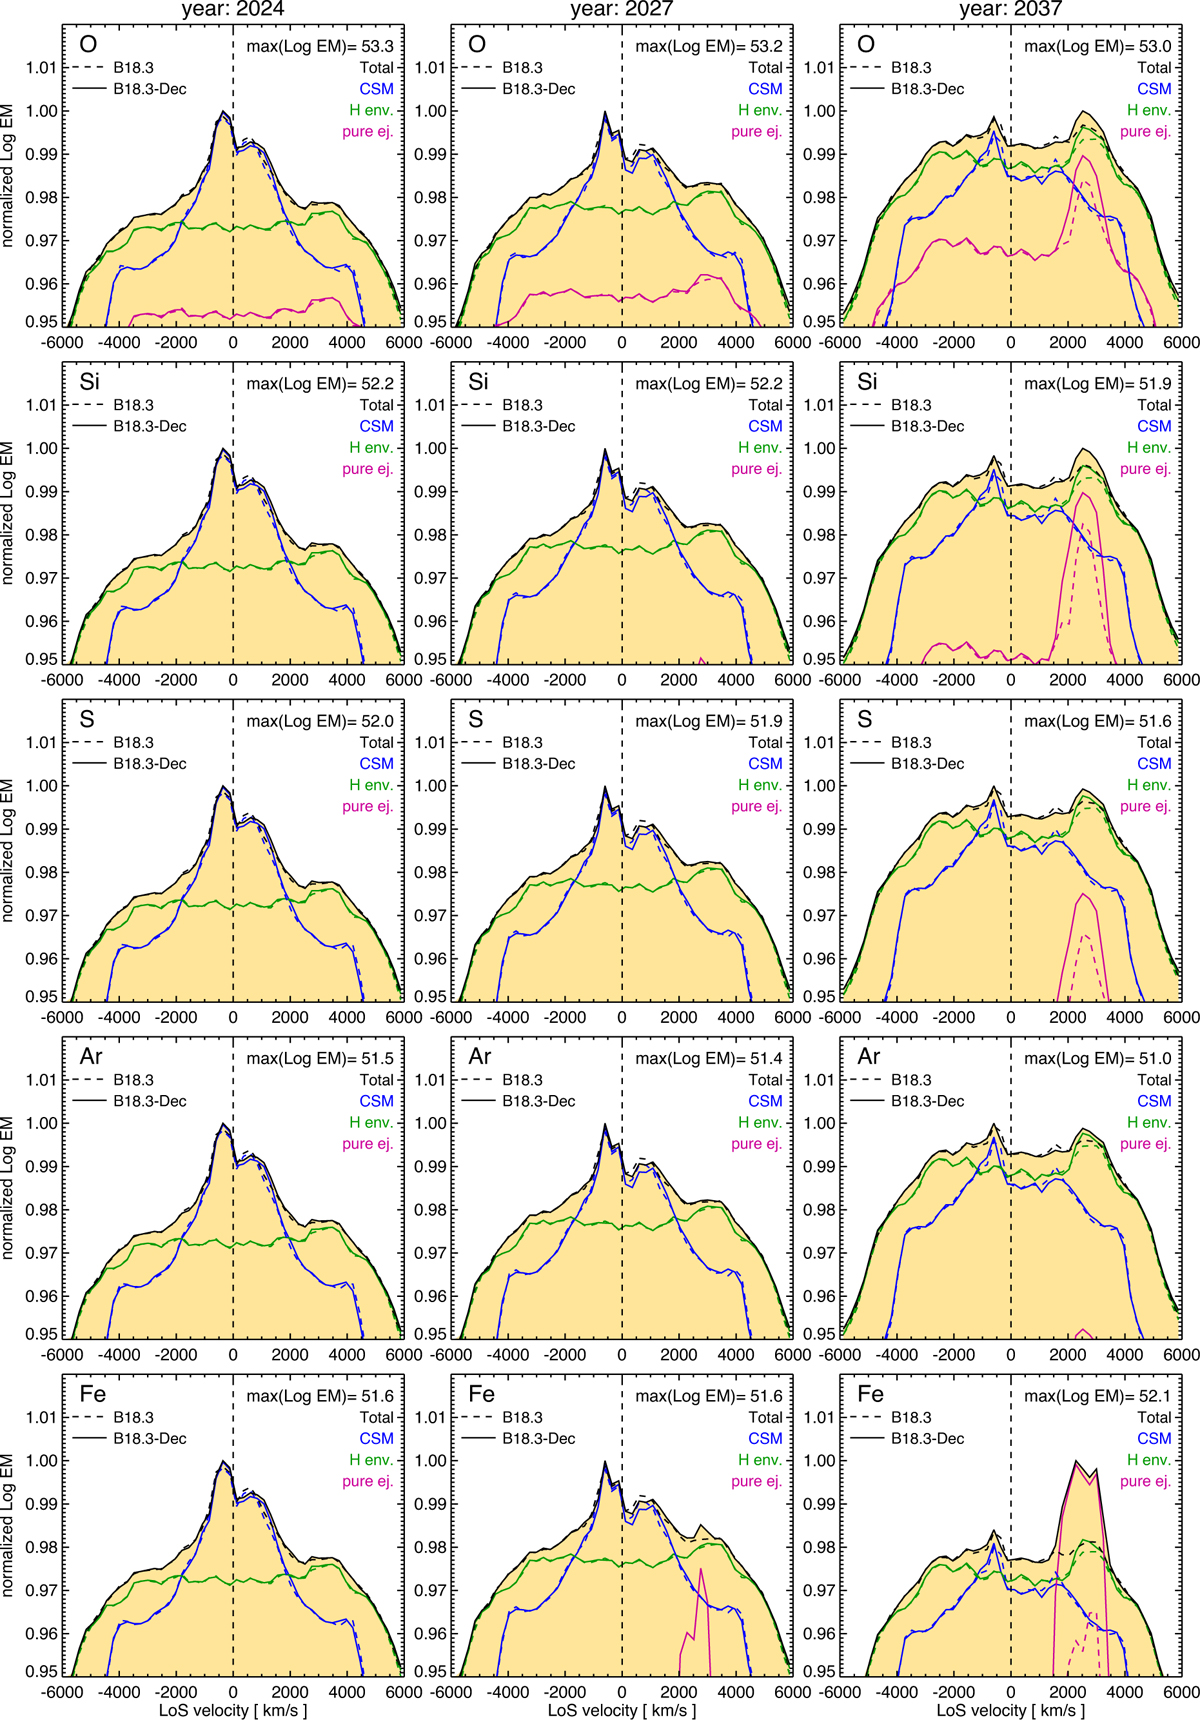
Fig. 11
Download original image
Normalized EM distributions (in log scale, with the maximum value indicated in the upper-right corner of each panel; the EM is in units of cm-3) as a function of LoS velocity for (from top to bottom) shocked O, Si, S, Ar, and Fe, as derived from models B18.3 (dashed lines) and B18.3-Dec (solid lines) at three epochs: 2024 (left panels), 2027 (center panels), and 2037 (right panels). Each panel displays the total distribution (black line) along with individual contributions from the species in the shocked CSM (blue), the shocked H envelope (assuming CSM-like abundances; green), and the shocked inner (pure) ejecta (violet).
Current usage metrics show cumulative count of Article Views (full-text article views including HTML views, PDF and ePub downloads, according to the available data) and Abstracts Views on Vision4Press platform.
Data correspond to usage on the plateform after 2015. The current usage metrics is available 48-96 hours after online publication and is updated daily on week days.
Initial download of the metrics may take a while.