Fig. 10
Download original image
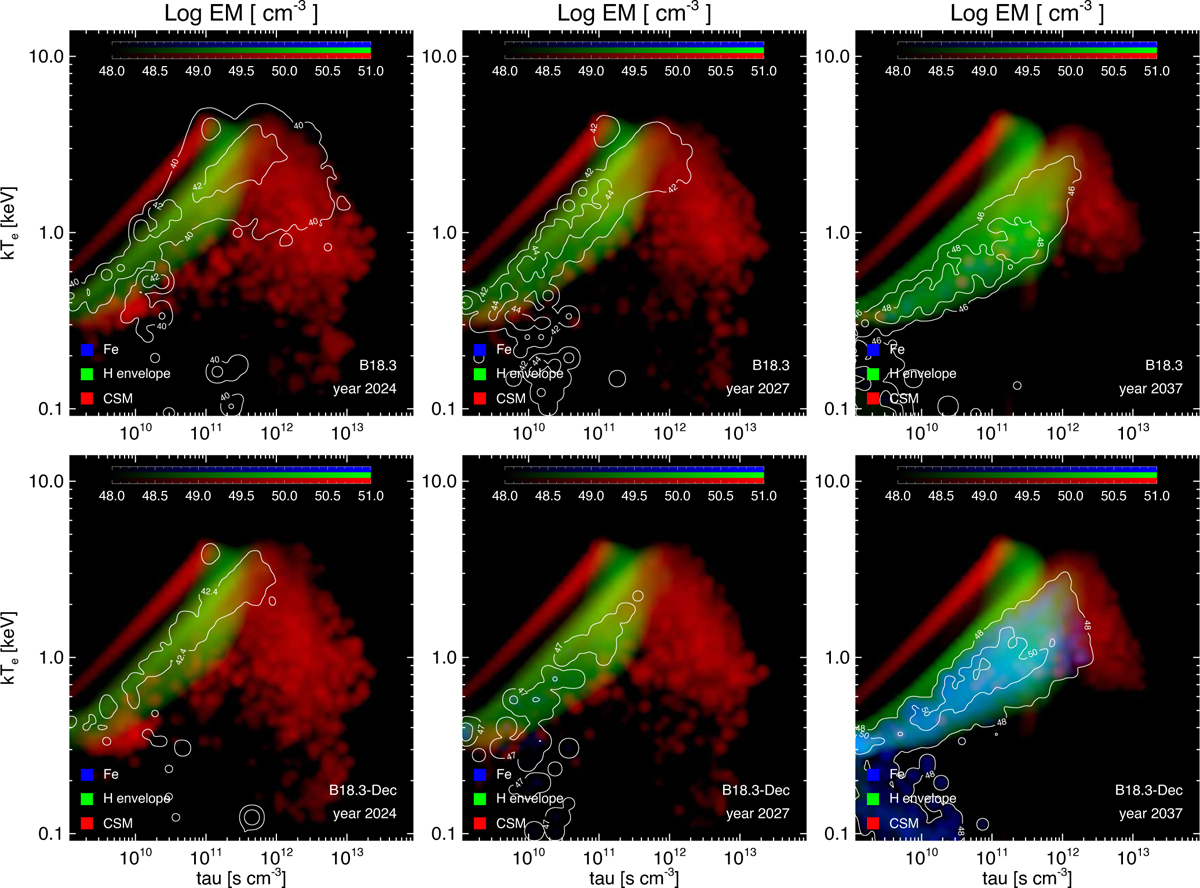
Distributions of EM as a function of electron temperature (kTe) and ionization timescale (τ = net) at the labeled times for models B18.3 (upper panels) and B18.3-Dec (lower panels). The panels present three-color composite images of the EM distributions, where different colors represent contributions from distinct shocked plasma components: shocked CSM (red), shocked material from the H envelope (green), and shocked Fe-rich ejecta (blue). White contours highlight the regions dominated by Fe.
Current usage metrics show cumulative count of Article Views (full-text article views including HTML views, PDF and ePub downloads, according to the available data) and Abstracts Views on Vision4Press platform.
Data correspond to usage on the plateform after 2015. The current usage metrics is available 48-96 hours after online publication and is updated daily on week days.
Initial download of the metrics may take a while.