Fig. 5
Download original image
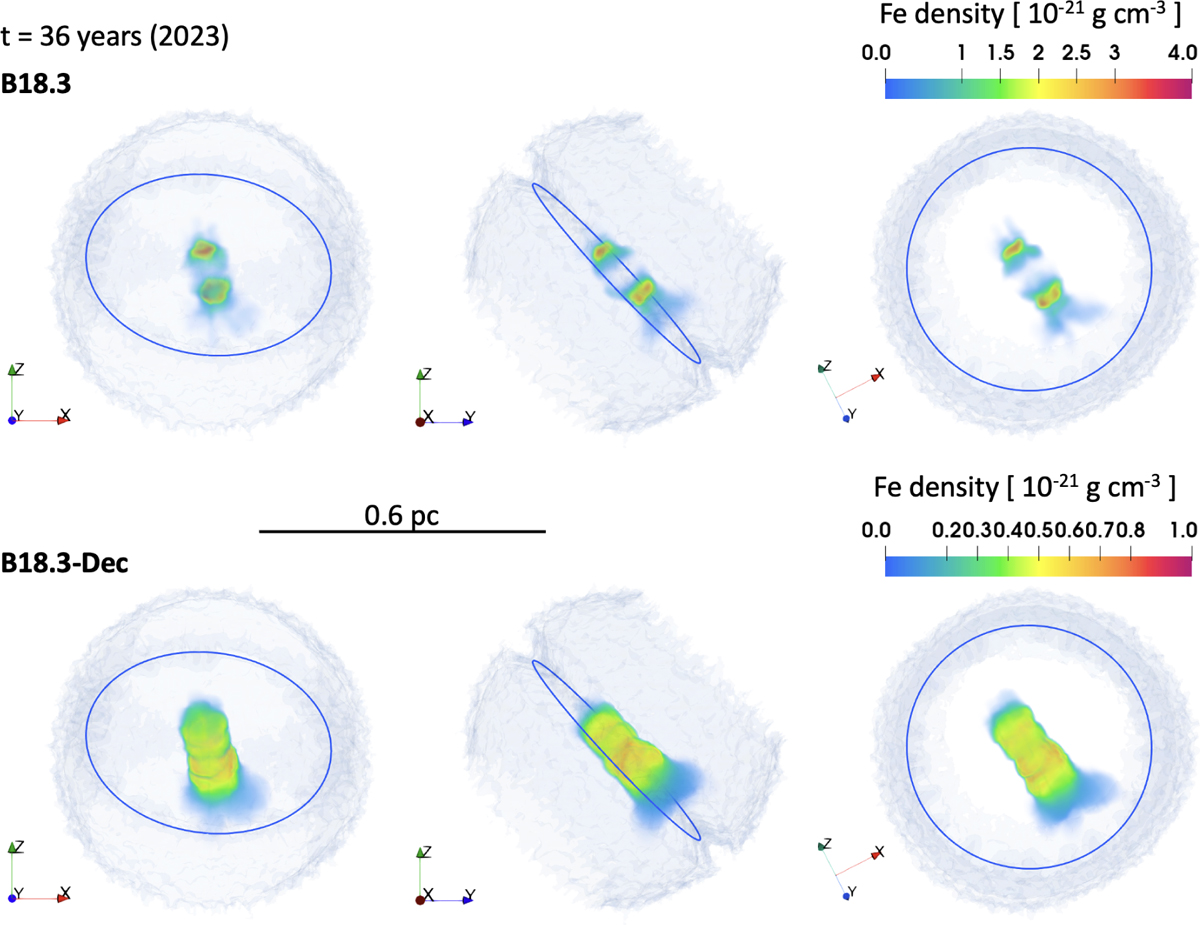
Three-dimensional volume rendering of Fe-rich ejecta, with opacity scaled to reflect density variations, shown from different viewing angles. The visualization is based on model B18.3 (upper panels) and B18.3-Dec (lower panels) at t = 36 years after the SN (corresponding to February 2023). The color bars on the right indicate the Fe density for each case. The blue circle marks the nominal position of the equatorial ring, while the semi-transparent diffuse structure represents the distribution of He-rich ejecta near the reverse shock, as shown in Fig. 4. Earth’s vantage point corresponds to the negative y-axis.
Current usage metrics show cumulative count of Article Views (full-text article views including HTML views, PDF and ePub downloads, according to the available data) and Abstracts Views on Vision4Press platform.
Data correspond to usage on the plateform after 2015. The current usage metrics is available 48-96 hours after online publication and is updated daily on week days.
Initial download of the metrics may take a while.